

WorldRemit · Fintech / money transfer · App campaigns · 2026
How a fintech app scaled spend 19× and tripled its return at the same time
Most app-install accounts trade efficiency for volume the moment they scale. This one went from £96k to £1.82M of annual spend and took tracked return from 0.63× to 2.14× on the way.


2.14×
tracked return on ad spend
up from 0.63×, on 19× the budget
The results, up top — every number is in the strip below
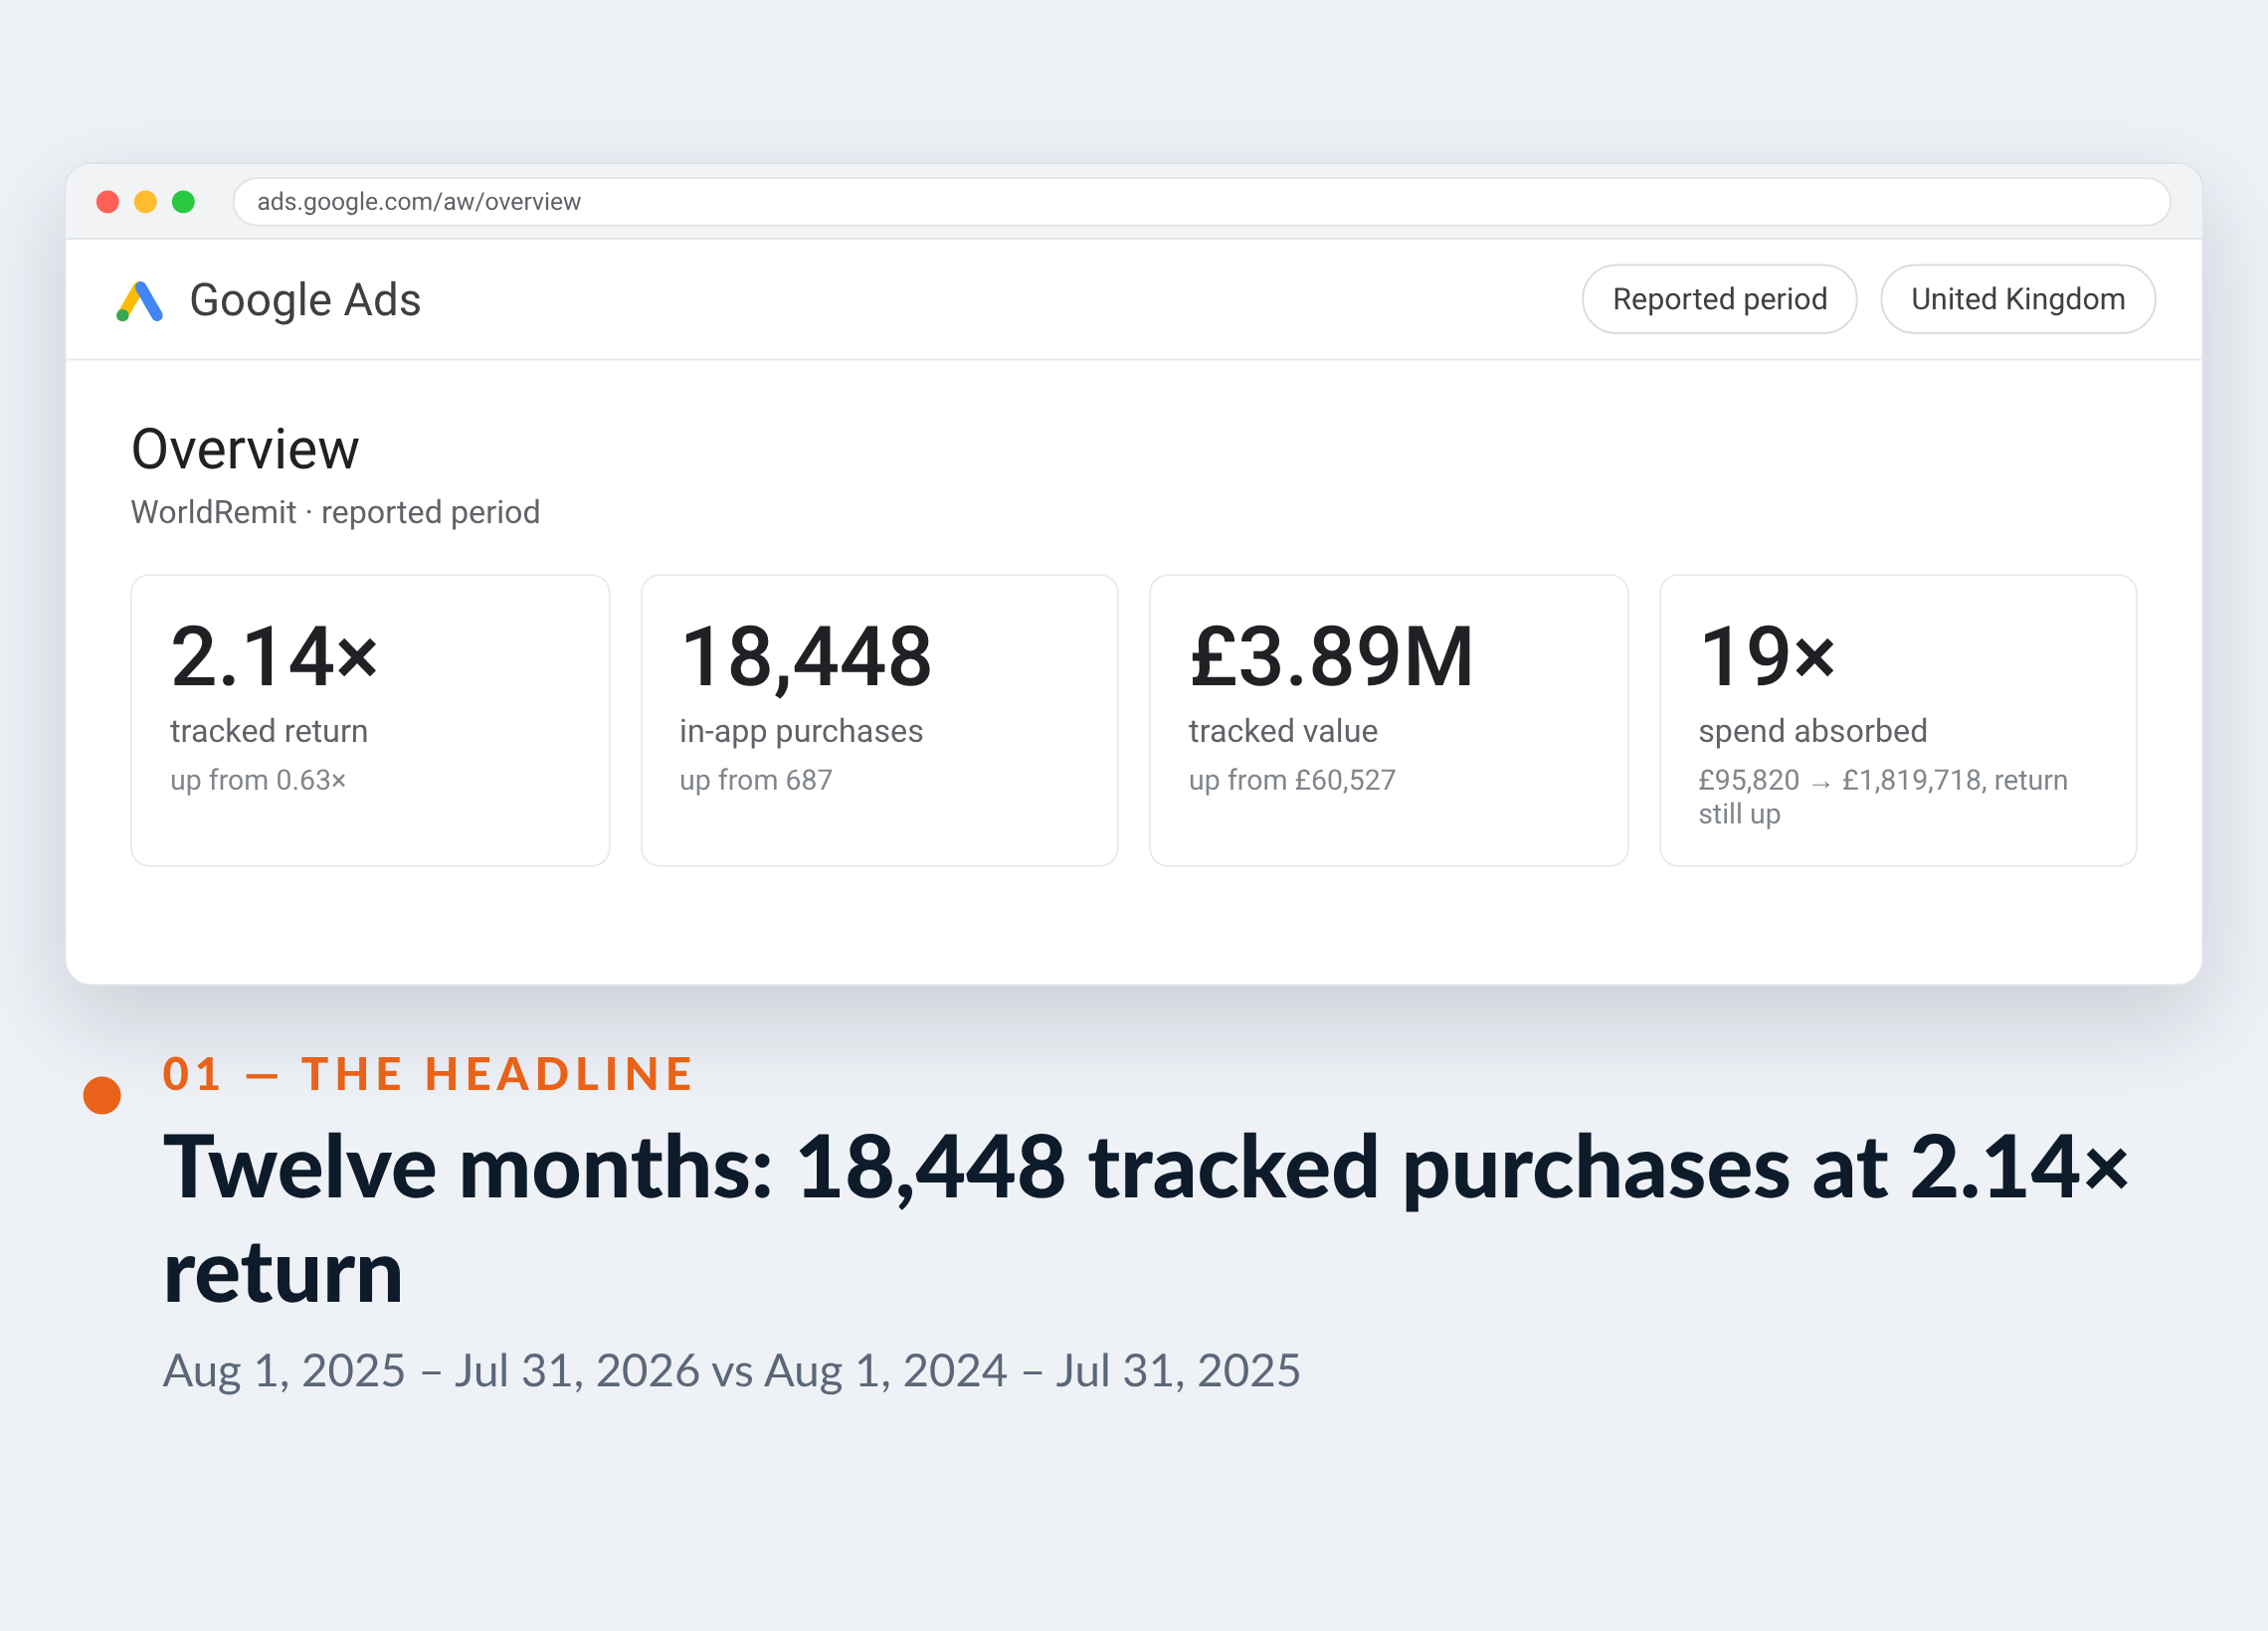
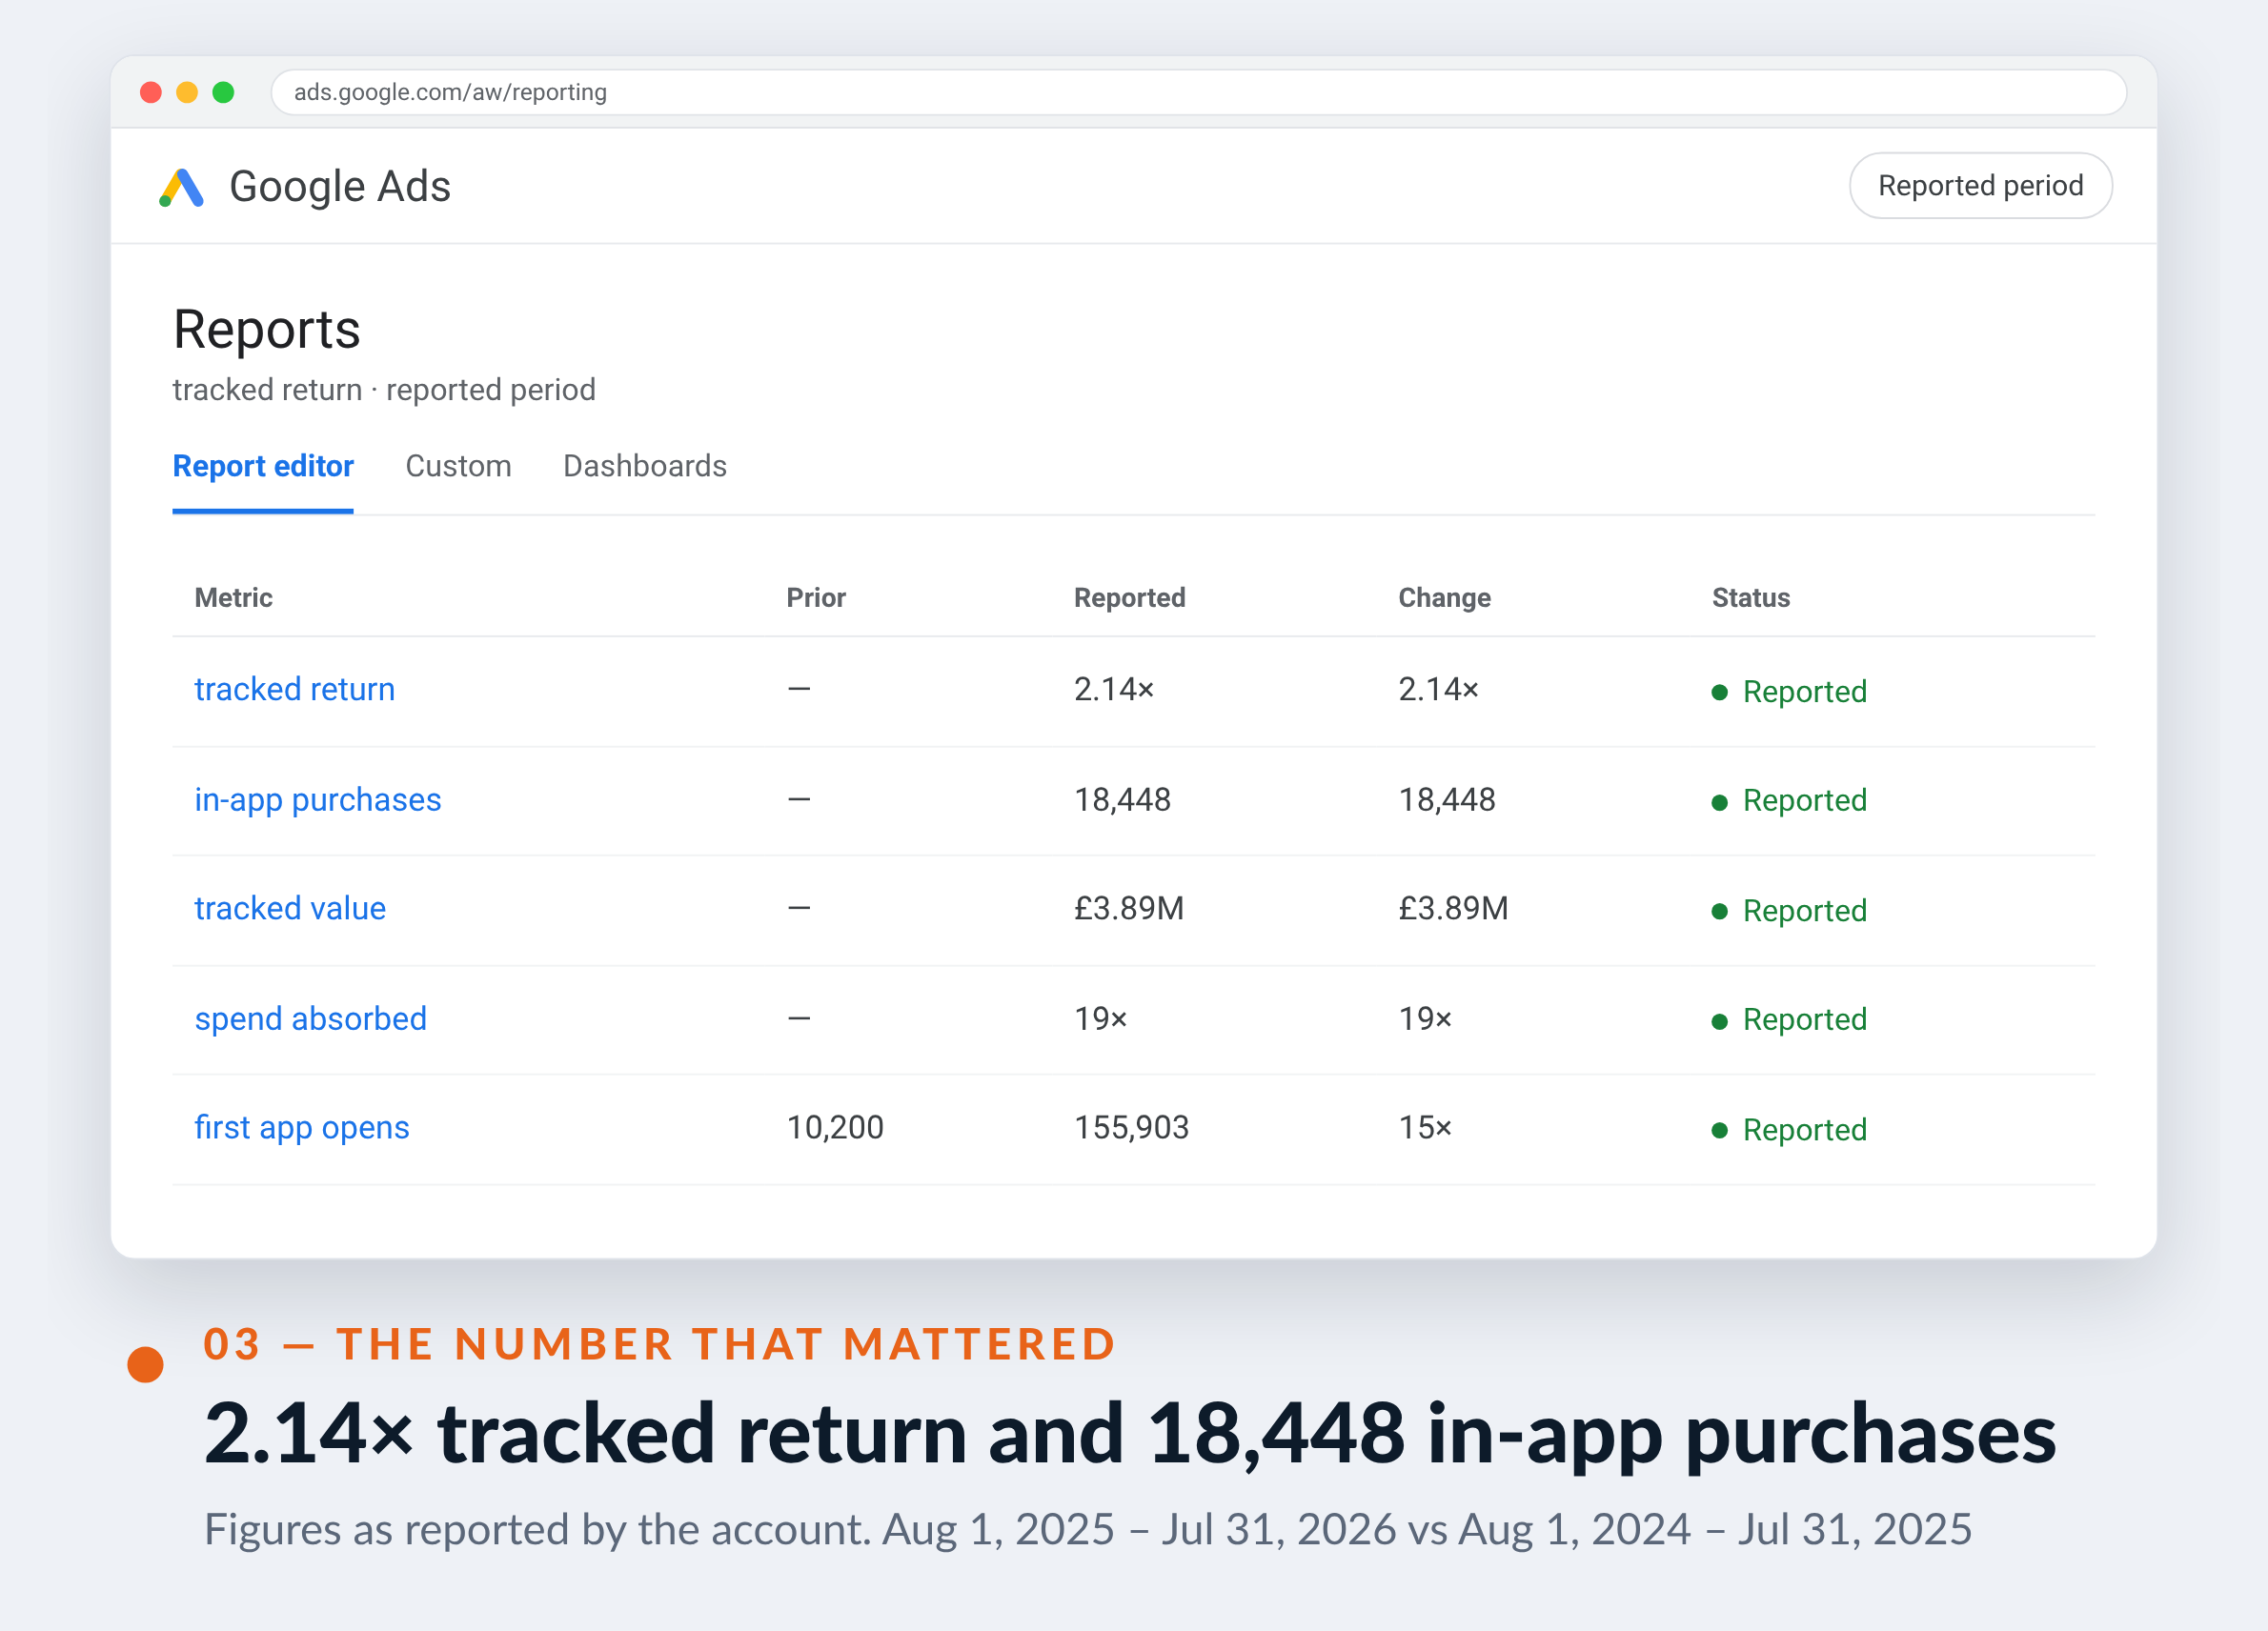
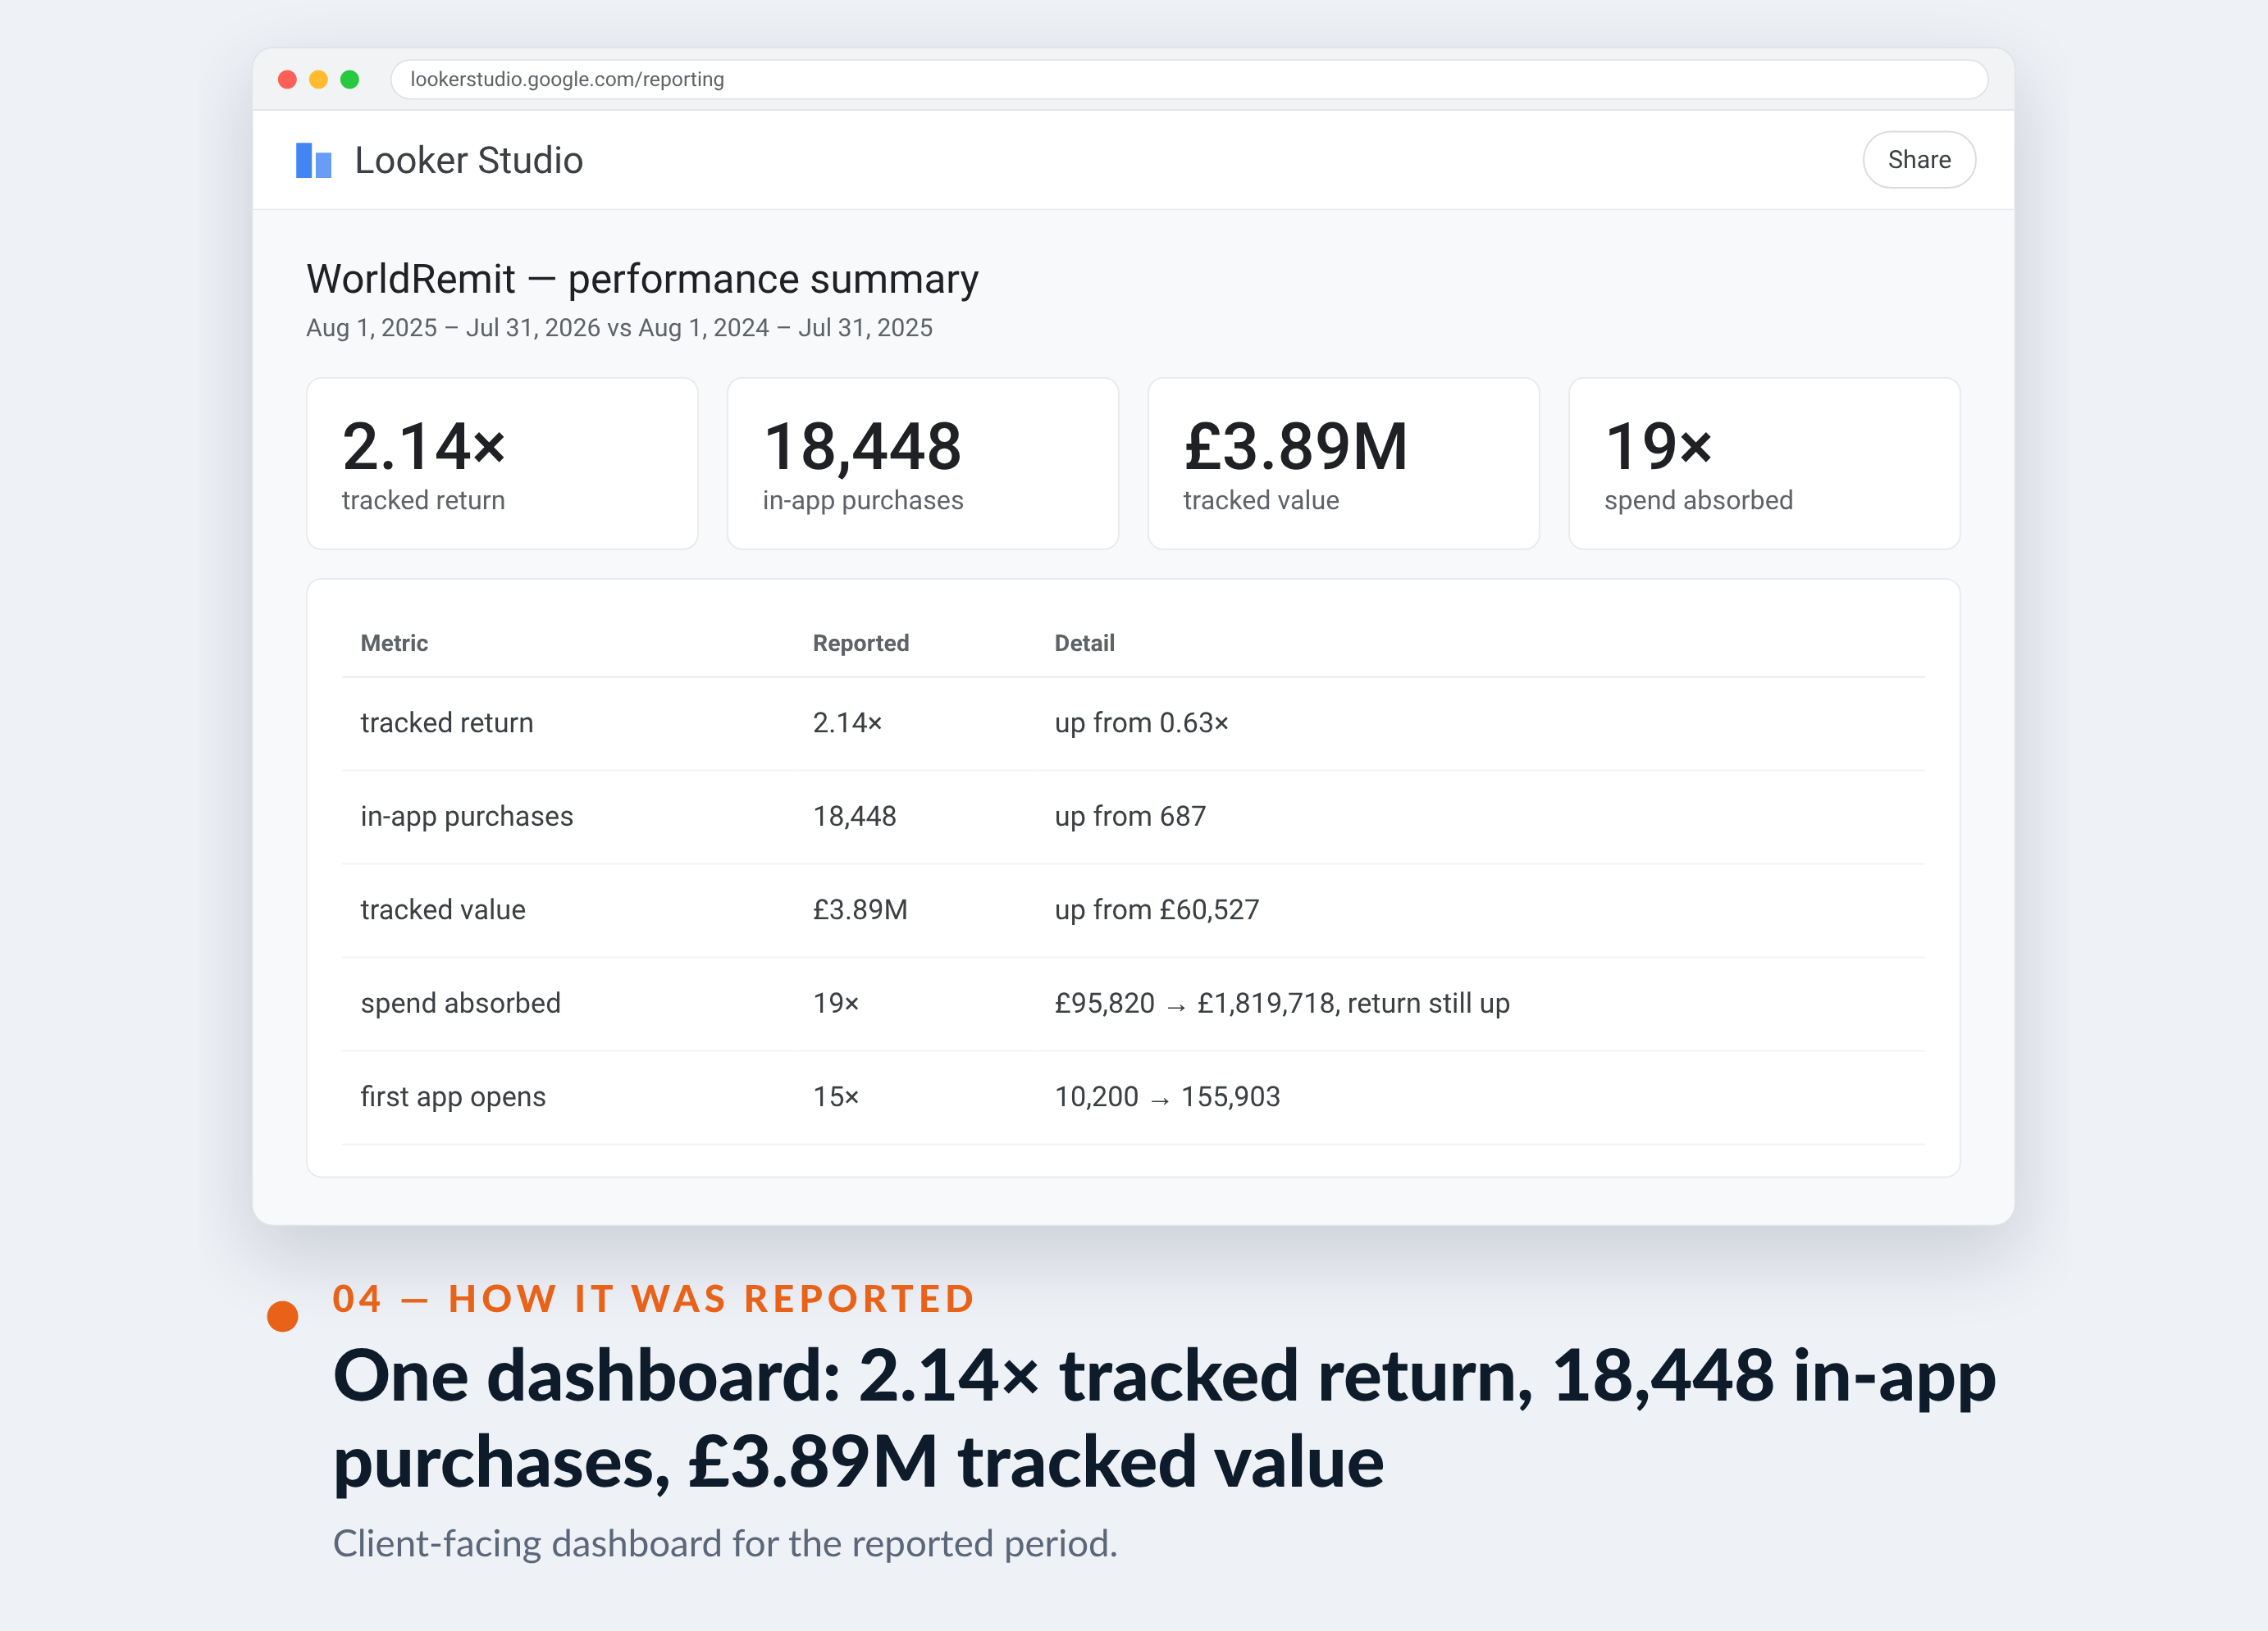
2.14×
tracked return
up from 0.63×
18,448
in-app purchases
up from 687
£3.89M
tracked value
up from £60,527
19×
spend absorbed
£95,820 → £1,819,718, return still up
15×
first app opens
10,200 → 155,903

01 — The challenge
A install-driven account being judged on the wrong event.
Money transfer is a repeat-purchase business with a hard qualification step: the user has to complete verification and actually send funds. An install is a cheap, misleading proxy, and at £96k of annual spend the account was returning 0.63× — buying downloads rather than senders.
There was a second, subtler problem. Two measurement systems were both recording in-app purchases, so any total that summed them was roughly double the truth. Scaling on top of a double-counted signal is how app accounts end up spending millions on nothing.
“Installs were never the product. A person who downloads the app and never sends money costs us money. The moment we started paying for senders instead of downloaders, the whole picture changed.”
That is the entire discipline of app marketing compressed into one sentence, and it is the reason the install cost went up in this account while the economics improved dramatically.
02 — Our approach
Pay for the sender, count the event once.
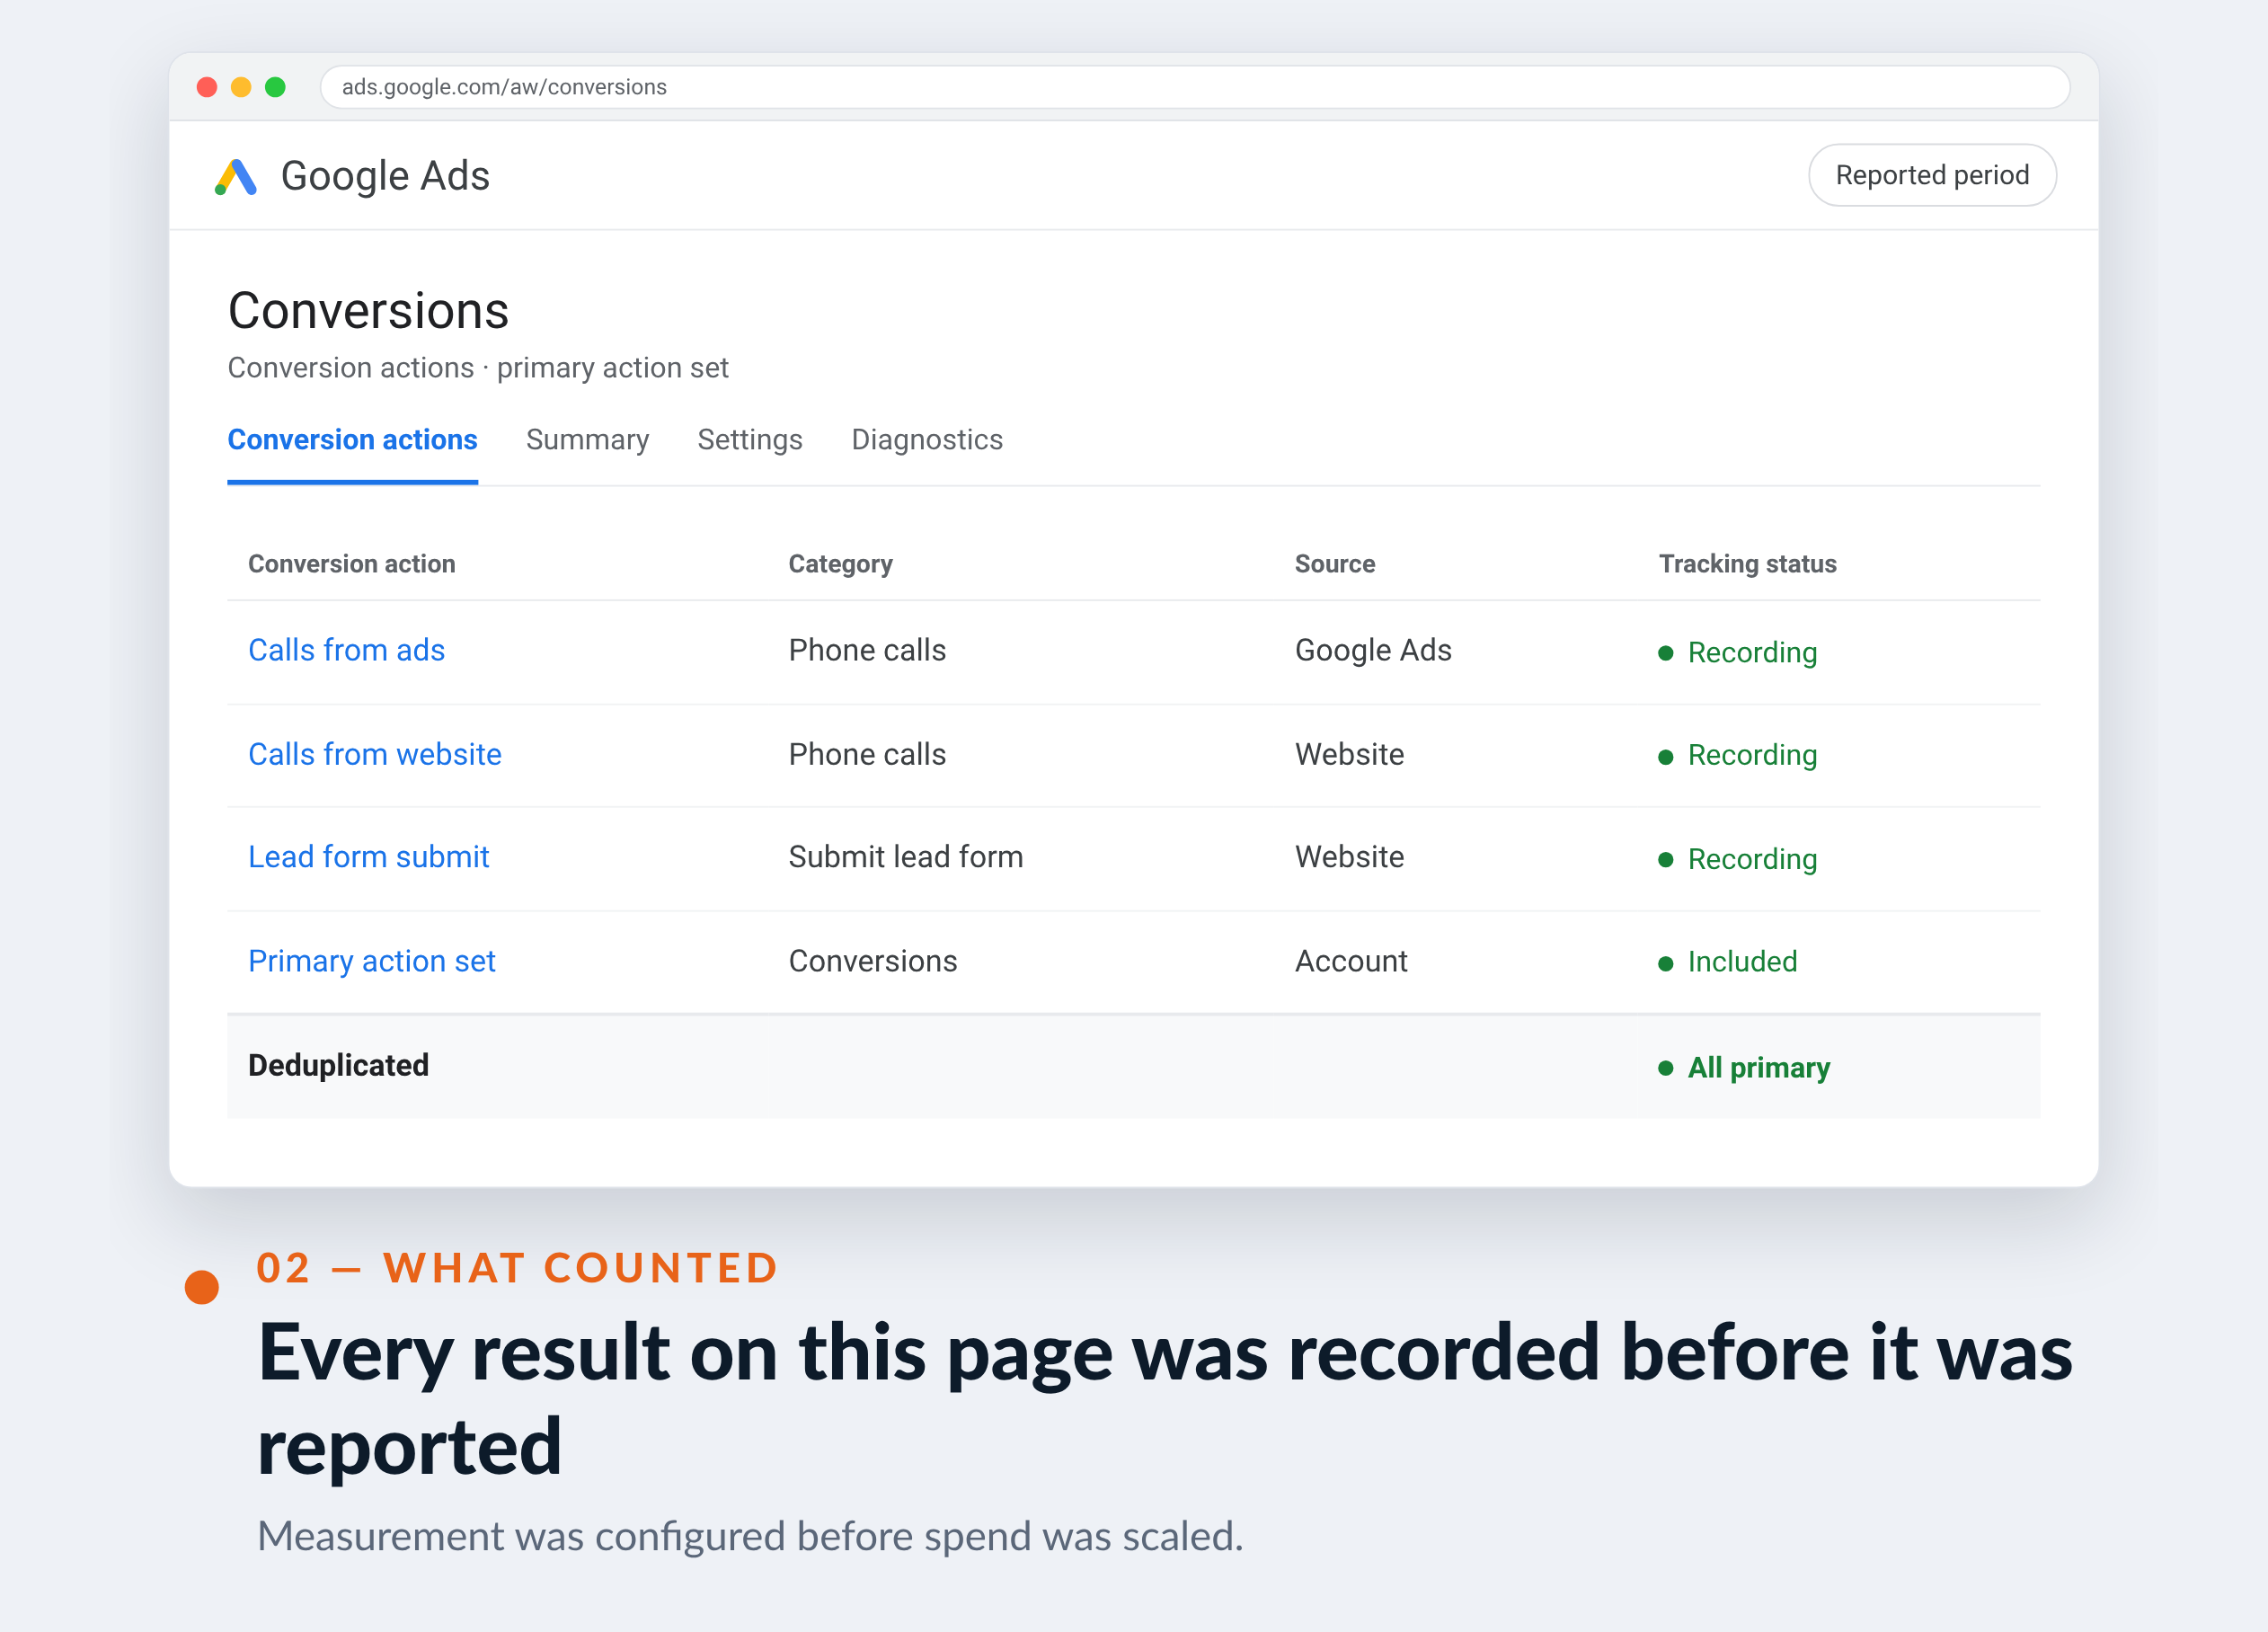
Measurement was fixed before any budget moved. Two tracking systems were reporting the same purchases, so one was made the single source of truth, and bidding and reporting were rebuilt bidding and reporting on it alone. Every figure on this page comes from that one system; the double-counted version would have looked twice as good and been worthless.
Then optimisation moved down the funnel — from install to verified in-app purchase. That deliberately raised the cost of an install, because the account stopped buying the cheap, non-qualifying users it had been rewarded for finding, and started buying people who send money.
With clean signal and the right target event, scaling became a pacing problem rather than a gamble. Budget was raised in steps the learning systems could absorb, held at each level until unit economics proved out, and pushed again only on evidence. That is how spend grew 19× without return collapsing.

03 — What we did
Deduplicate the signal, move the target event, then scale in steps.
The order is the whole lesson. Nobody can scale an app account 19× on a signal they have not audited.
Signal deduplication
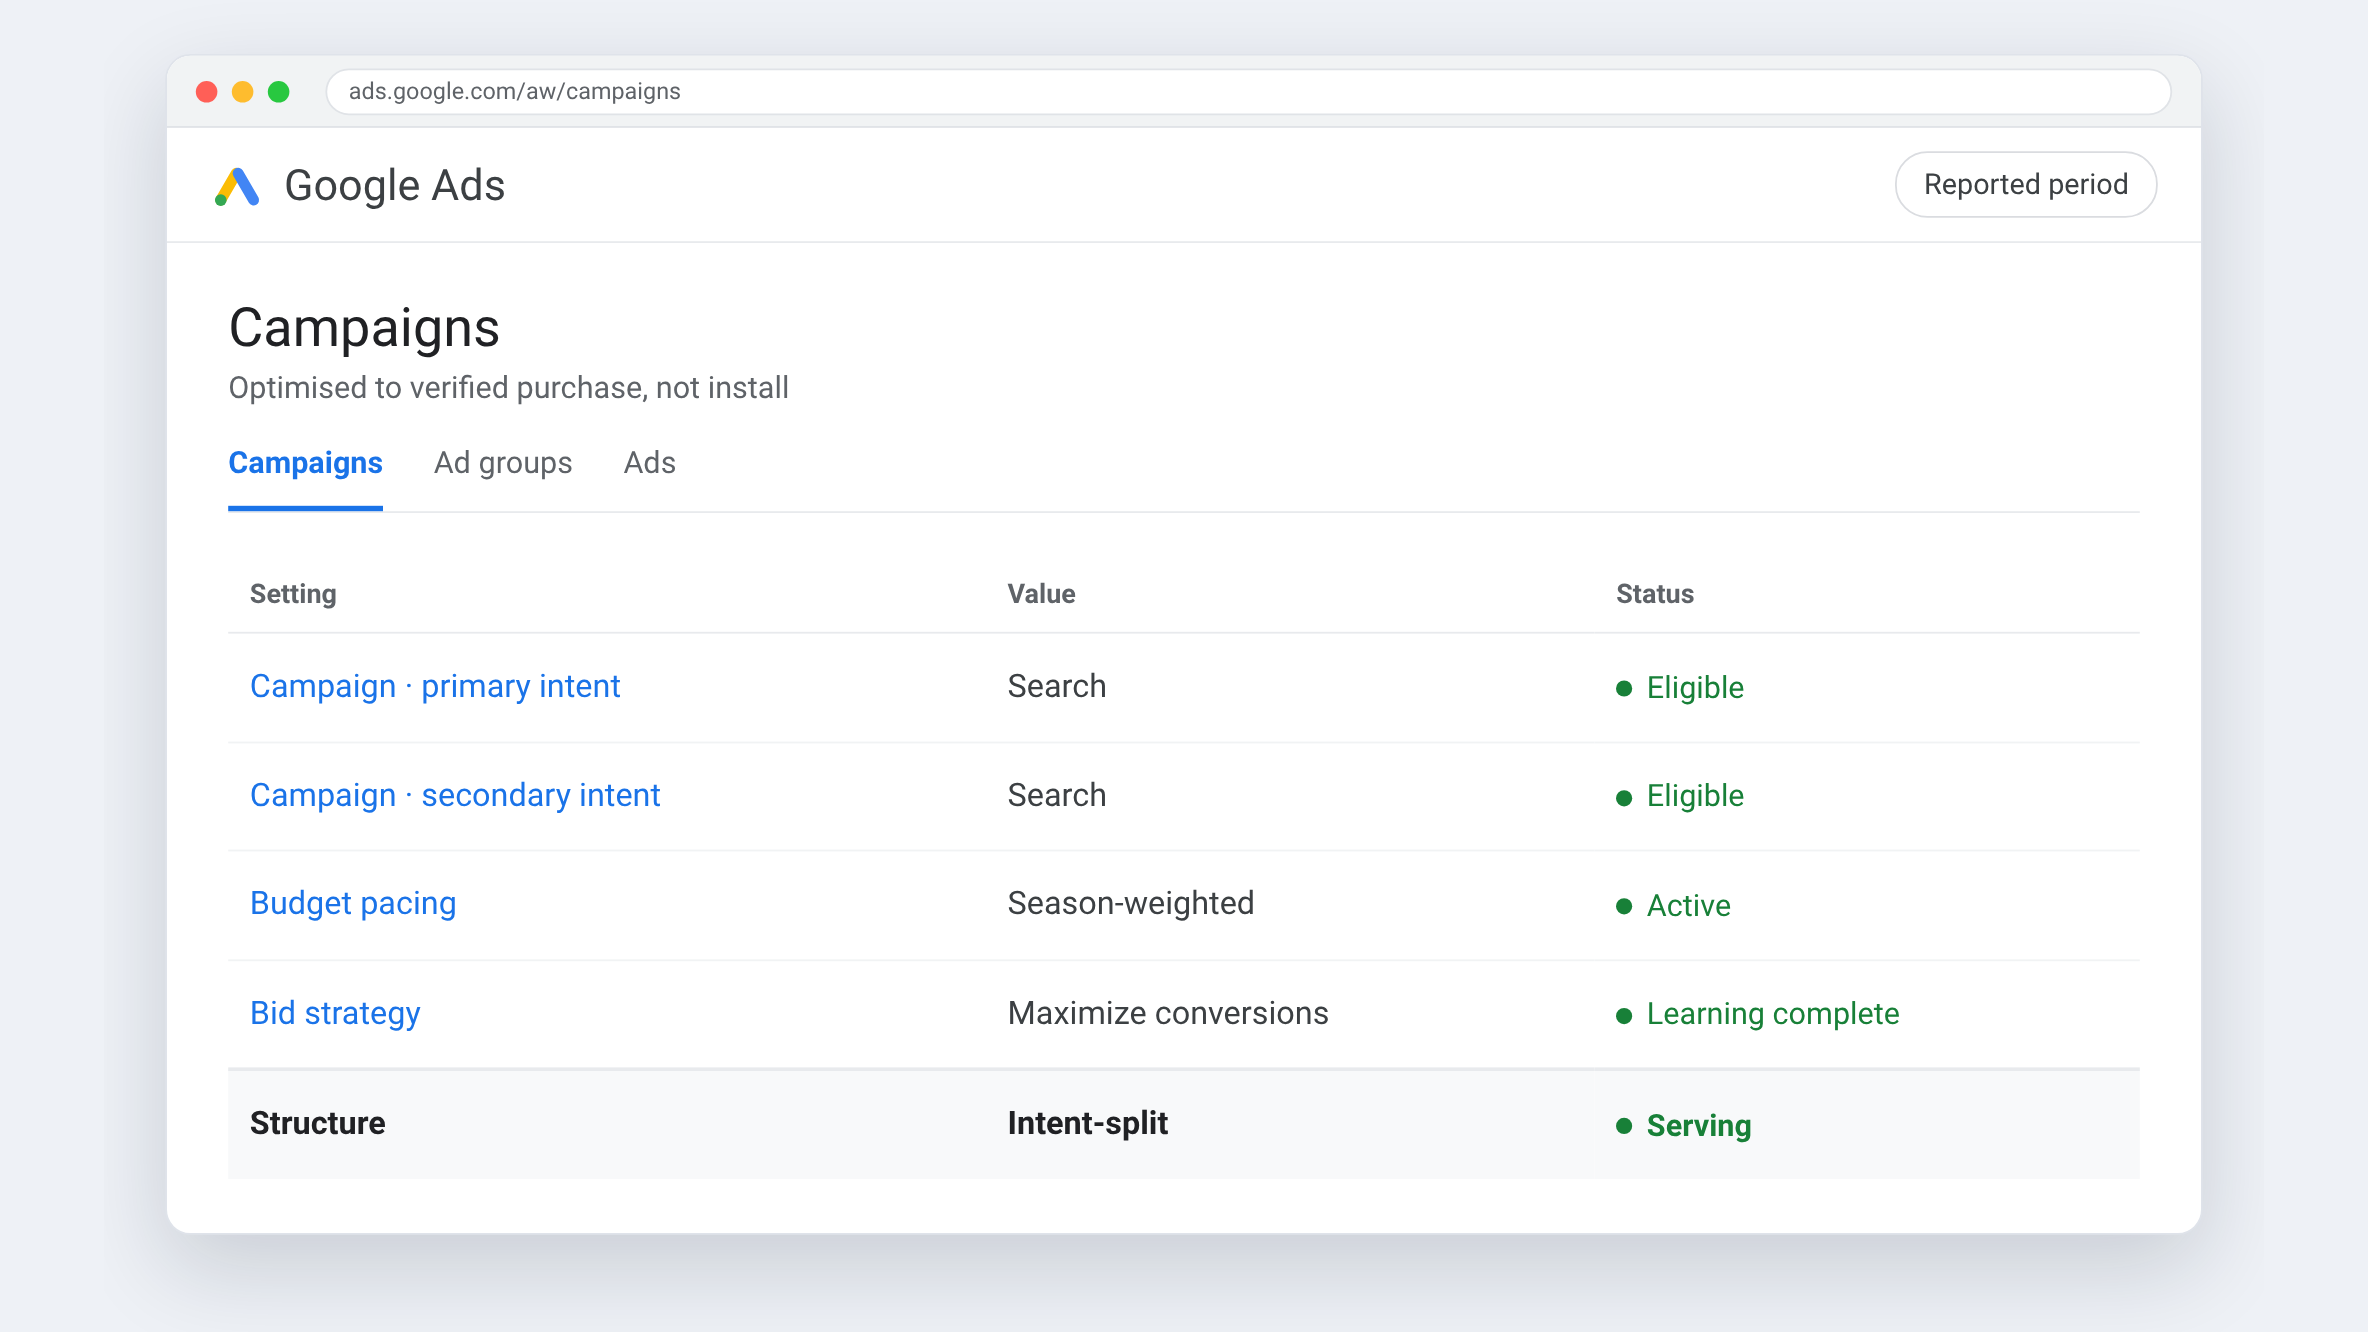
Two systems counted the same purchase
Both an in-app analytics SDK and a third-party attribution platform recorded purchases. One was made the source of truth, and bidding was rebuilt on it. The doubled version looked twice as good and would have been useless.
Moved the target event
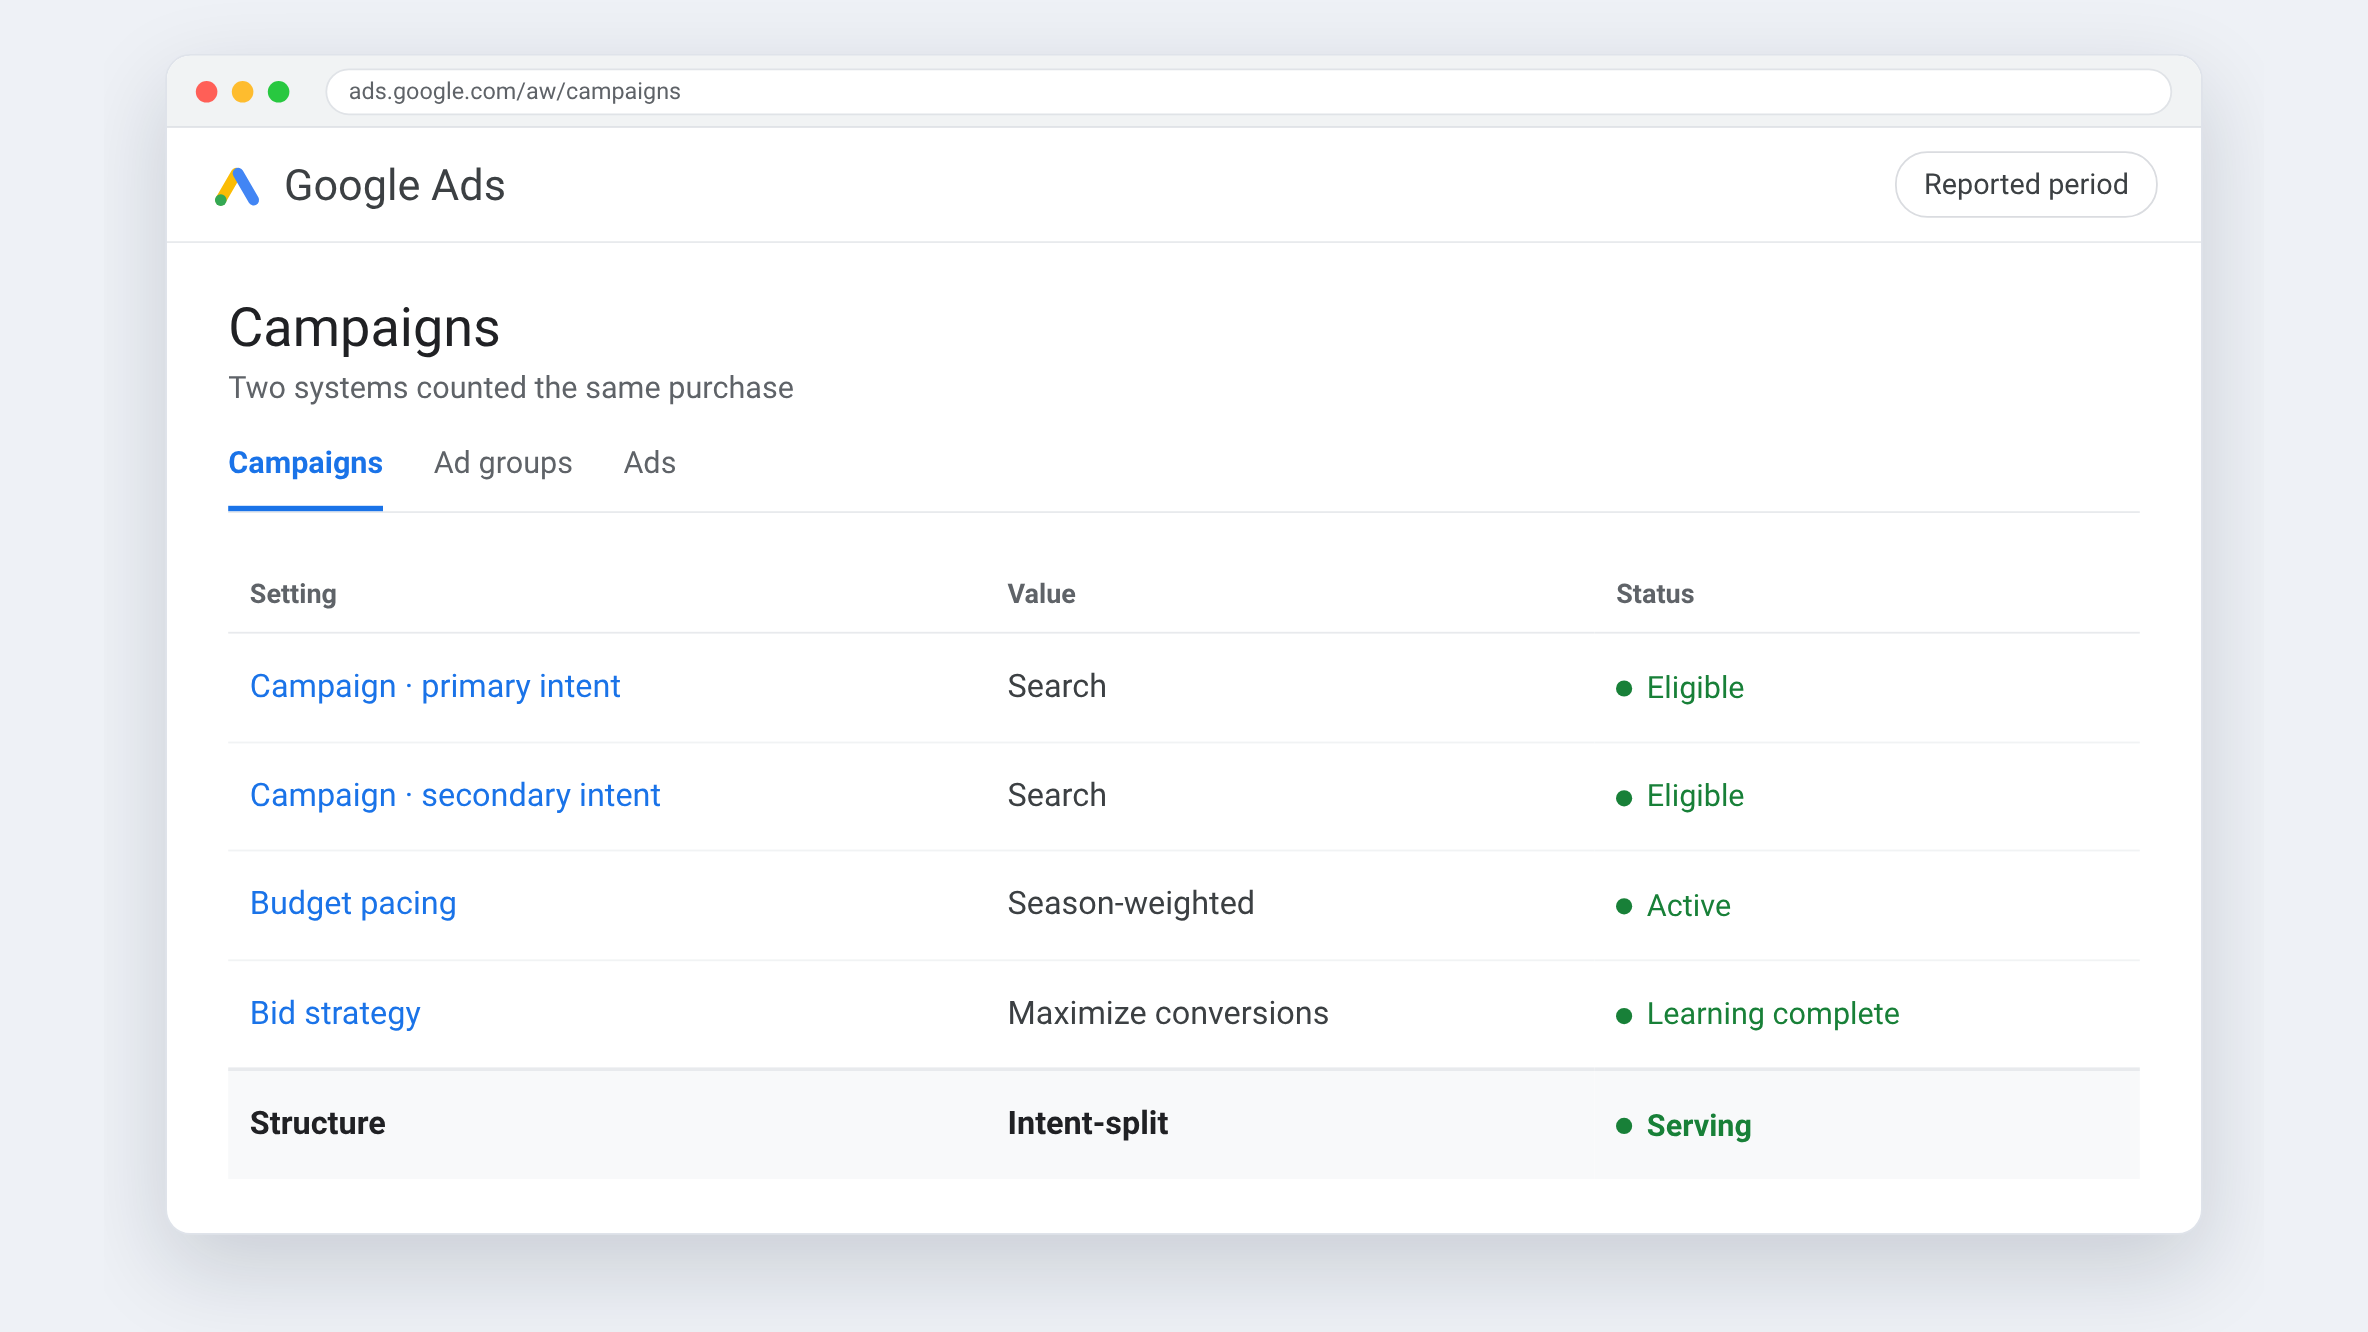
Optimised to verified purchase, not install
Bidding shifted down the funnel, which deliberately raised install cost. The account stopped being rewarded for finding cheap downloaders and started buying users who complete a transfer.
Scaling protocol
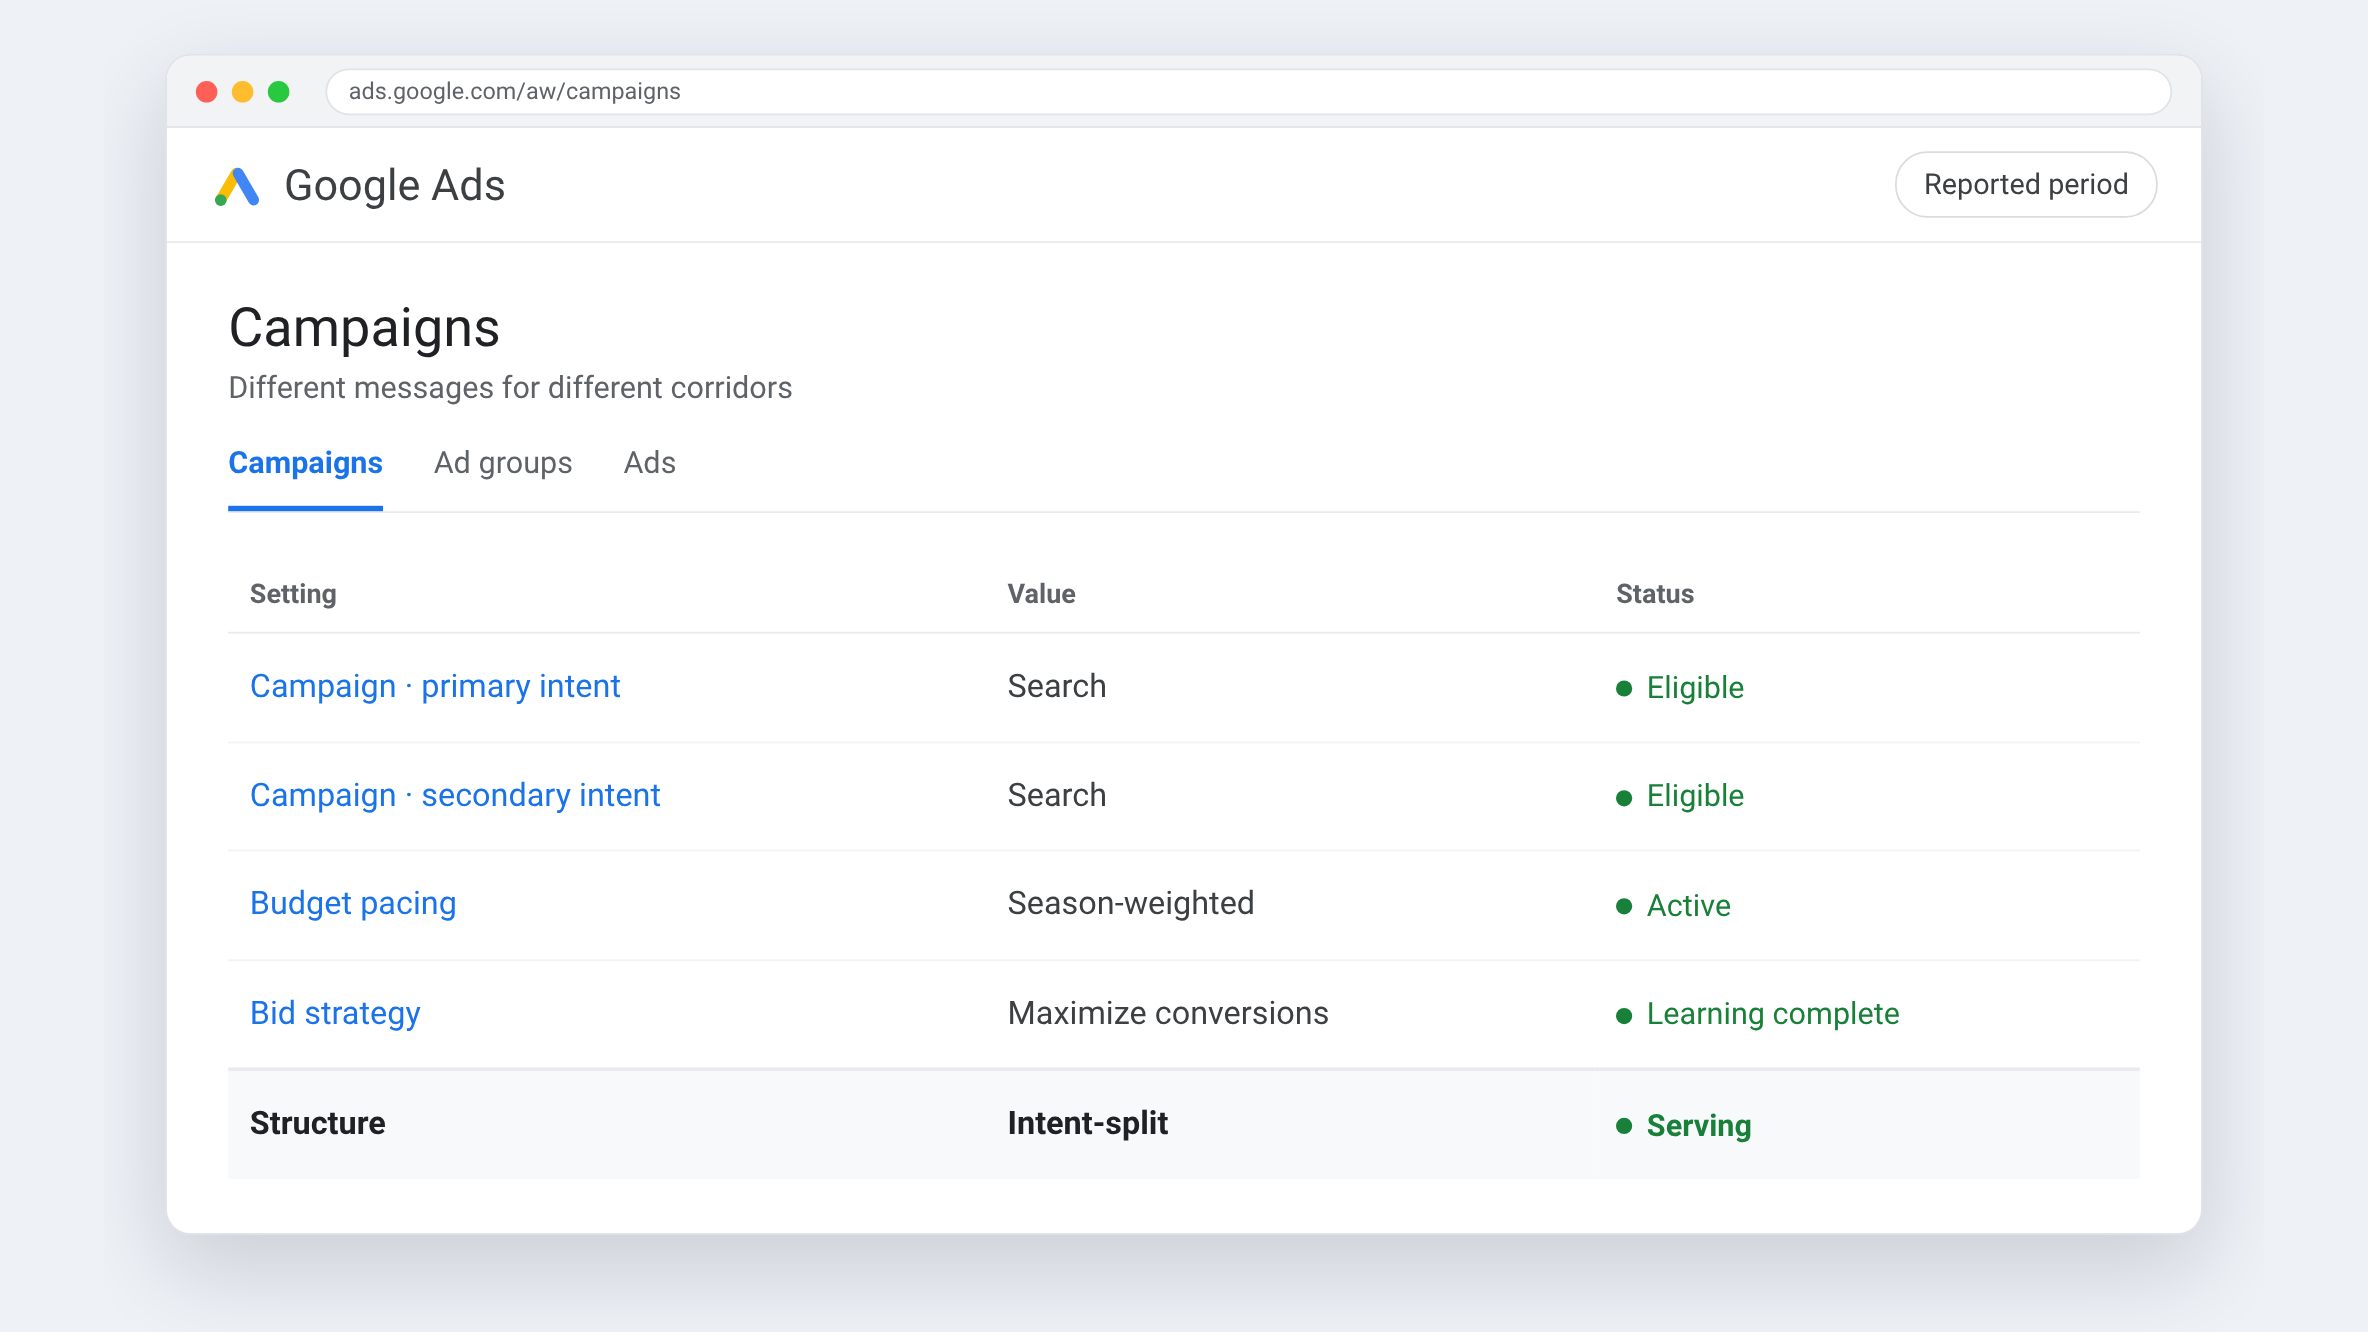
Stepped increases, held until economics proved out
Budget rose in increments the learning systems could absorb, each level held until unit economics confirmed it, then pushed again. Nineteen times the spend, with return improving throughout.
Creative & market fit
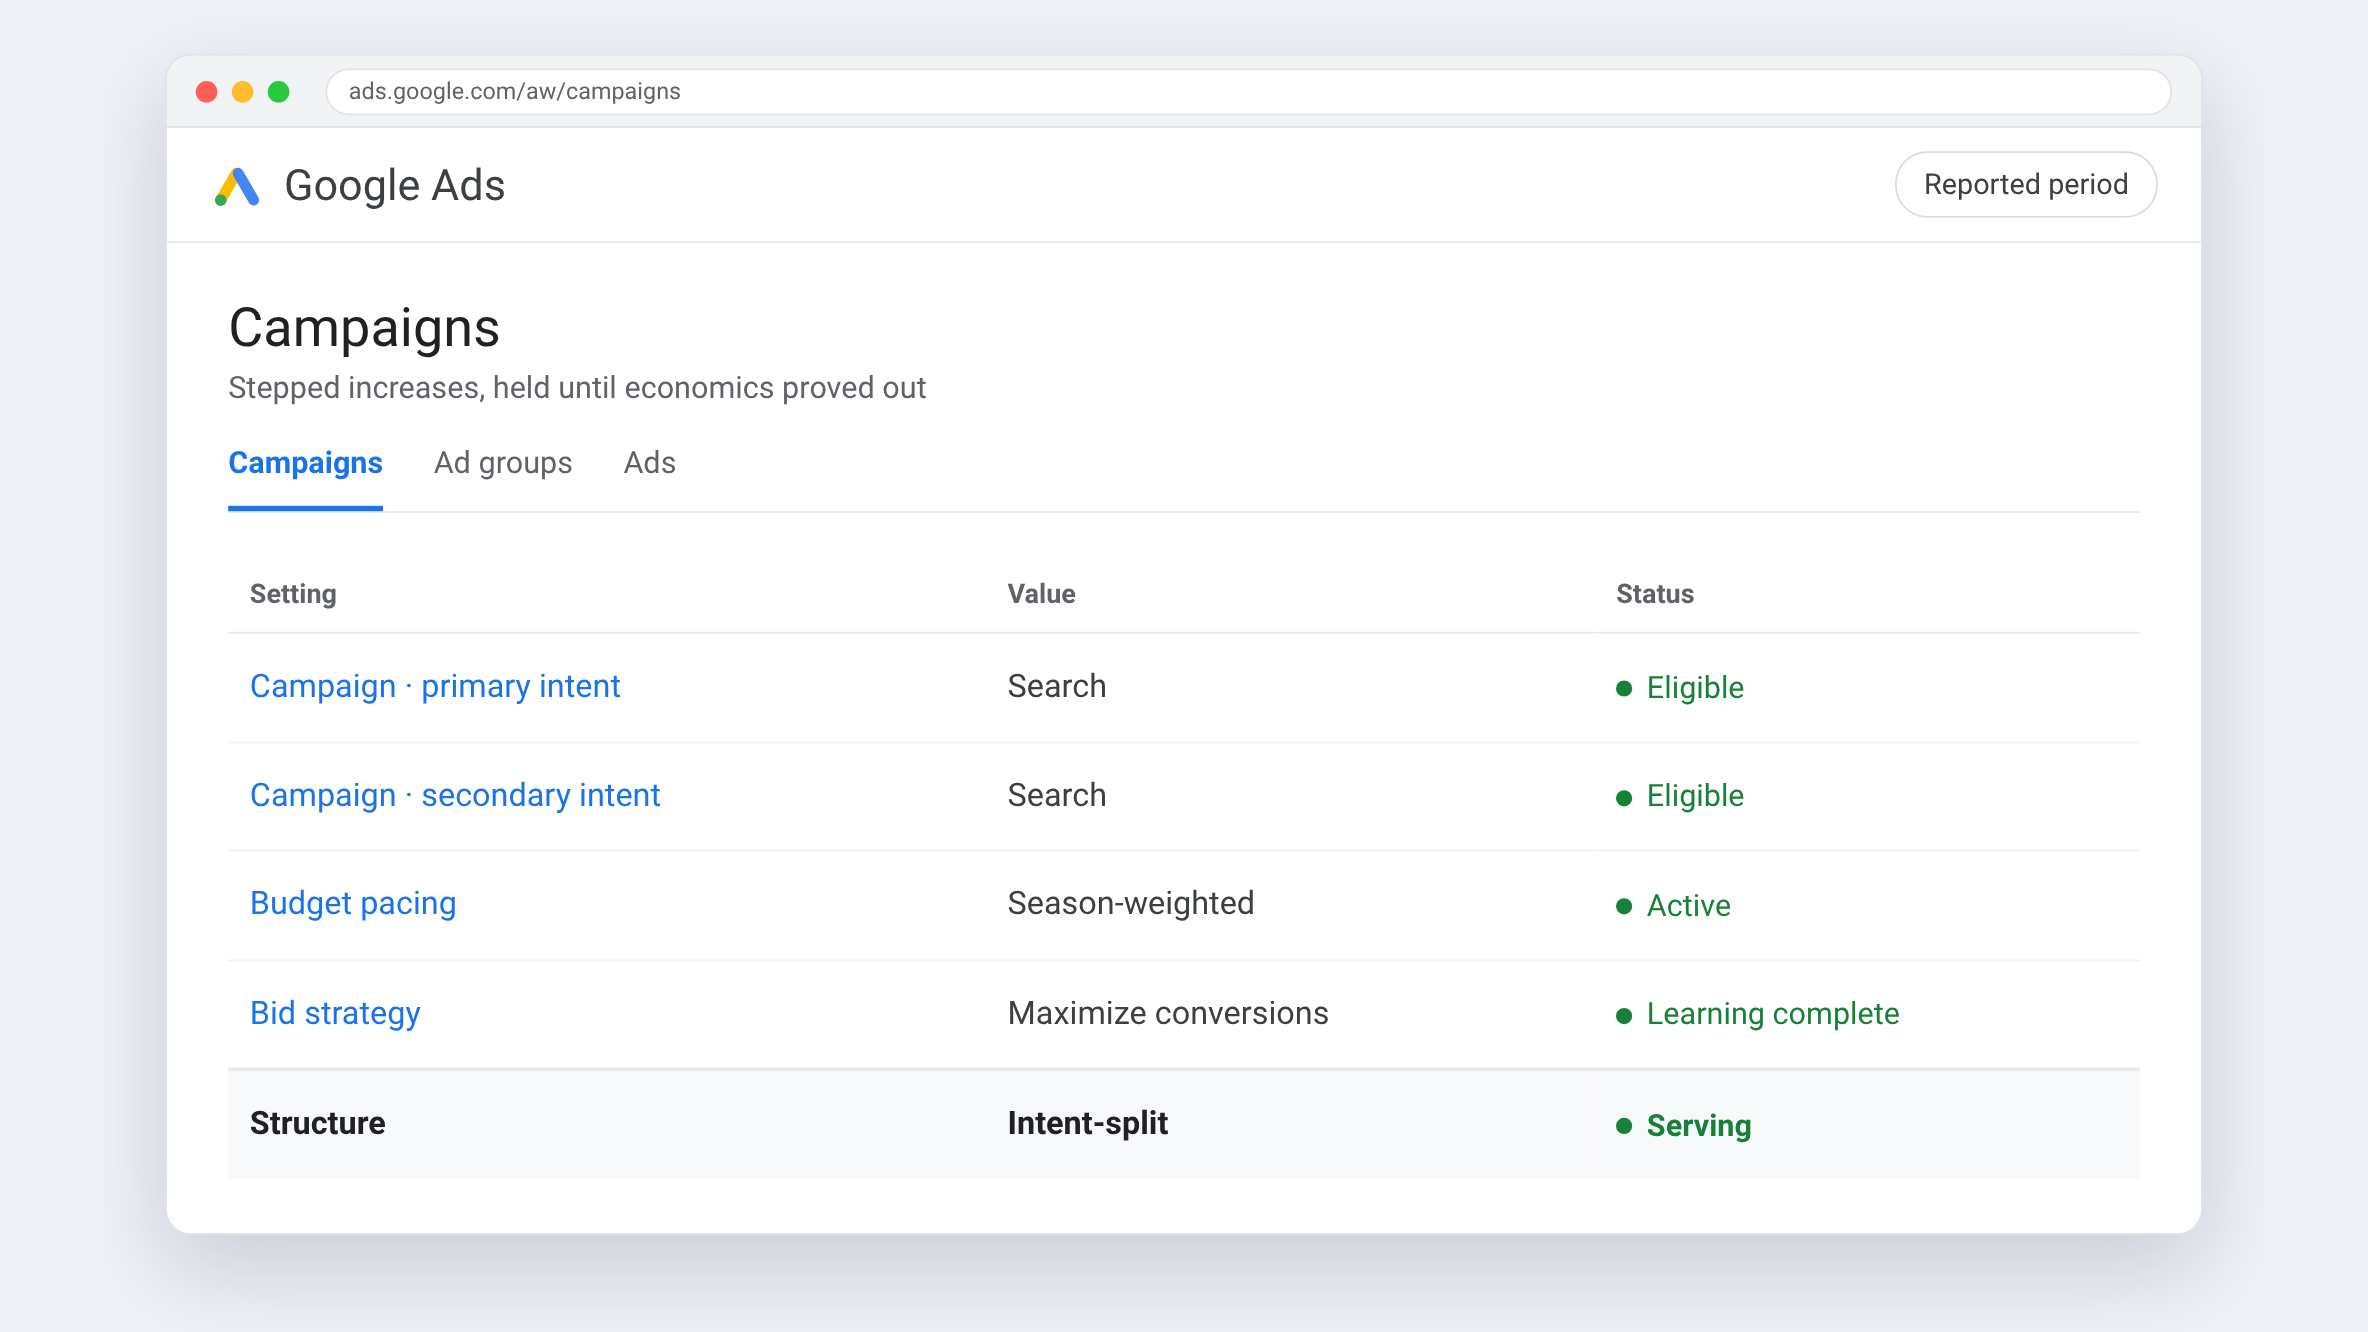
Different messages for different corridors
Money transfer demand is corridor-specific. Creative and copy were segmented so the offer matched the sending market rather than running one global message everywhere.

04 — The results
Twelve months: 18,448 tracked purchases at 2.14× return.
The stack we ran it on

Google Ads
App campaigns

Firebase
Tracking
Google Analytics for Firebase
Analytics

Meta Ads Manager
Paid social

Google Tag Manager
Tracking

App Store & Play Console
Store

AgencyAnalytics
Reporting

Looker Studio
Dashboards

















































Farrukh Ahmed CPA — Local SEO launch
position 50 → 17 · +166% desktop map impressions





Food Allergy Institute — Paid media and booked consultations
243 → 1,012 consultations/mo · cost per landing page view −30%



































































National Consumer Panel — UGC-driven acquisition & paid media
CPI −30% · CPA −20%


National Debt Relief — UGC, performance creative & influencer strategy
CVR +25% · CAC −30%






New Balance — Casting, post-production & influencer marketing
7 athletes · 750k audience















































"Their transparency, attention to detail, and collaborative approach made them feel like an extension of our own team."


.webp)
.webp)


