

Living Beauty · Beauty & skincare e-commerce · Paid search · 2026
How Living Beauty grew Google Ads purchases 225% — and improved ROAS while doing it
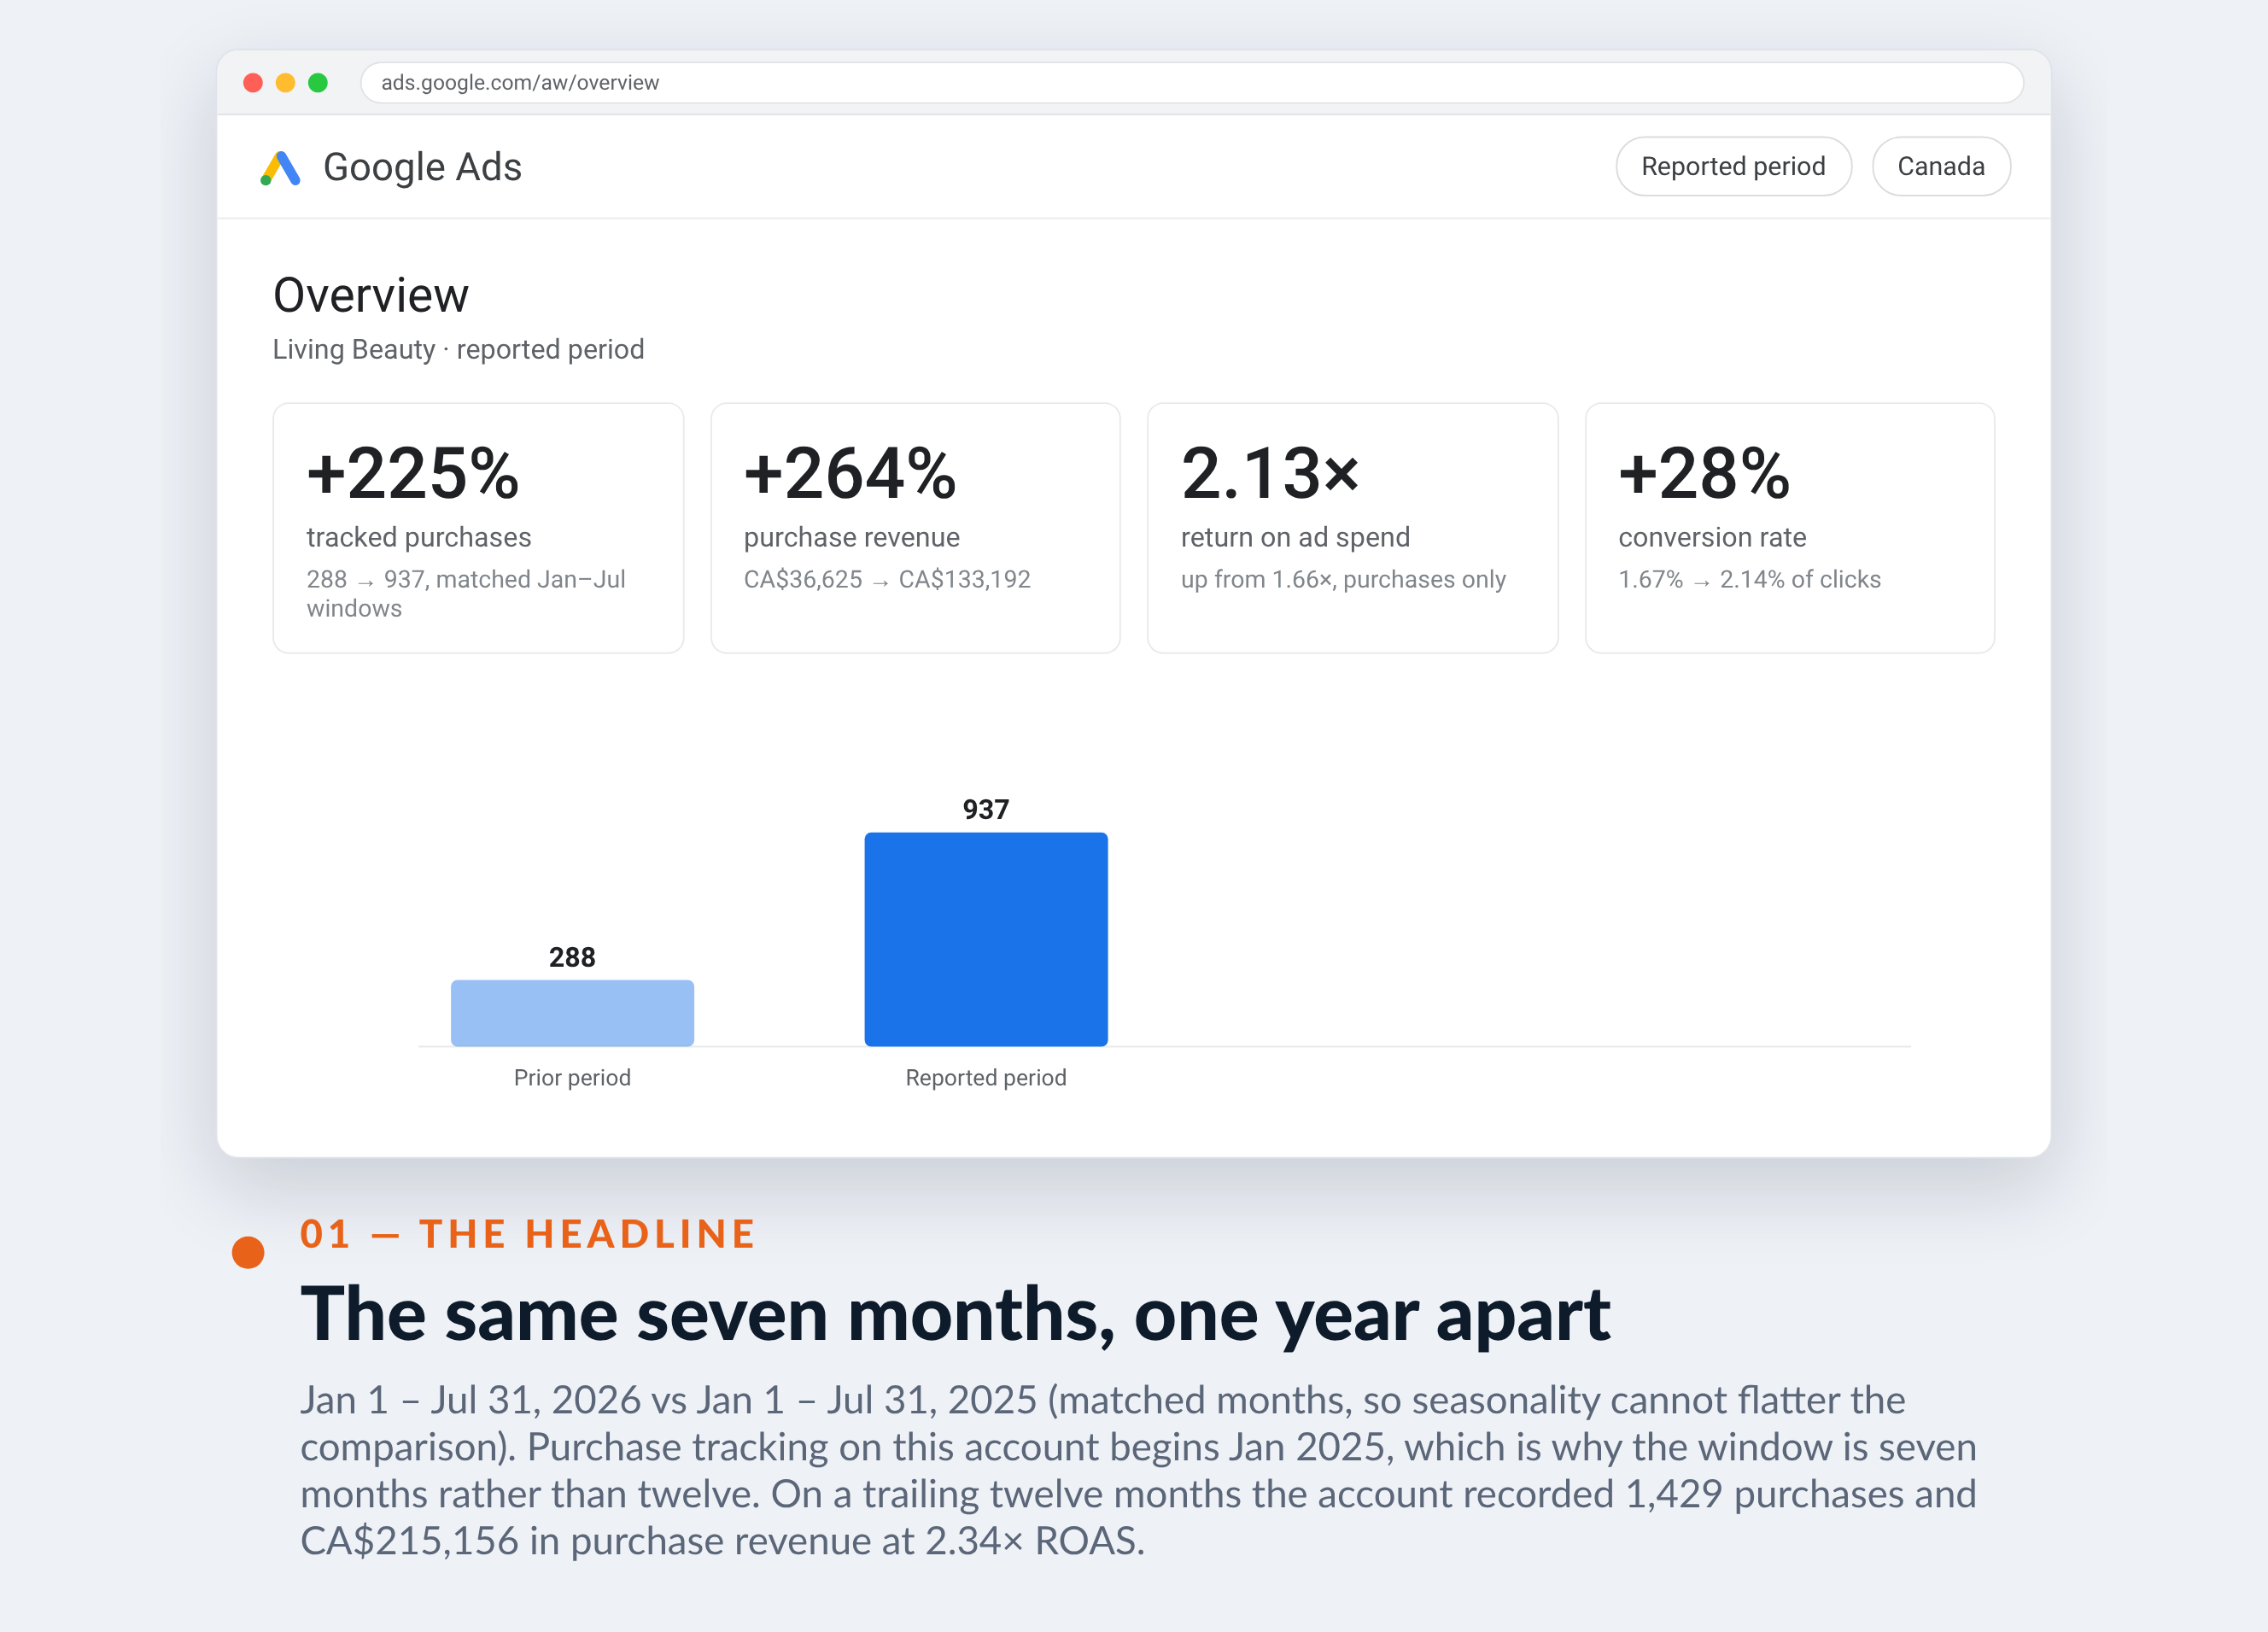
Scaling a beauty e-commerce account usually costs you efficiency. Over matched seven-month windows, Living Beauty nearly tripled its spend, more than tripled its purchases, and still returned more per dollar than the year before.

+225%
tracked purchases
288 → 937, Jan–Jul year over year
The results, up top — every number is in the strip below
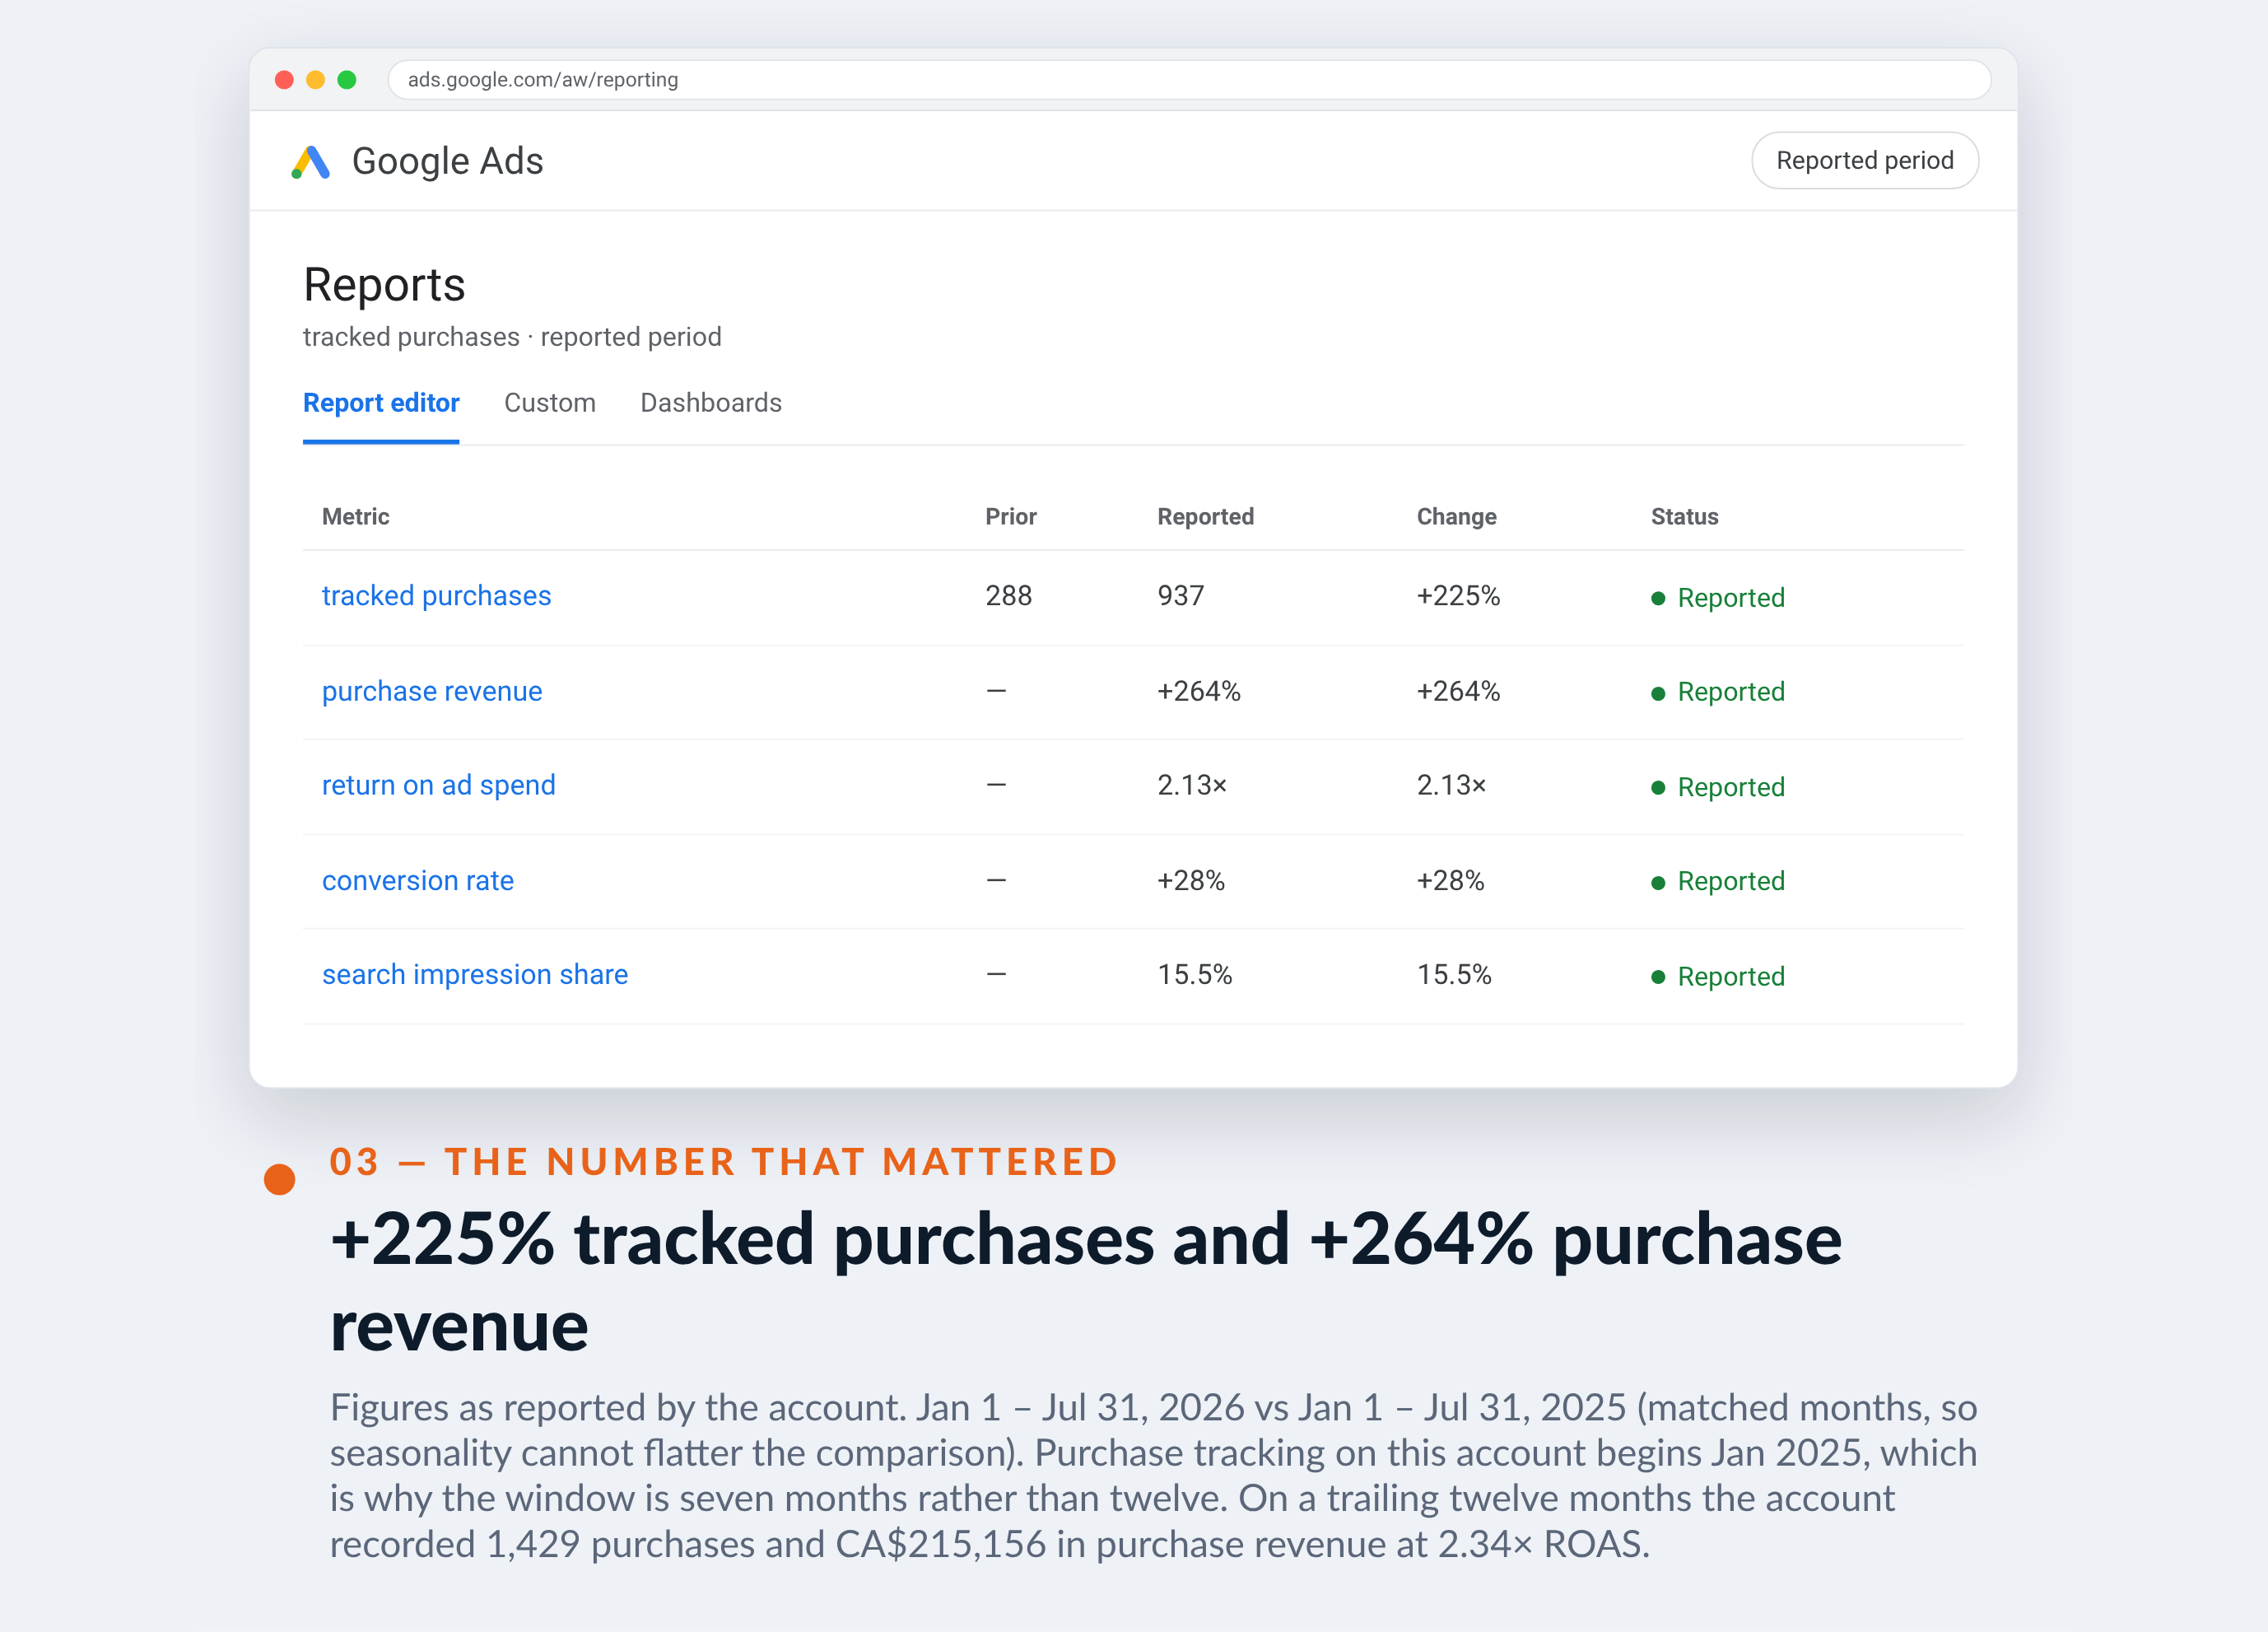
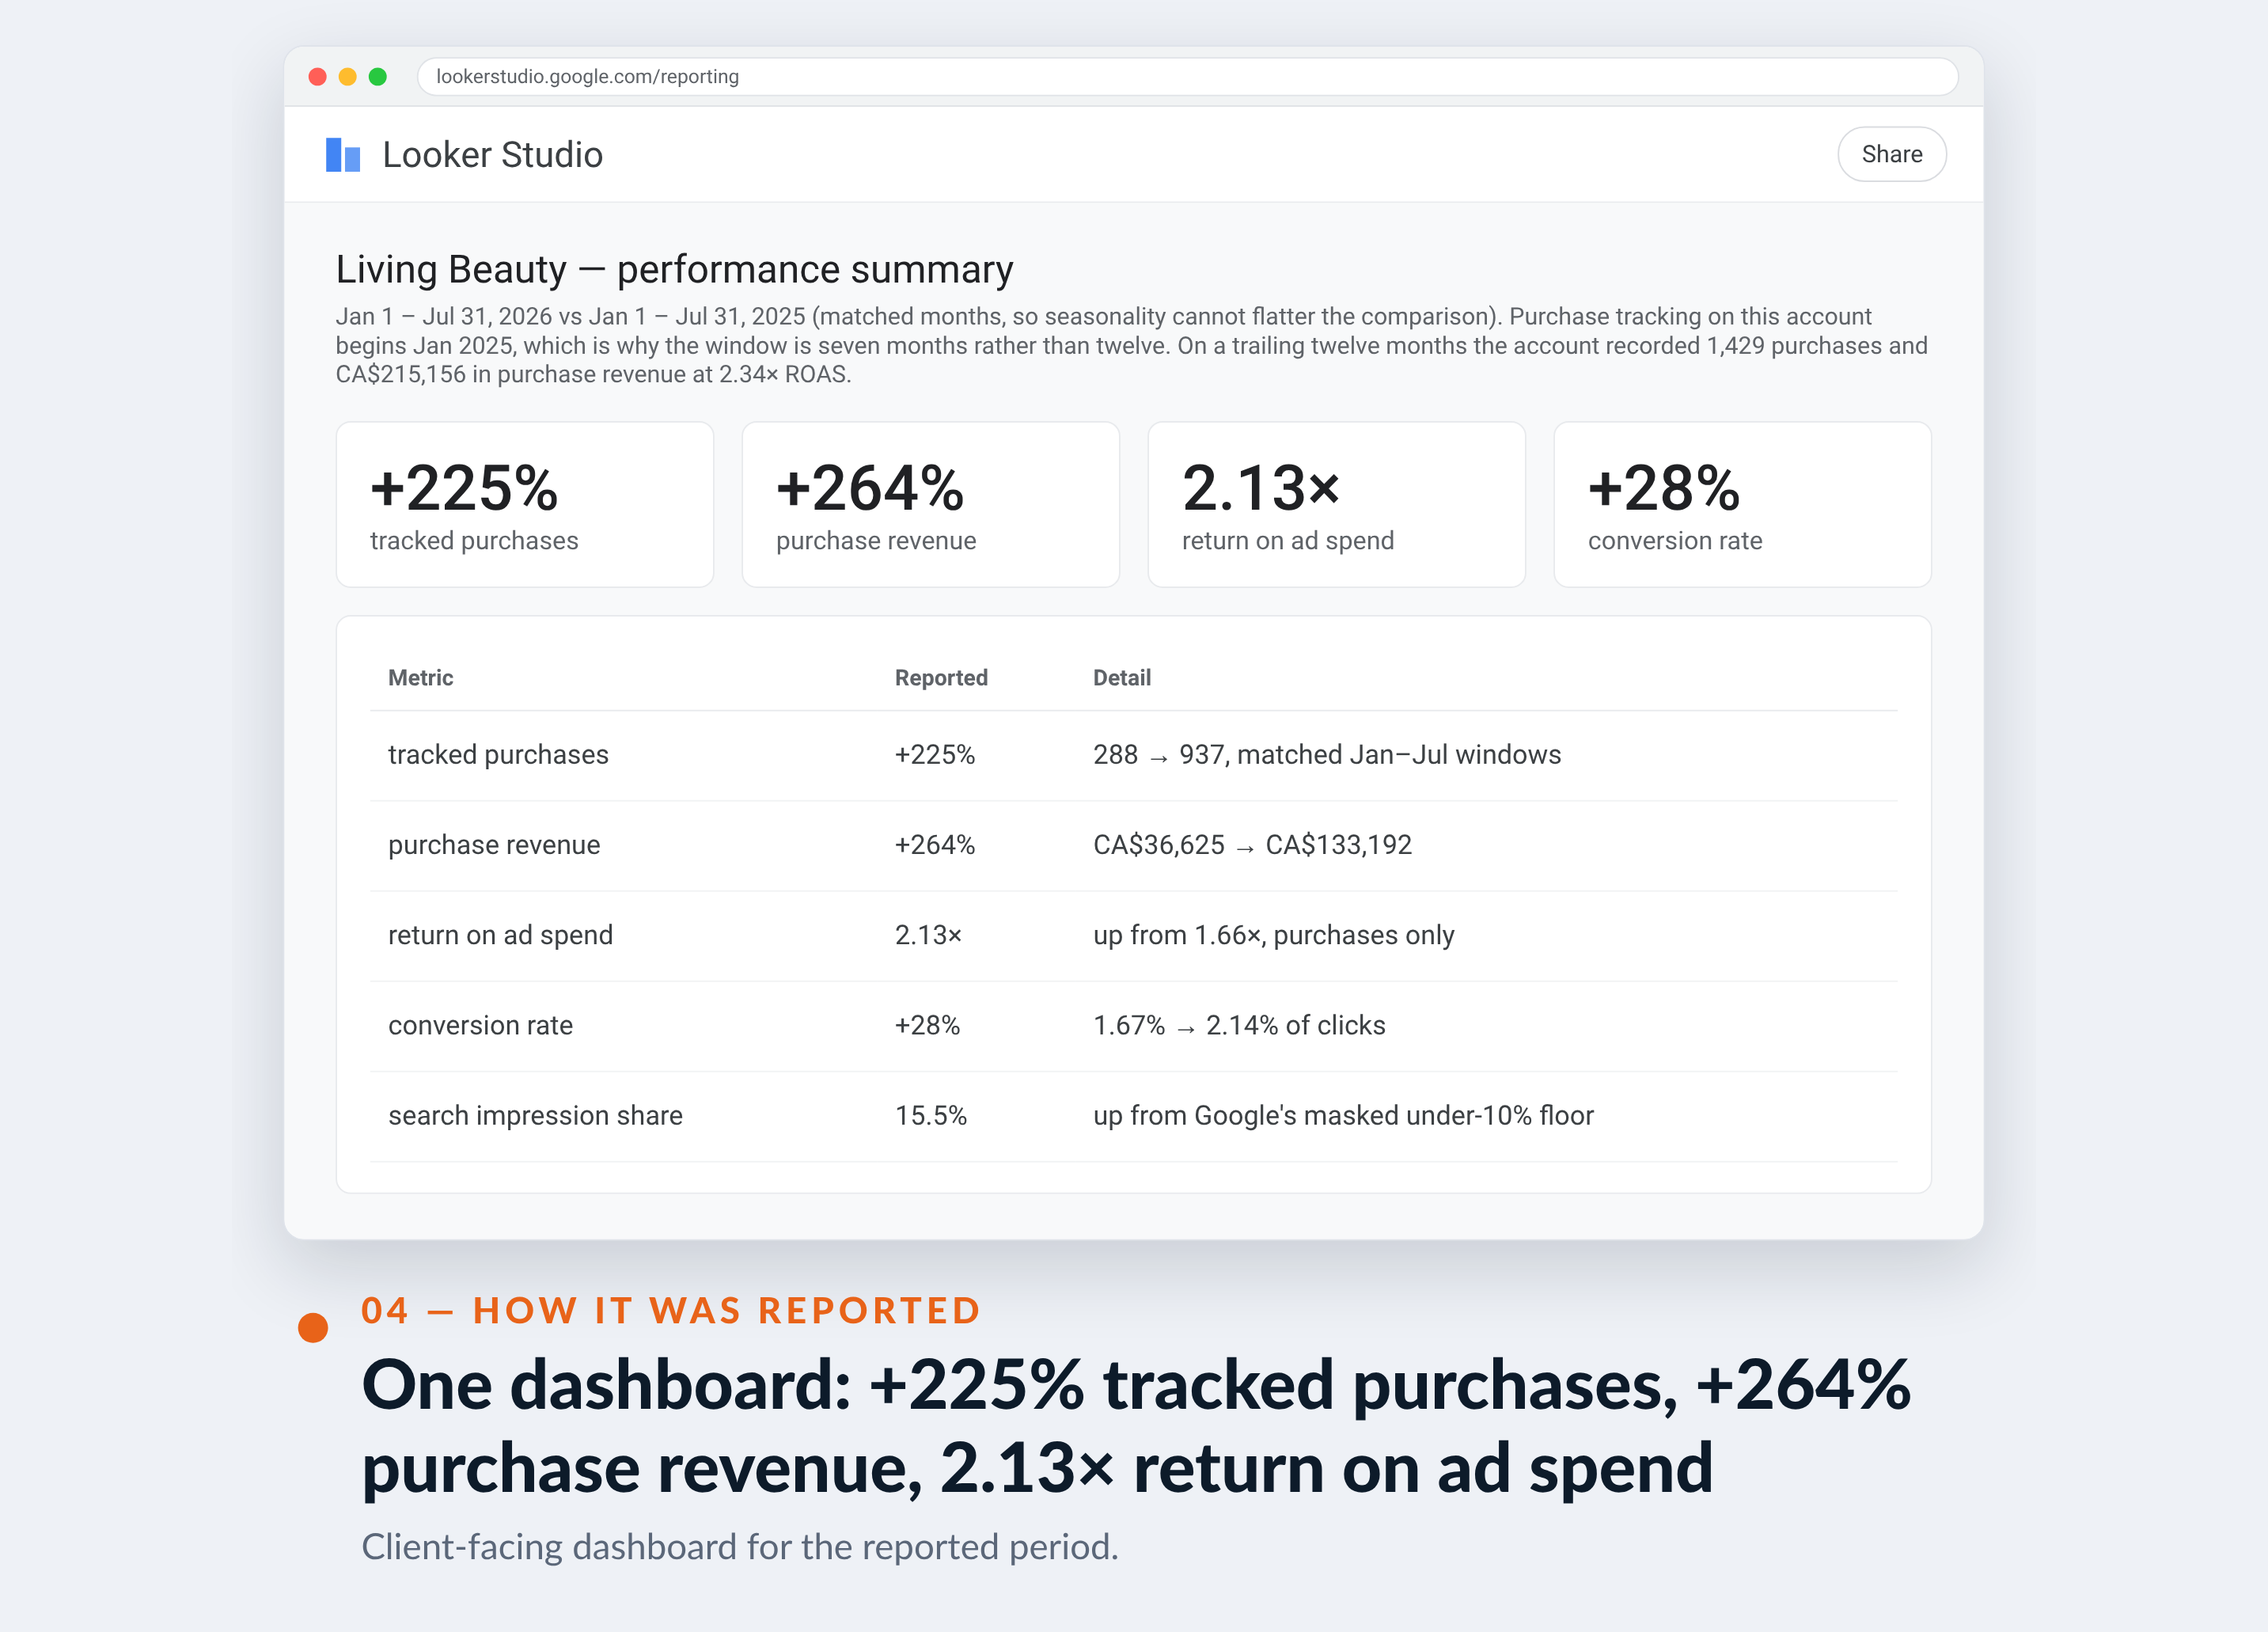
+225%
tracked purchases
288 → 937, matched Jan–Jul windows
+264%
purchase revenue
CA$36,625 → CA$133,192
2.13×
return on ad spend
up from 1.66×, purchases only
+28%
conversion rate
1.67% → 2.14% of clicks
15.5%
search impression share
up from Google's masked under-10% floor

01 — The challenge
A small account with a discovery problem, not a demand problem.
Living Beauty had product-market fit, repeat customers and a catalogue of premium skincare and makeup brands. What it did not have was reach. The Google Ads account was spending around CA$3,000 a month, capturing under 10% of the impressions available to it, and generating roughly 40 tracked purchases a month.
In beauty, the searches that convert are specific — a brand, a shade, a size. An account that thin simply is not eligible for most of them.
“For years I assumed we were invisible because our brands weren’t famous enough. It turned out we were invisible because Google couldn’t properly read our own catalogue. Fixing that was far less glamorous than launching a new campaign, and it did considerably more.”
It is the most common misdiagnosis in small e-commerce accounts: a demand problem is assumed, an eligibility problem is the reality. More budget applied to a catalogue that cannot match specific searches simply buys more of the wrong traffic.
02 — Our approach
Earn eligibility first. Then buy more of what already works.
The constraint was eligibility, not bidding. Before spending more, the catalogue had to be able to match the specific searches beauty buyers actually type. So the first work was on the feed: titles, attributes and coverage rebuilt so individual products could compete on brand-and-variant queries instead of only broad category terms. Search impression share moved from Google's masked "under 10%" floor to a measured 15.5% average, peaking near 20%.
Second, the catalogue was tiered rather than treated as one undifferentiated feed. Products were grouped by their own demonstrated performance so budget concentrated behind proven sellers, and the long tail stopped quietly subsidising itself.
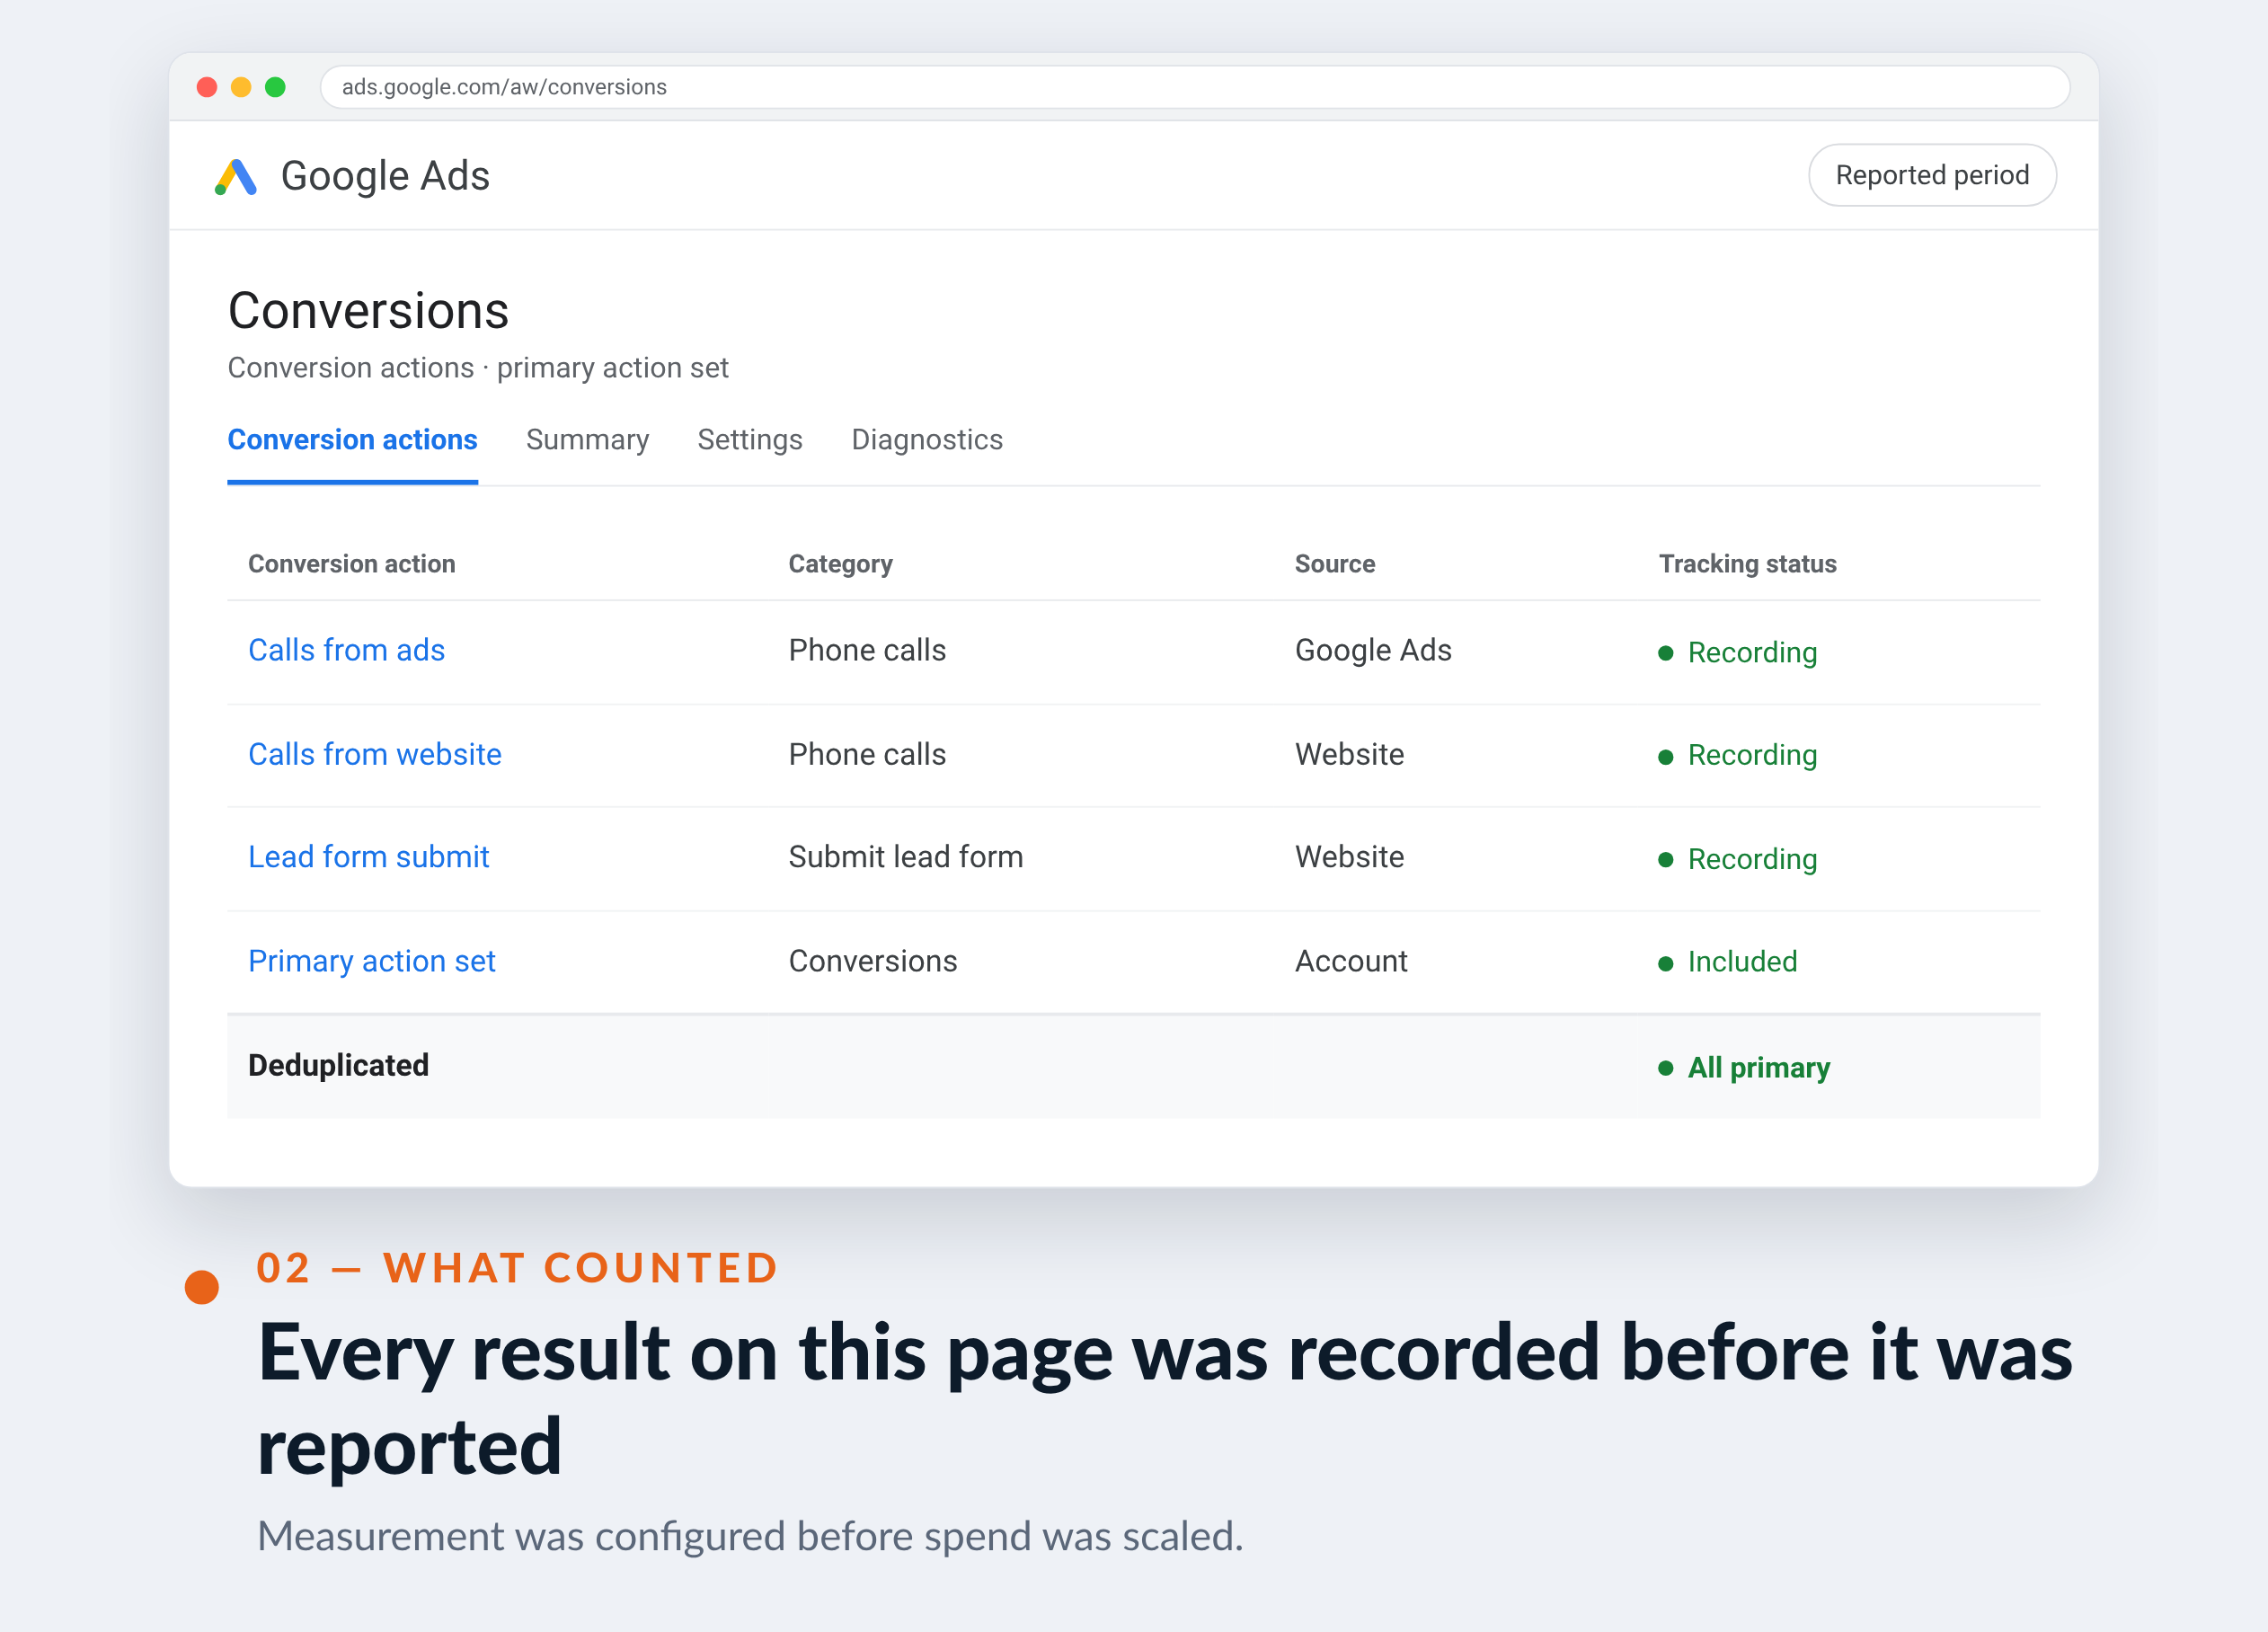
Third — and this is the part most accounts skip — reporting covered purchases only. This account also fires add-to-cart and begin-checkout as valued conversions, which inflates apparent revenue roughly threefold. Every number on this page excludes them. Optimising against a flattered signal is how accounts grow spend without growing a business.
Then budget followed evidence: expansion only into the segments already proving out, month by month, rather than a step change the account could not absorb.
03 — What we did
Feed, structure, honest measurement, then scale.
Unglamorous in that order — and the order is why efficiency improved during the scale-up instead of decaying.
Product feed
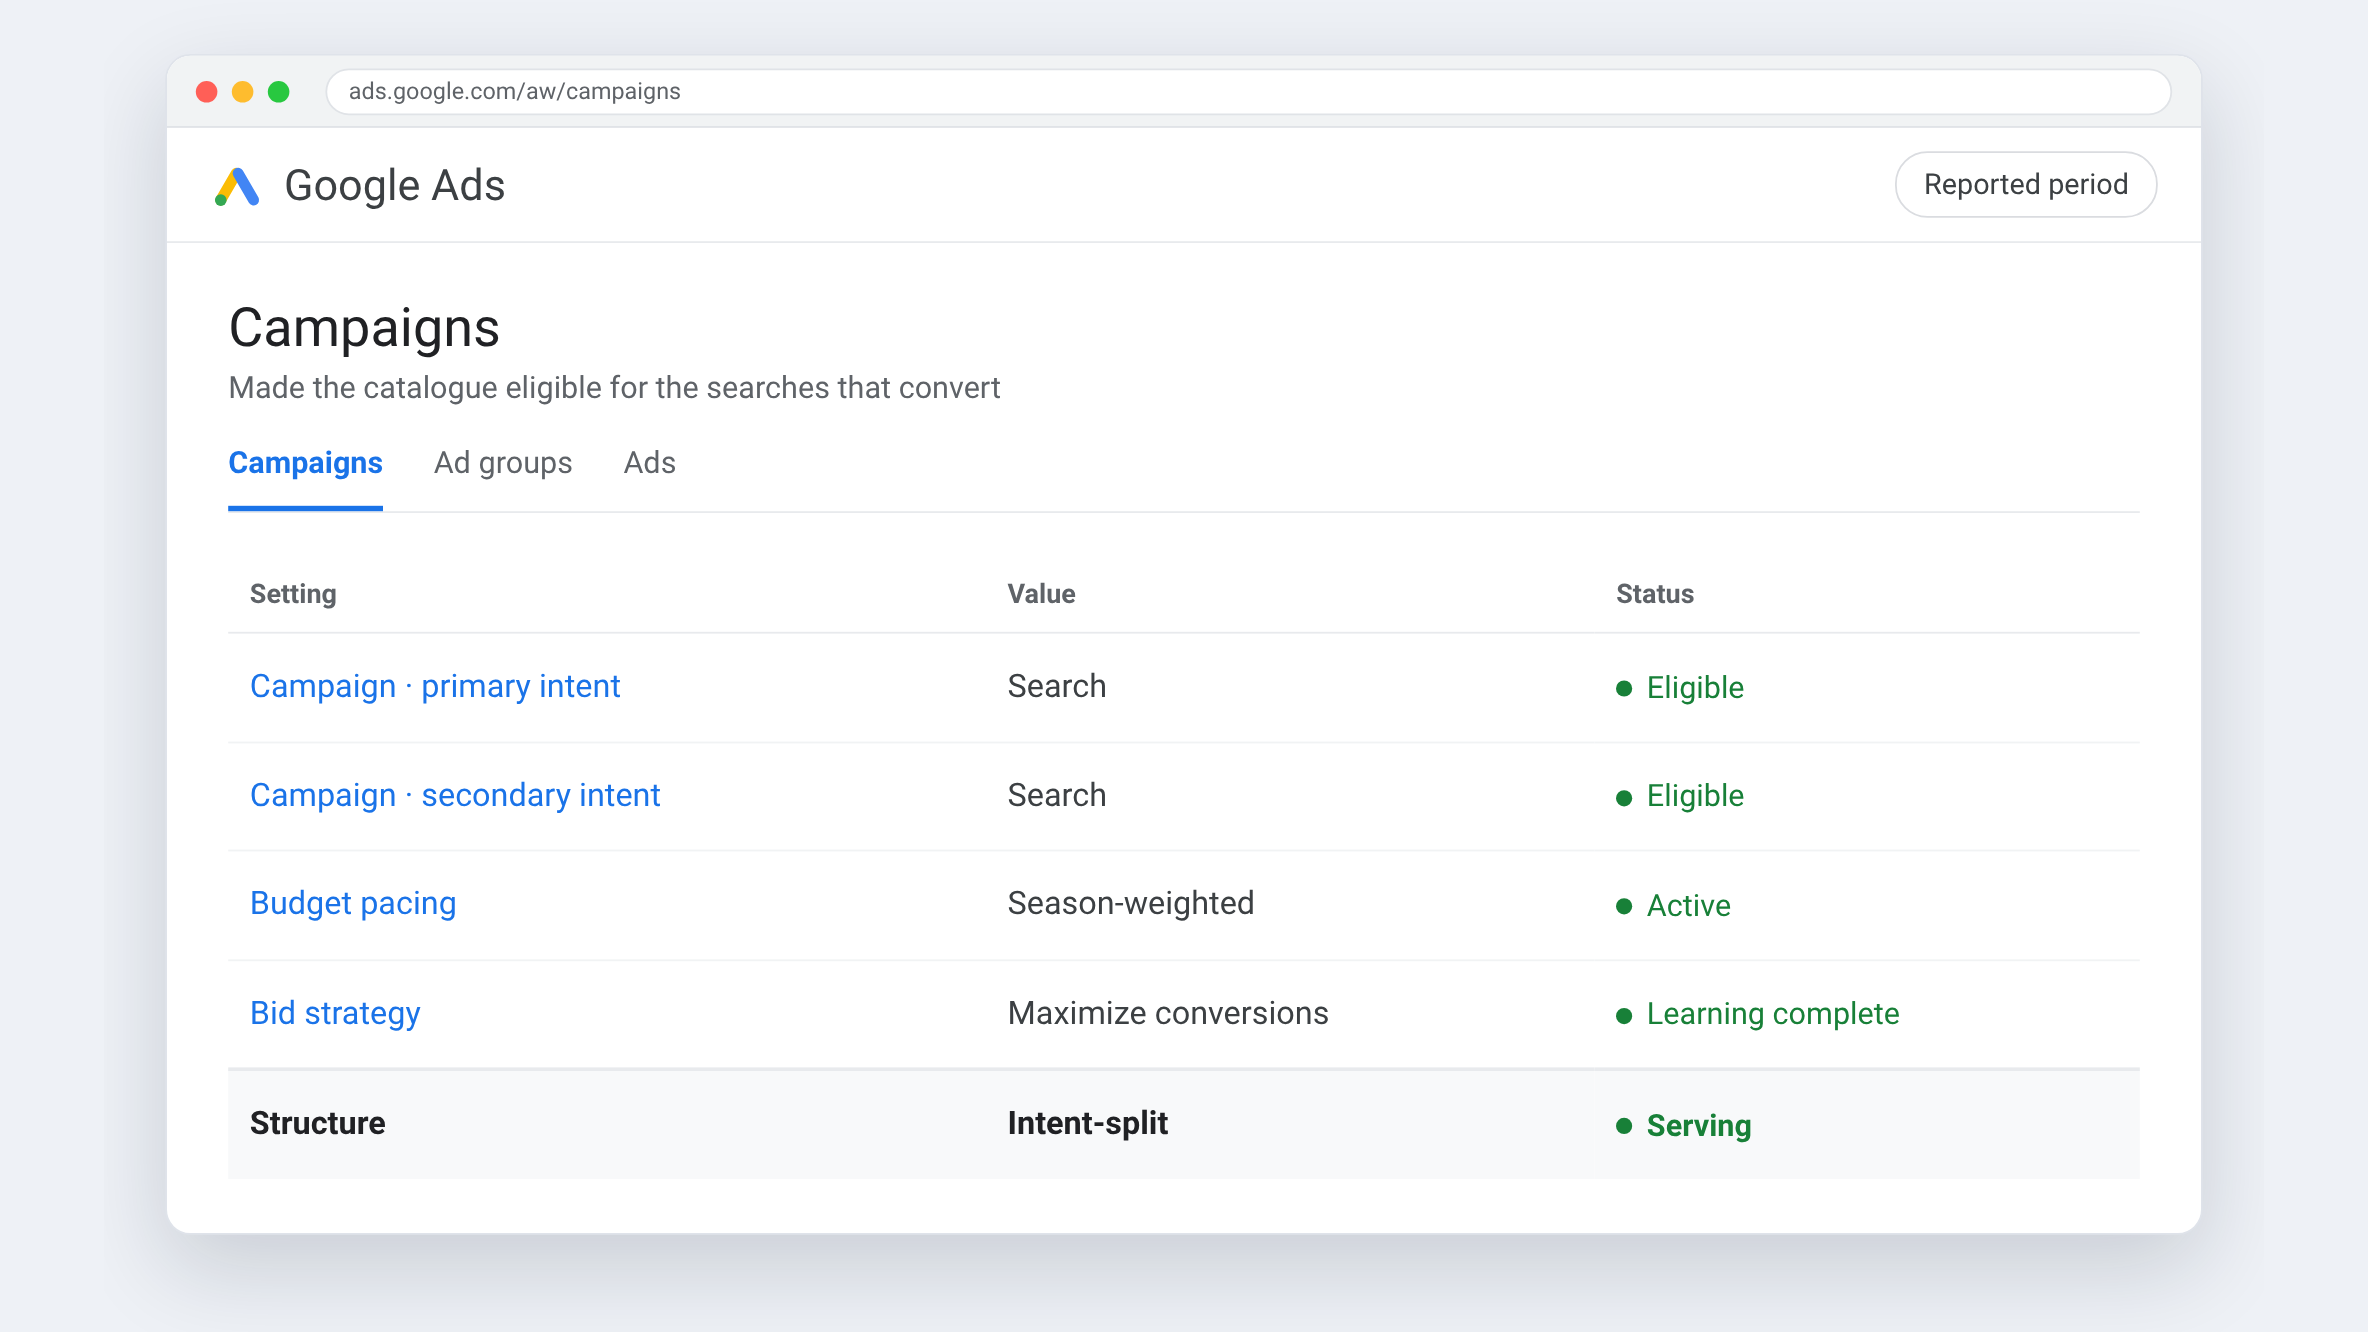
Made the catalogue eligible for the searches that convert
Titles, attributes and coverage were rebuilt so individual products could match brand-and-variant queries, not just broad category terms. Impression share moved off Google's masked under-10% floor to a measured 15.5% average.
Shopping structure
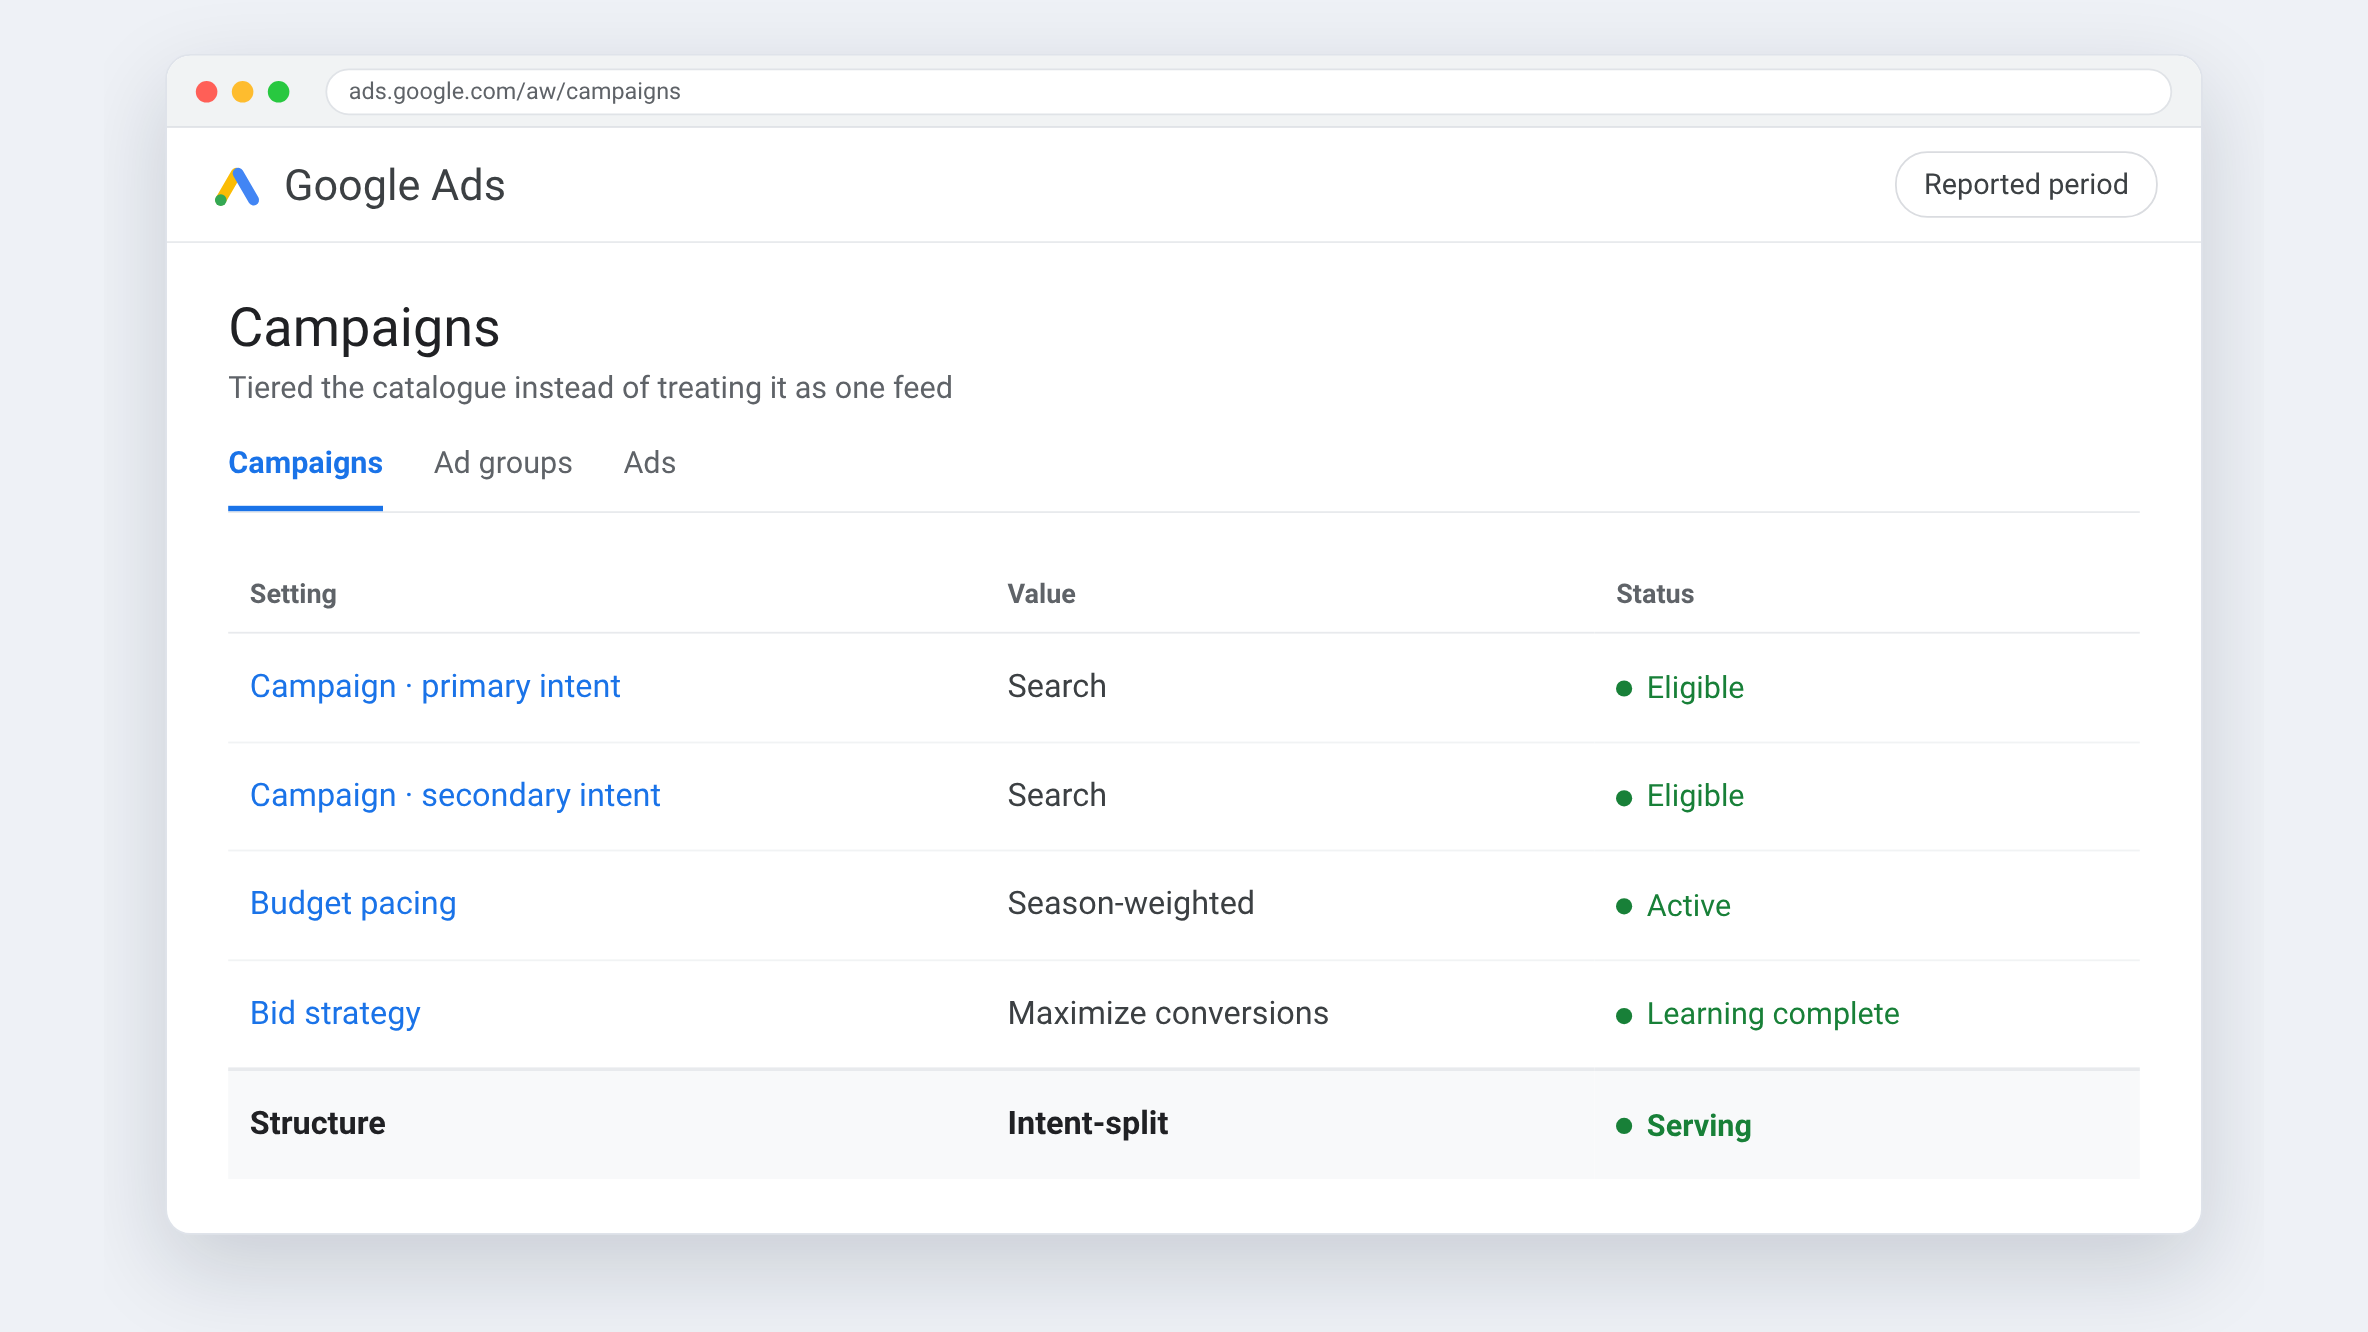
Tiered the catalogue instead of treating it as one feed
Products were grouped by demonstrated performance so budget concentrated behind proven sellers and the long tail stopped subsidising itself.
Honest measurement
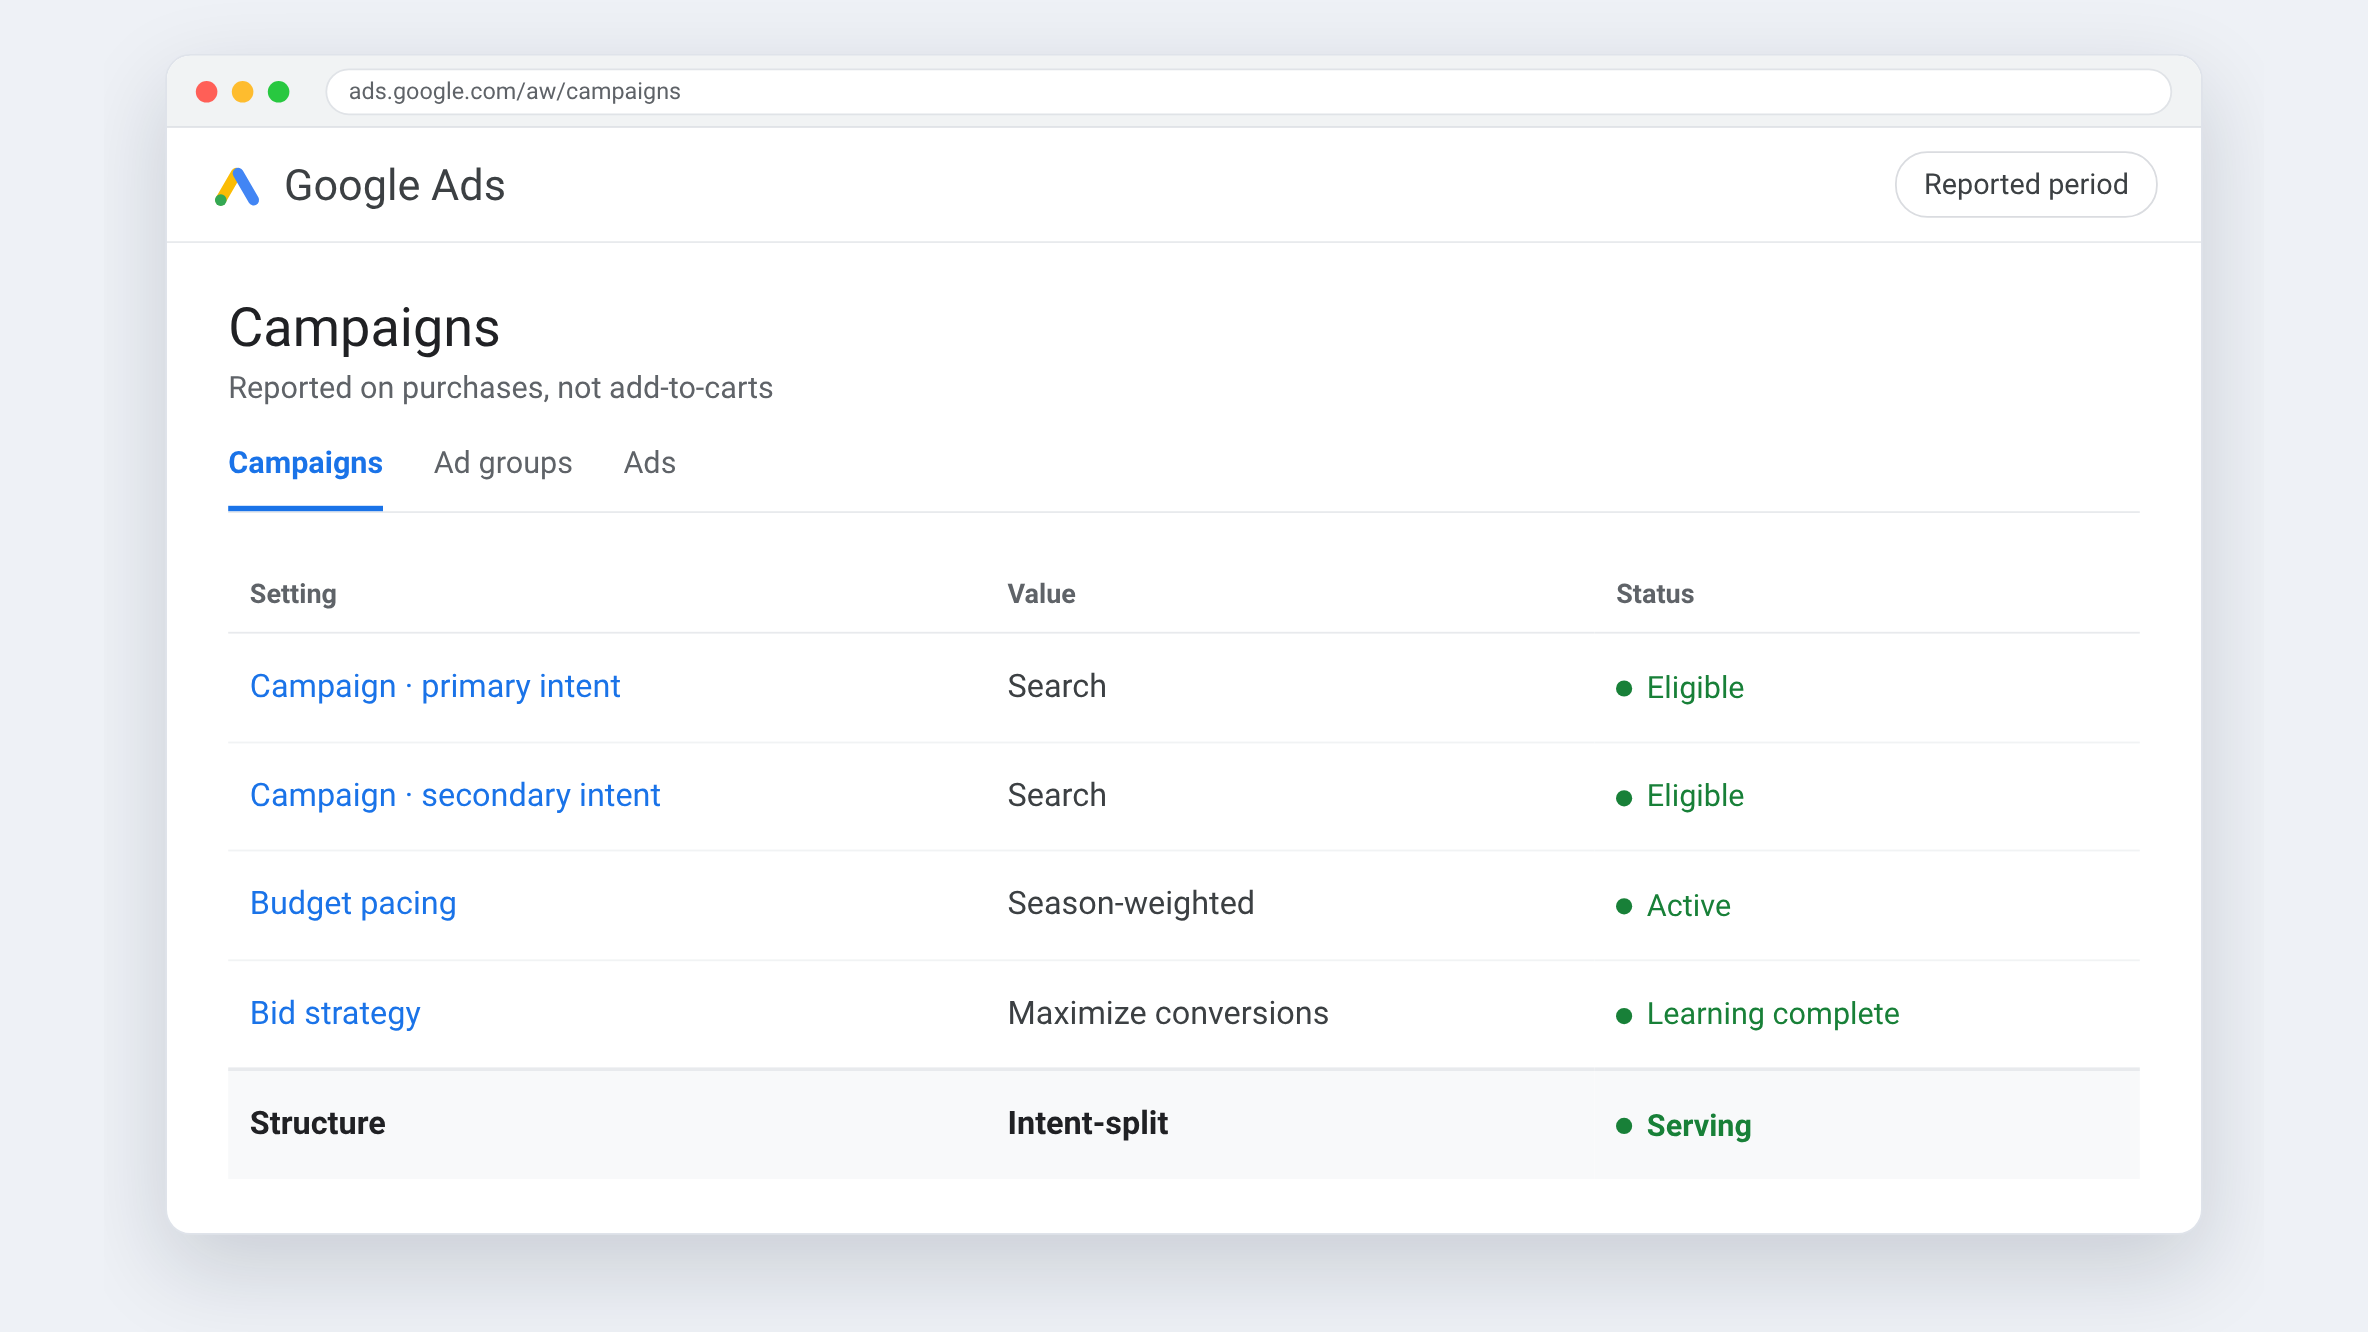
Reported on purchases, not add-to-carts
This account fires add-to-cart and begin-checkout as valued conversions, which inflates apparent revenue about threefold. Every figure here excludes them — because optimising against a flattered signal grows spend, not a business.
Controlled scaling
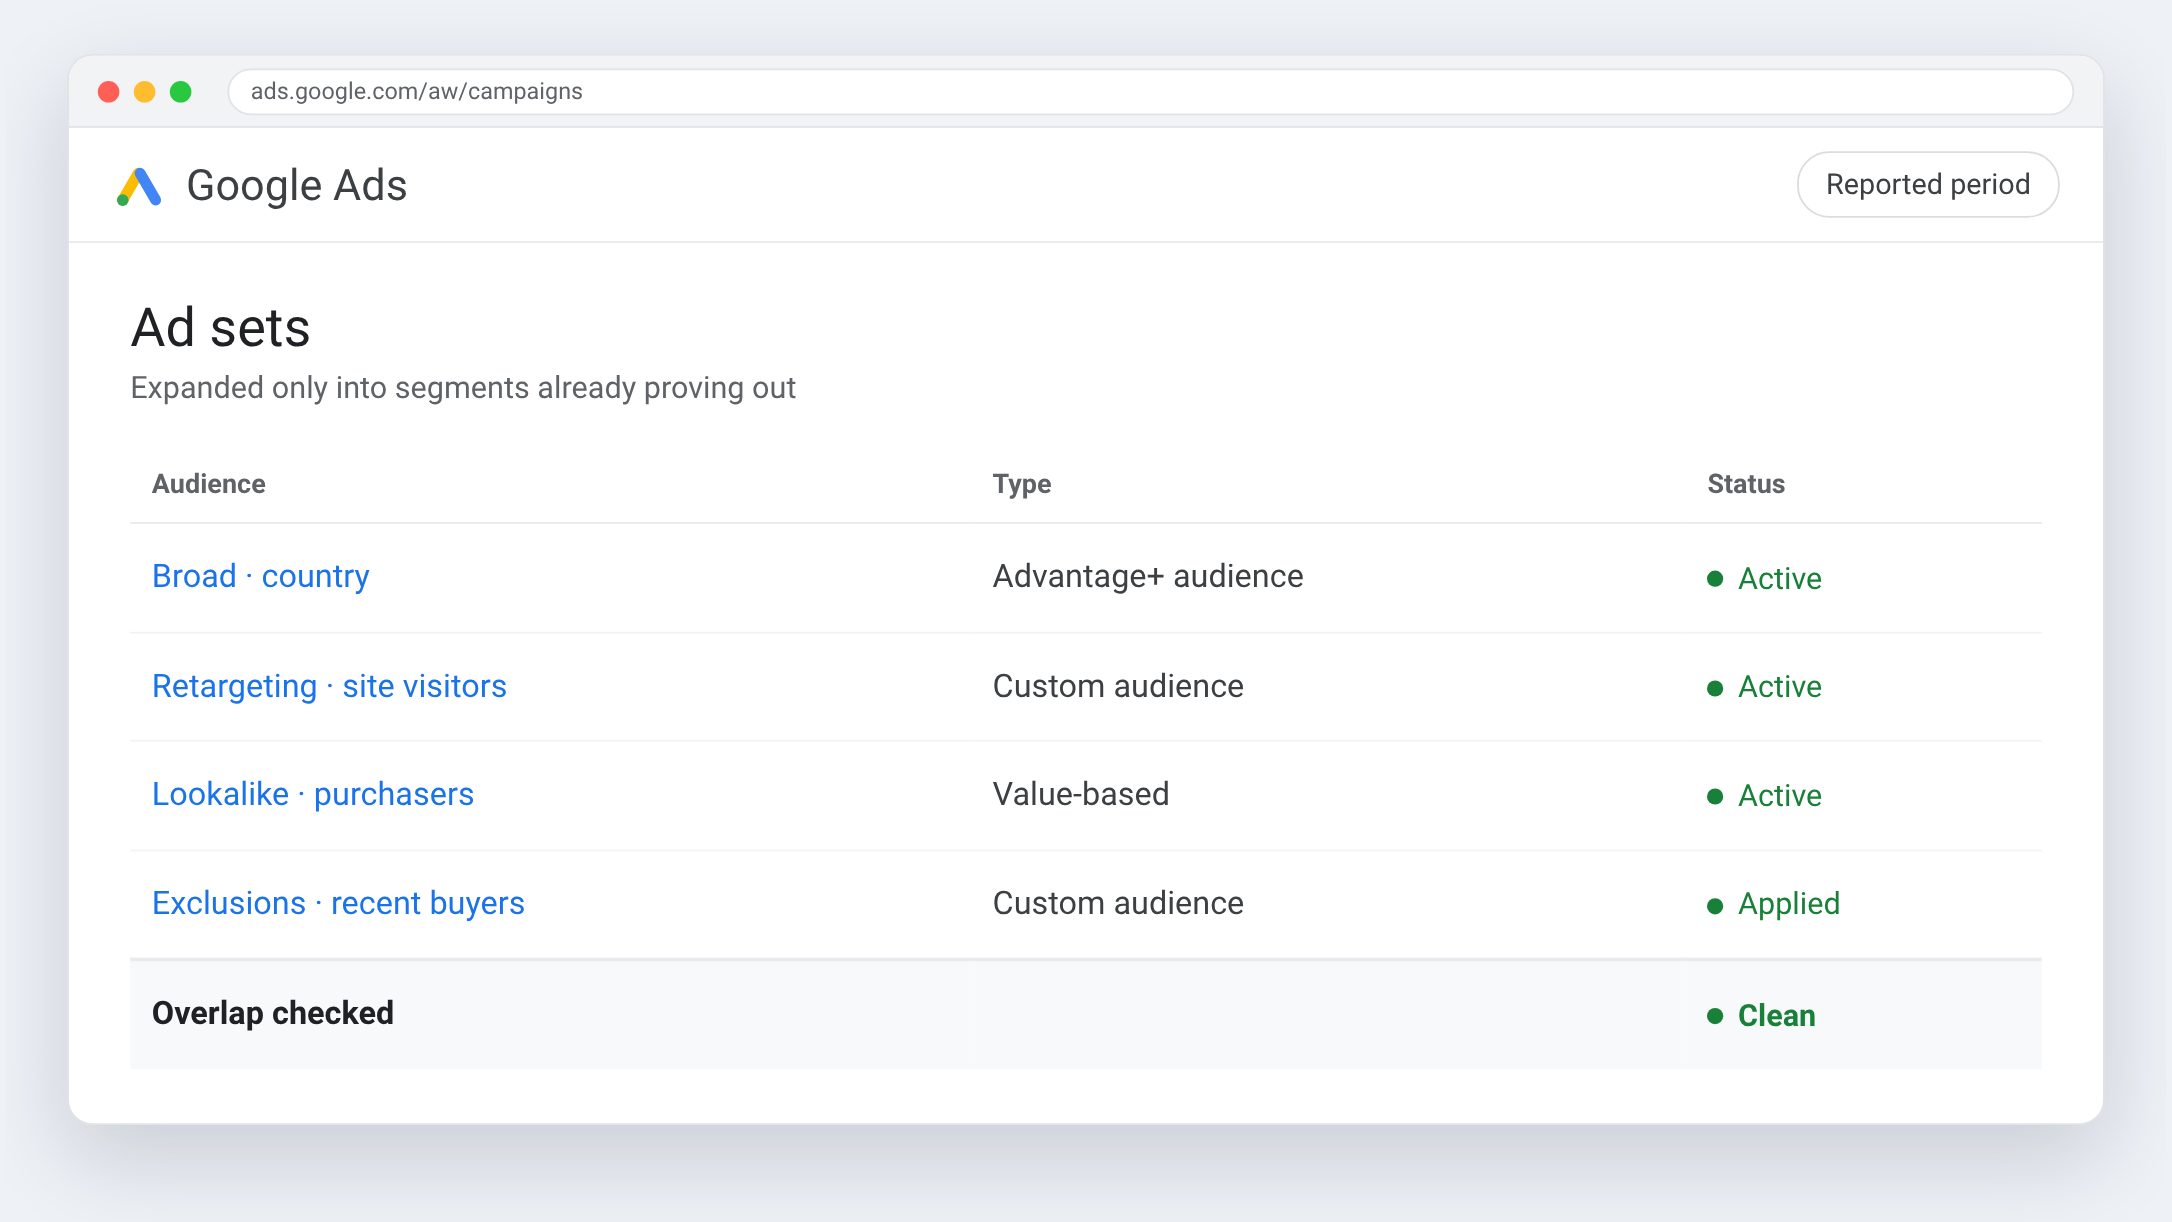
Expanded only into segments already proving out
Spend rose 183% across the matched windows while revenue rose 264%. Budget followed evidence month by month rather than a step change the account could not absorb.

04 — The results
The same seven months, one year apart.
The stack we ran it on

Google Ads
Paid search

Google Merchant Center
Product feed

GA4
Analytics

Google Search Console
Organic

Shopify
E-commerce

Semrush
Keyword research

AgencyAnalytics
Reporting

Looker Studio
Dashboards














































Farrukh Ahmed CPA — Local SEO launch
position 50 → 17 · +166% desktop map impressions




Food Allergy Institute — Paid media and booked consultations
243 → 1,012 consultations/mo · cost per landing page view −30%




















































National Consumer Panel — UGC-driven acquisition & paid media
CPI −30% · CPA −20%


National Debt Relief — UGC, performance creative & influencer strategy
CVR +25% · CAC −30%






New Balance — Casting, post-production & influencer marketing
7 athletes · 750k audience










































"Their transparency, attention to detail, and collaborative approach made them feel like an extension of our own team."


.webp)
.webp)


