



The report you actually open on Monday.
actually open
We are the marketing dashboard agency for teams tired of rebuilding the same spreadsheet every month. We connect the ad platforms, the site and the CRM, agree what each metric means, and build a small set of views that end in a decision — so paid search, paid social and organic results are read the same way by everyone in the room. Built on your own analytics stack, documented, and yours to keep.






Tell us a little about your brand and we'll be in touch within 24 hours to lock in a time.



THE FOUR LAYERS
A dashboard is the last step, not the first.
the last step
Pipelines, definitions, design, then adoption. Most reporting projects start at the chart and fail underneath it, so we work in the other order and refuse to visualise numbers we have not reconciled against your sales or billing system.
Data pipelines
Metric definitions
Design & structure
Adoption & alerting
One reliable feed per source, on a schedule.
The reason reporting eats a week is rarely design. It is a person exporting CSVs. NinjaCat's 2026 maturity research found 72% of marketing teams still call their reporting process highly manual, with an average turnaround of five days — five days in which the campaign has already moved on.
So we start with plumbing. Every ad platform, the site, the CRM, call tracking, email and any offline source is connected through an API rather than an export, with currency, time zone and channel naming normalised on the way in. Cost, impressions, clicks and conversions land in one place, refreshed on a schedule you can rely on, with backfill handled so historical comparisons stay honest when a platform restates its own numbers.
Where a warehouse is warranted we use BigQuery or Snowflake with a modest transformation layer; where it is not, a well-built connector setup and Looker Studio is enough. We recommend the cheaper option whenever it holds, and say so plainly.
- API connections to every ad platform, the site and the CRM
- Currency, time zone and channel naming normalised on ingest
- Scheduled refresh with backfill when platforms restate data
- Warehouse only where the joins justify it
72%
of marketing teams call their reporting highly manual
5 days
average reporting turnaround on manual processes
One agreed meaning per number.
Most disagreements about a dashboard are disagreements about vocabulary. Marketing counts a lead at form submission, sales counts it at qualification, finance counts revenue at invoice, and three charts disagree by design. Before we build anything we write a short metric dictionary: what a lead is, when a customer counts, how revenue and refunds are treated, which attribution view each figure uses, what is excluded and why.
It gets signed off by marketing, sales and finance. That hour of disagreement up front is what prevents a quarter of quiet distrust later, and it is the part most reporting projects skip. Every metric on the finished dashboard carries a definition you can hover, so a new hire can read the page without a translator.
When a definition changes we version it, so the step in the chart has an explanation attached instead of triggering a week of forensics.
- Written definition per metric, signed off across teams
- Refunds, cancellations and offline revenue handled explicitly
- Definitions visible on the dashboard itself
- Changes versioned and dated
1
agreed definition per metric, written down before build
Few views, each aimed at one decision.
We build three layers and stop. An executive view showing contribution and efficiency against plan. A channel view the marketing team works from weekly. A diagnostic layer for whoever is chasing a cause. Each page answers a question someone actually asks, and anything that answers no question is cut — every extra chart is a maintenance liability and a distraction.
Design decisions follow the same logic. Comparisons against the previous period and against plan, absolute change alongside percentages, annotations on the events that explain a spike, and a stated data-freshness stamp so nobody argues with a chart that has not refreshed. Load speed matters too: the discipline that showed a 0.1-second mobile improvement lifting retail conversion rates 8.4% in Deloitte and Google's study applies to internal tools as well — a report that takes 40 seconds to load is a report nobody consults in a meeting.
Speed comes from pre-aggregating in the warehouse rather than making the visualisation layer do arithmetic across five live sources.
- Executive, channel and diagnostic layers, deliberately few
- Period-over-period and against-plan comparisons as standard
- Annotations for launches, outages and budget changes
- Pre-aggregated tables so pages load in seconds
3
layers: executive, channel, diagnostic
A report nobody uses is a cost.
This is where reporting projects quietly die. BARC's survey of 1,000 business intelligence users found the benefits are real — 97% report faster reporting or planning and 94% better decisions — and yet in the same research only 25% of employees actually use the tools. IBM puts active use at around 29% of employees, barely moved in seven years.
So we treat adoption as part of the build. Every view has a named owner and a moment it is used — the Monday stand-up, the monthly review, the budget meeting. We run the first few of those meetings from the dashboard ourselves, record short walkthroughs, and prune whatever nobody opened after a month. Alerting covers the things that break silently: a tag removed on deploy, spend running without conversions, a feed that stopped, pacing drifting off plan.
Then a written monthly review says what moved, what we changed and what we recommend, which is the habit that turns a dashboard into a decision rather than a wallpaper.
- Named owner and a standing meeting for every view
- Walkthroughs recorded and documentation handed over
- Alerting on broken tags, dead spend and pacing drift
- Monthly written review ending in recommendations
- Unused views pruned rather than maintained
97%
of BI users report faster reporting and planning
25%
of employees actually use the tools on average
of performance software spend is reporting (Mordor)
marketing dashboard software market in 2026 (GII)
core views: executive, channel, diagnostic
Accounts, warehouse, reports and documentation
We made the difference for those brands

Retail & commerce

B2B software, fintech, insurance

Food & beverage

Consumer tech and platforms

Consumer tech and platforms

B2B software, fintech, insurance

Consumer tech and platforms
Retail & commerce

Food & beverage
Creative, content, arts & culture

Apparel and lifestyle

Food & beverage

Home essentials, appliances, kitchen & pet

Home essentials, appliances, kitchen & pet

Creative, content, arts & culture

B2B software, fintech, insurance

B2B software, fintech, insurance

Retail & commerce

B2B software, fintech, insurance

Beauty, personal care & wellness

Home essentials, appliances, kitchen & pet

Healthcare & regulated services

Consumer tech and platforms

Healthcare & regulated services

Apparel and lifestyle

Beauty, personal care & wellness

Food & beverage

Home essentials, appliances, kitchen & pet

B2B software, fintech, insurance

Healthcare & regulated services

Beauty, personal care & wellness

Consumer tech and platforms
01 — The challenge
Five days to build it, five minutes before someone doubts it.
Someone on the team spends the first week of every month pulling exports, pasting them into a workbook, fixing the channel names and reconciling totals that refuse to agree. By the time the deck is ready the month it describes is over, and the first question in the meeting is whether the numbers are right rather than what to do about them.
“We do not have a reporting problem. We have twelve reports and no answer.”
It is the normal state of the discipline, not a local failure: 72% of marketing teams describe their reporting as highly manual, turning it around in five days on average (NinjaCat, 2026). The fix is not a prettier chart. It is automated pipelines, definitions everyone signed off, and a small number of views built for the decisions your team actually makes — which is exactly what we build, in your own accounts, documented as we go.
02 — Our approach
Automate the pipes. Agree the words. Then design.
We start by connecting every source through an API instead of an export, normalising currency, time zone and channel naming on the way in, and reconciling the totals against your CRM or billing system so the foundation is trusted before anything is drawn. Then we write the metric dictionary with marketing, sales and finance in the room, because a shared definition is worth more than a clever visual. Design comes third and stays deliberately small: an executive view, a channel view, a diagnostic layer, each aimed at a decision someone actually makes, with comparisons against plan and annotations for the events that explain the spikes. Finally we build for adoption — named owners, standing meetings run from the dashboard, alerting on broken tracking and dead spend, and a monthly written review. You own the accounts, the warehouse, the reports and the documentation throughout.
03 — What we did
Four phases, one source of truth.
Connect, define, build, adopt — run in sequence over roughly six weeks, with a weekly working session and a written review of what the reporting changed.
Weeks 1-2 / Connect
Every source on an automated feed
Ad platforms, site, CRM, call tracking and email connected by API, with naming and currency normalised and totals reconciled against the sales system.

Week 2 / Define
A metric dictionary everyone signs
One written definition per metric, agreed by marketing, sales and finance, then published on the dashboard itself.

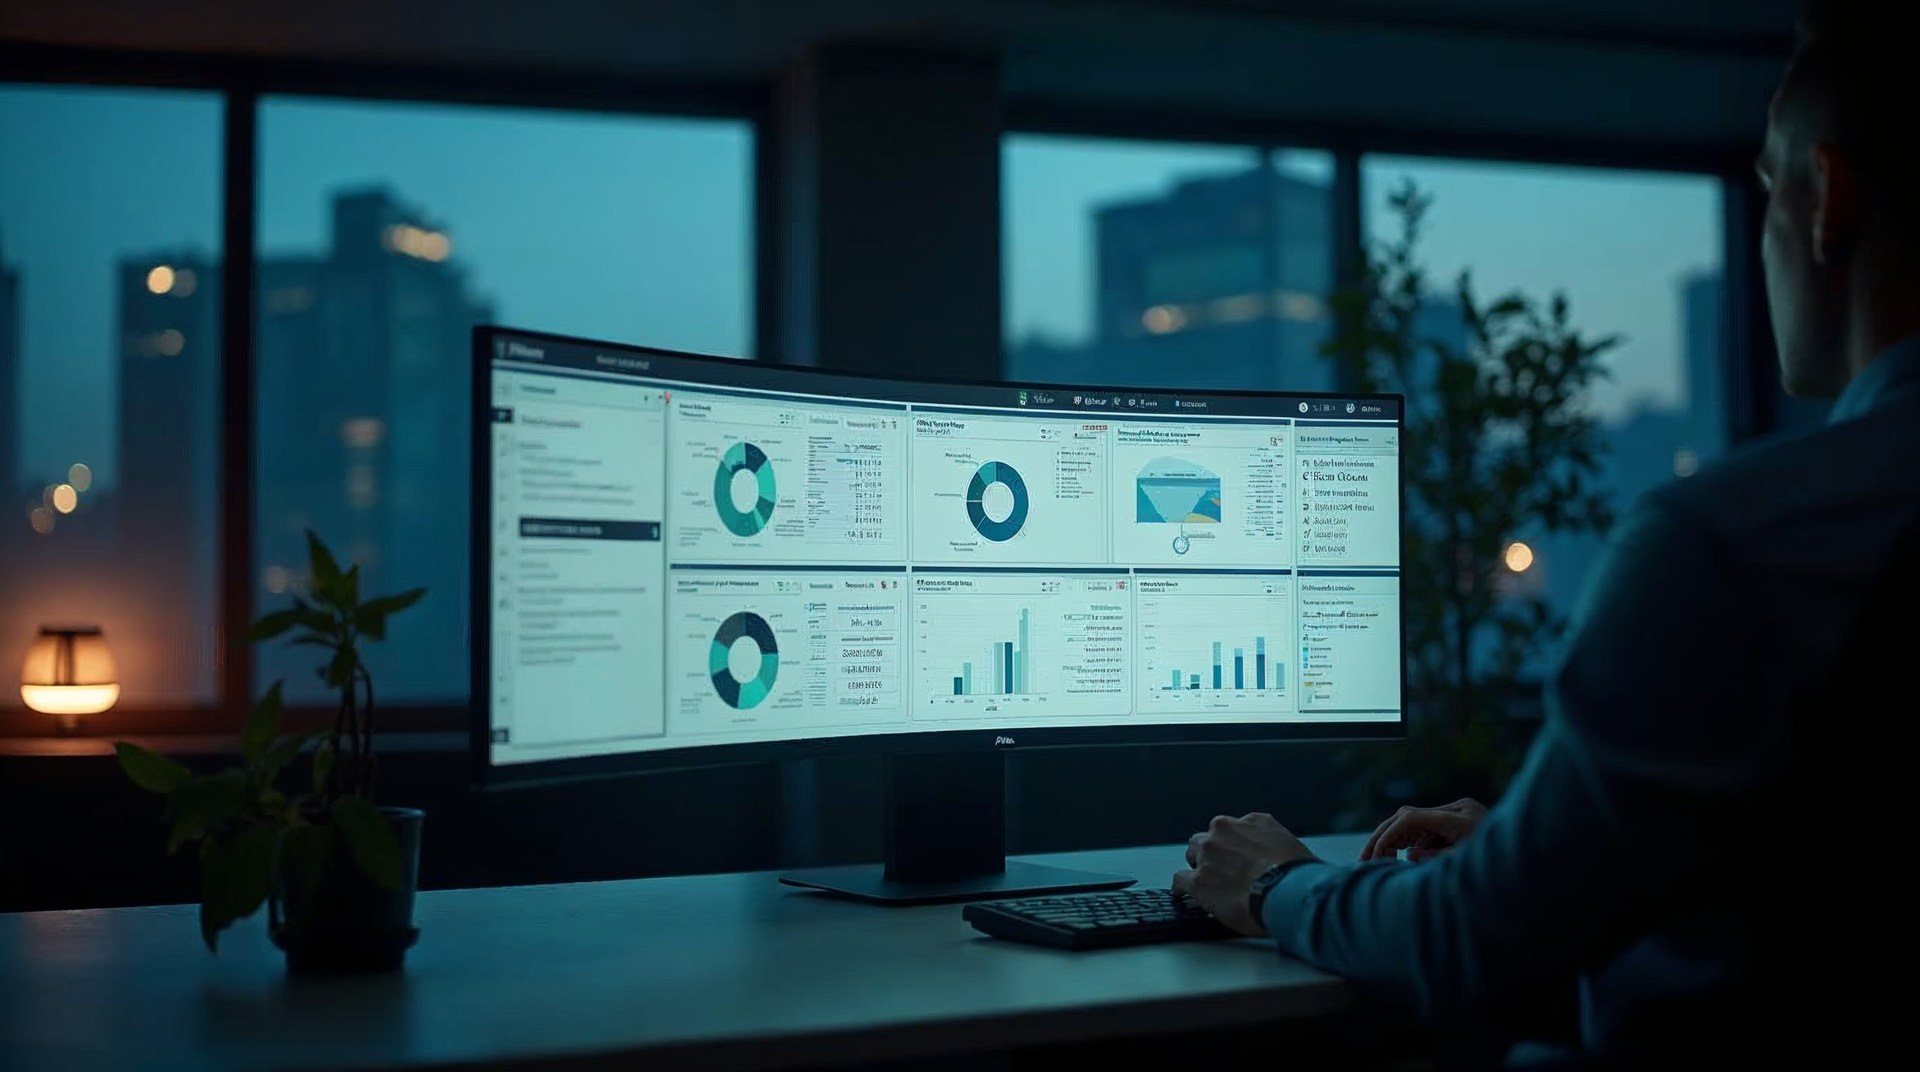
Weeks 3-5 / Build
Three views, each for a decision
Executive, channel and diagnostic layers with against-plan comparisons, annotations and pre-aggregated tables so pages load in seconds.
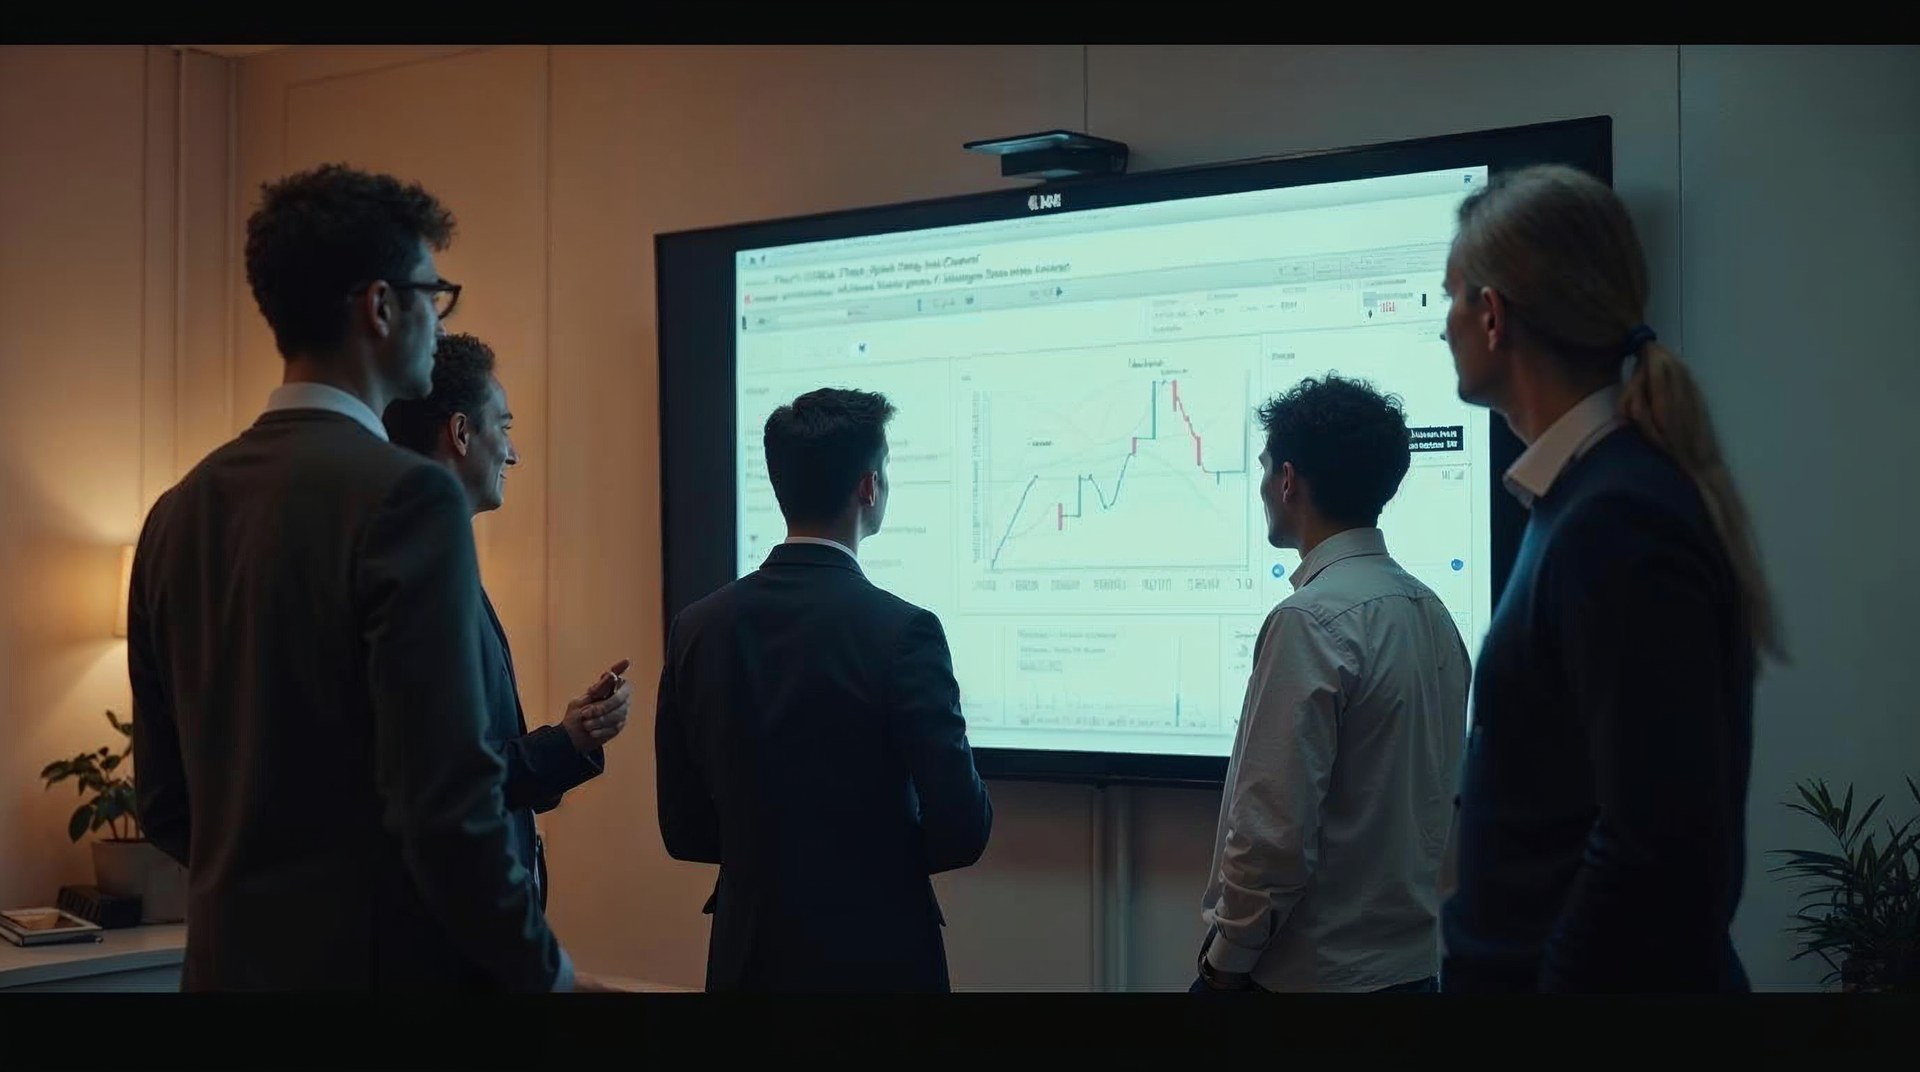
Week 6 onward / Adopt
Owners, alerts and a monthly review
Named owners, meetings run from the dashboard, alerting on broken tags and dead spend, and a written monthly review that ends in recommendations.
WHAT YOU GET
Reporting you own outright.
you own
Everything below is built in your own accounts and warehouse, documented as we go, and handed over in full.

Automated data pipelines
Every ad platform, the site, the CRM and offline sources connected by API, normalised and refreshed on a schedule you can trust.

Metric dictionary
One written definition per metric, signed off by marketing, sales and finance, then published on the dashboard for everyone to read.

Executive dashboard
Contribution, efficiency and pacing against plan on one page, in the language your board and finance team already use.

Channel and campaign views
The working report for the marketing team, with period comparisons, annotations and drill-down to campaign and creative level.

Alerting and monitoring
Automatic warnings for broken tracking, spend running without conversions, stalled feeds and pacing drifting away from plan.

Monthly written review
A short written read of what moved, what we changed and what we recommend next, delivered with the dashboard rather than instead of it.
HOW WE WORK
Operating standards, not promises.
Operating standards


















Built on trust. Proven by results.
We partner with SMBs and Fortune 500 companies to deliver more than reach — we bring clarity, execution, and measurable outcomes. Every successful partnership starts with a strong culture fit and a shared drive to grow.






CASE STUDIES
Case studies
Website Portfolio
Video Ads
Static Ads







































































FAQ
What teams ask us first.
What does a marketing dashboard agency actually deliver?
Four things, in order: automated feeds from every source, agreed definitions for every metric, a small set of views built for real decisions, and the habits that keep them in use. The visualisation is the least difficult part. What takes the work is making cost, behaviour and closed revenue agree well enough that a single chart can carry them. A good engagement leaves you with pipelines you do not maintain by hand, a written metric dictionary, three or four reports people open without being asked, and a monthly review that changes what you do next.
How is this different from the reports our ad platforms already give us?
Platform reports answer one question well: how did this platform perform, judged by its own attribution. They cannot tell you what the whole programme produced, because each platform counts conversions it believes it influenced, so the totals overlap. They also stop at the click and know nothing about what closed in your CRM. A dashboard built across sources gives you blended efficiency, contribution against plan and cost per outcome that finance recognises — while the platform views stay exactly where they are useful, for in-flight optimisation by whoever is running the campaigns.
Do we need a data warehouse, or is Looker Studio enough?
Often Looker Studio with well-built connectors is genuinely enough, and we will say so rather than sell a warehouse. You need one when reports are slow because the visualisation layer is doing arithmetic across five live sources, when you want more than a year of history, when refunds and cancellations materially change the picture, or when revenue truth lives in a billing or CRM system that has to be joined properly. In those cases BigQuery or Snowflake with a modest transformation layer is the cheaper answer, because reconciling exports by hand costs more every month than the warehouse does.
Why do so many dashboards end up unused, and how do you prevent it?
Because they are built as artefacts rather than habits. BARC's research with 1,000 business intelligence users found the benefits are real — 97% report faster reporting and 94% better decisions — while average employee use sits at 25%, and IBM measures active use at roughly 29% of employees. Our answer is structural: fewer views, each with a named owner and a standing meeting; the first few of those meetings run from the dashboard with us in the room; walkthroughs recorded for new joiners; and anything nobody opened after a month pruned rather than maintained. Reporting that is part of a routine survives; reporting that is a link in an email does not.
Can you report on offline conversions, calls and long sales cycles?
Yes, and for most B2B and service businesses that is the whole point. Call tracking, booked appointments, CRM stages, quotes, signed contracts and invoiced revenue can all be joined back to the campaign that started them, which lets you report cost per qualified opportunity instead of cost per form fill. Where the cycle runs for months we report a leading indicator and the closed number side by side, with the cohort dated to when the spend happened, so nobody has to wait a quarter to make a decision or misread a slow month as a bad one.
How often does the data refresh, and what happens when a platform changes?
Daily is standard, hourly where a decision depends on it, and every page carries a freshness stamp so nobody argues with a chart that has not updated. Platforms restate their own numbers and rename their own fields regularly, so the pipelines are built to backfill rather than overwrite, and we monitor for schema changes instead of discovering them in a meeting. When something does break, the alerting tells us before it tells you, and the fix is documented in the same place as the model.
Will this create extra work for our team?
Less, in our experience — the days spent every month pulling and reconciling exports are the first thing to disappear. We also build fewer reports than most clients expect, because three trusted views beat fifteen nobody checks, and each extra chart has to be maintained forever. What we do ask for is about an hour a week from someone who owns the numbers during the build, and their attendance at the first few meetings we run from the dashboard. That involvement is what makes the reporting stick after we hand it over.
Can you work alongside our in-house data or BI team?
Yes, and it is often the best split. We tend to own the marketing measurement layer — tags, events, platform APIs, marketing definitions — while your data team owns the warehouse and governance, with the transformation layer shared and reviewed like any other code. Everything we write is documented and version-controlled so it survives handover, and we keep the stack conventional rather than clever for exactly that reason. Where there is no in-house data capability, we run the layer and train whoever will inherit it.
What does it cost, and how is it priced?
The build is a fixed-scope project quoted up front after the reporting review, so you approve a number rather than an open-ended retainer: connections, metric dictionary, the core views, alerting, documentation and training. Ongoing support is a modest monthly fee scoped to the reviews, alert monitoring and changes you want, and it is optional — plenty of clients take the build, keep it running themselves, and come back when they add a channel. We never price reporting as a percentage of media spend; the two are unrelated.
Do you also run the campaigns you report on?
We can, and many clients prefer it because the loop closes faster when the team reading the numbers is the team changing the campaigns. Our paid search, paid social and SEO teams work from the same warehouse and the same definitions. It is equally fine to buy reporting alone while other agencies buy your media: we report on their performance straight, share the methodology with them, and let the numbers do the arguing.

.webp)
.webp)


