

L'Entrepôt de la Réno · Renovation & building materials · Paid search · 2026
How search became the second engine at L'Entrepôt de la Réno
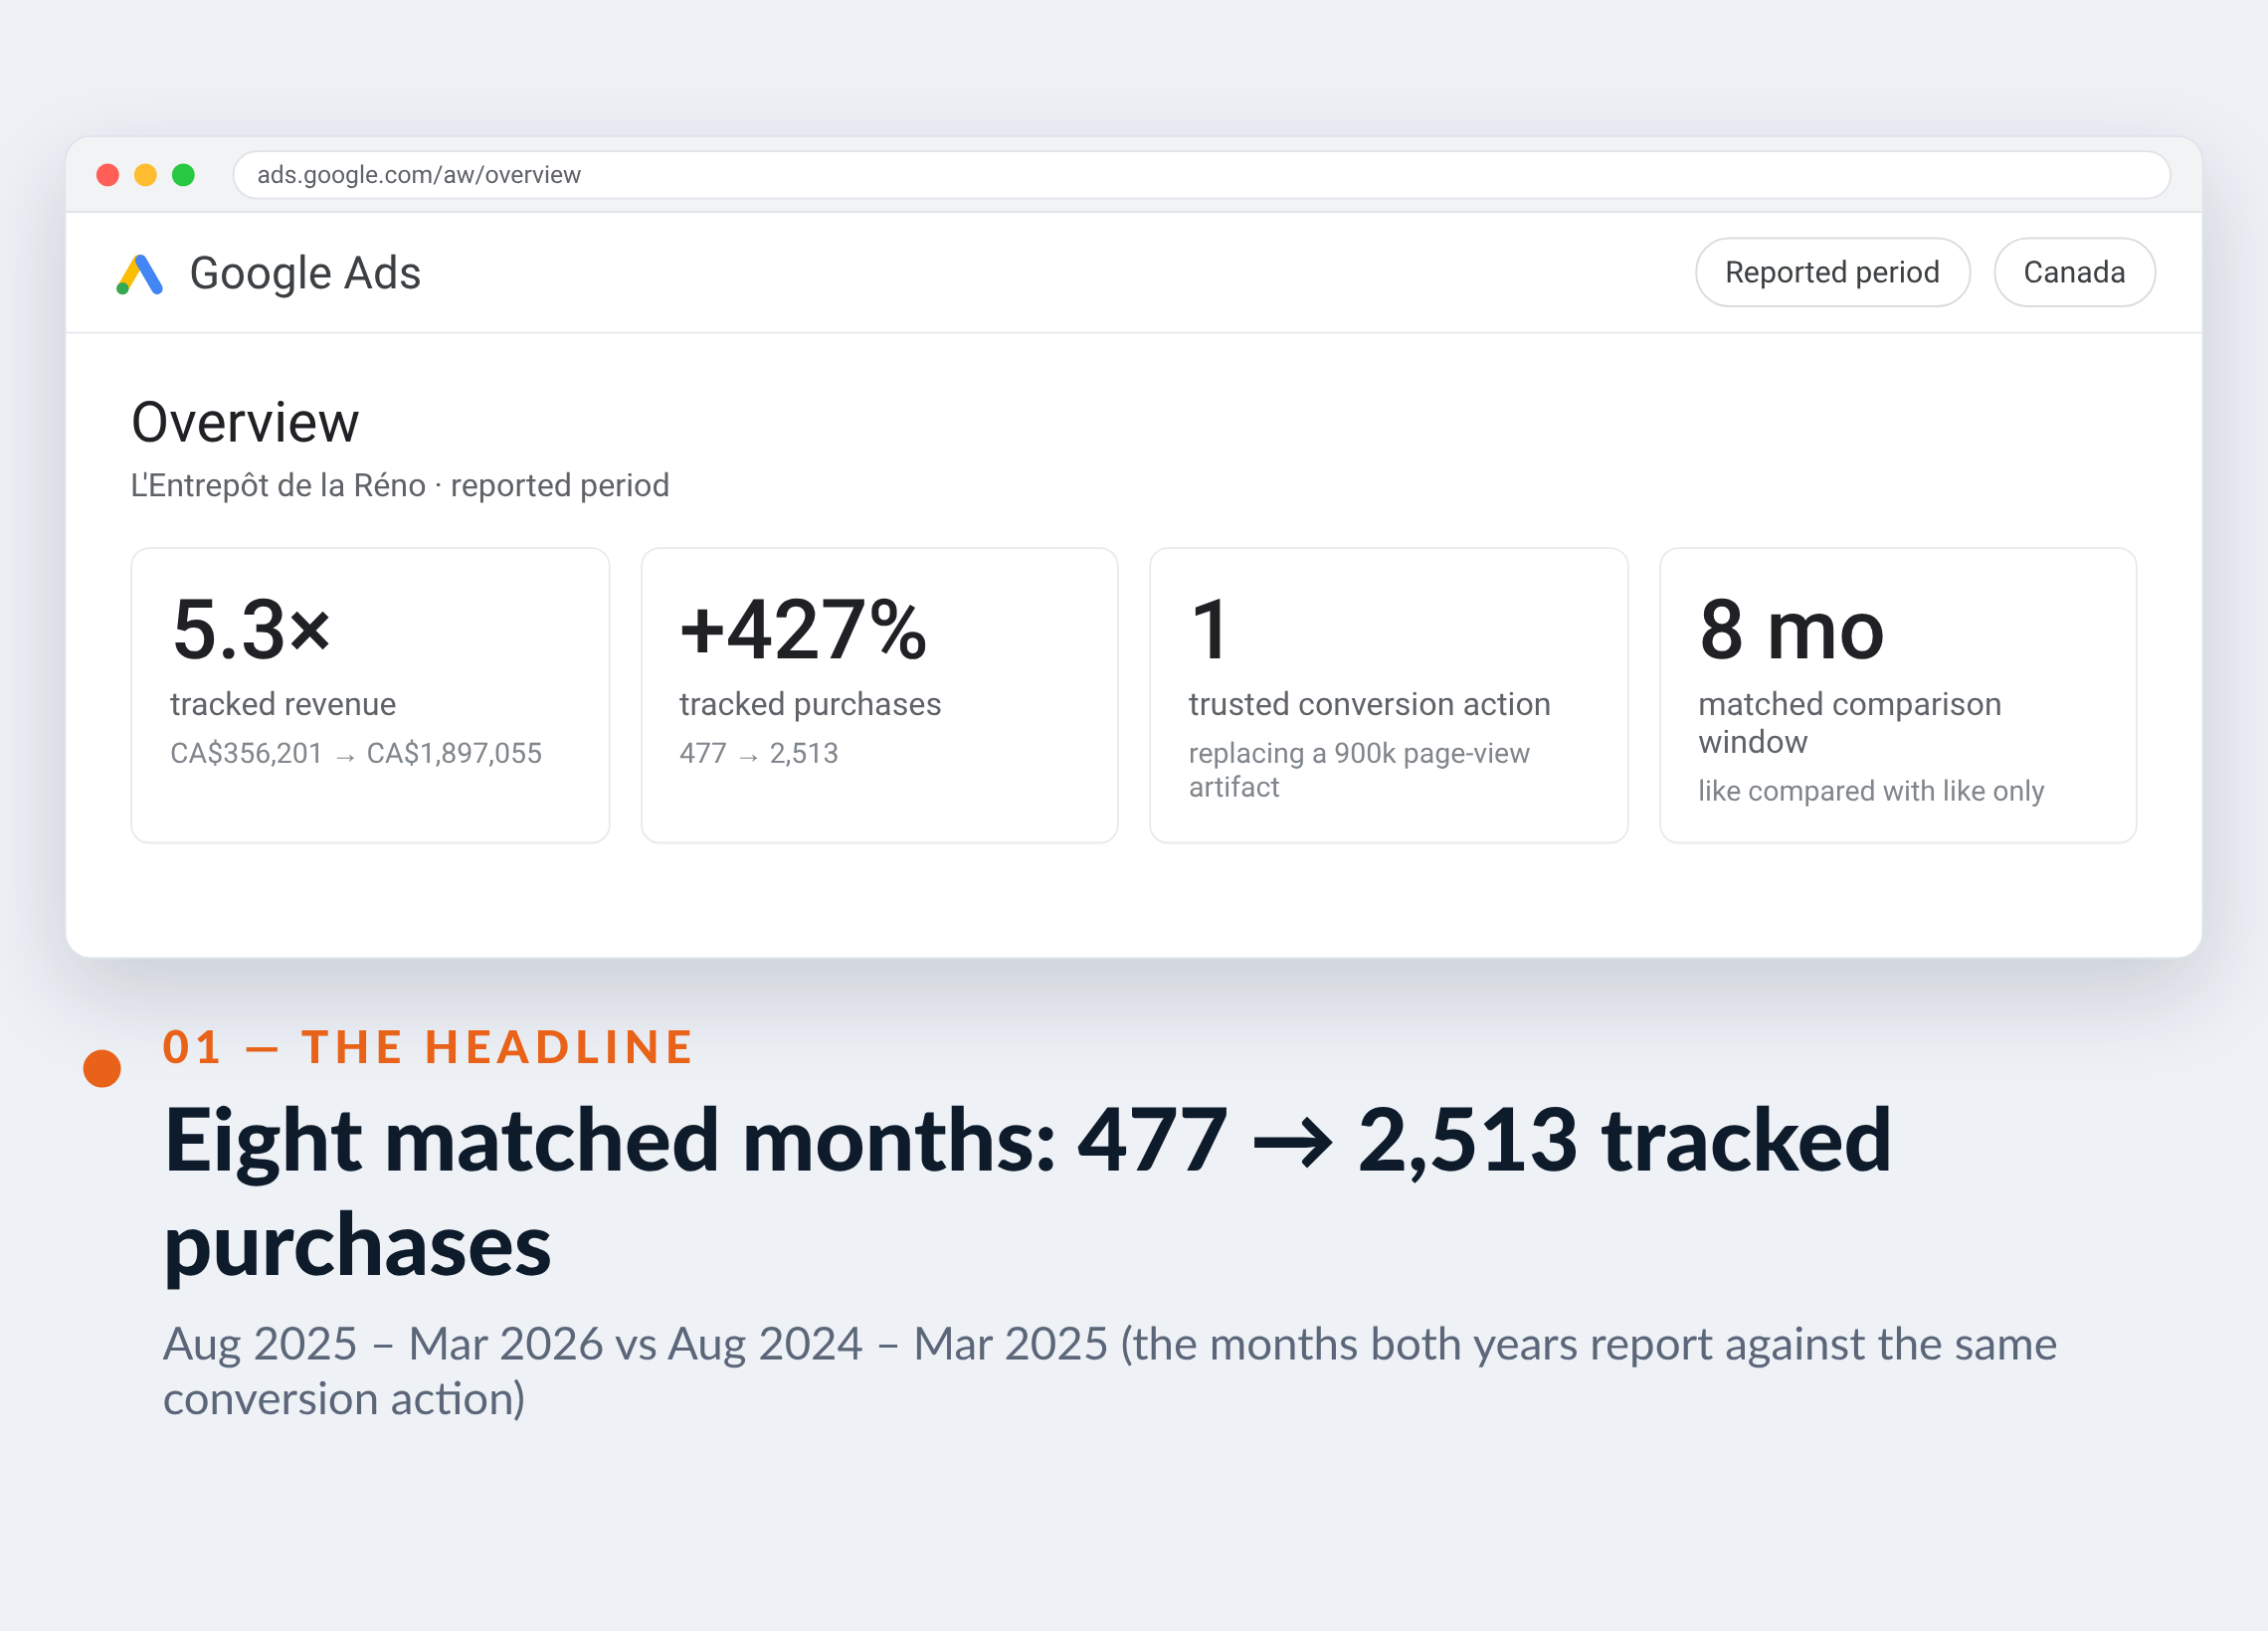
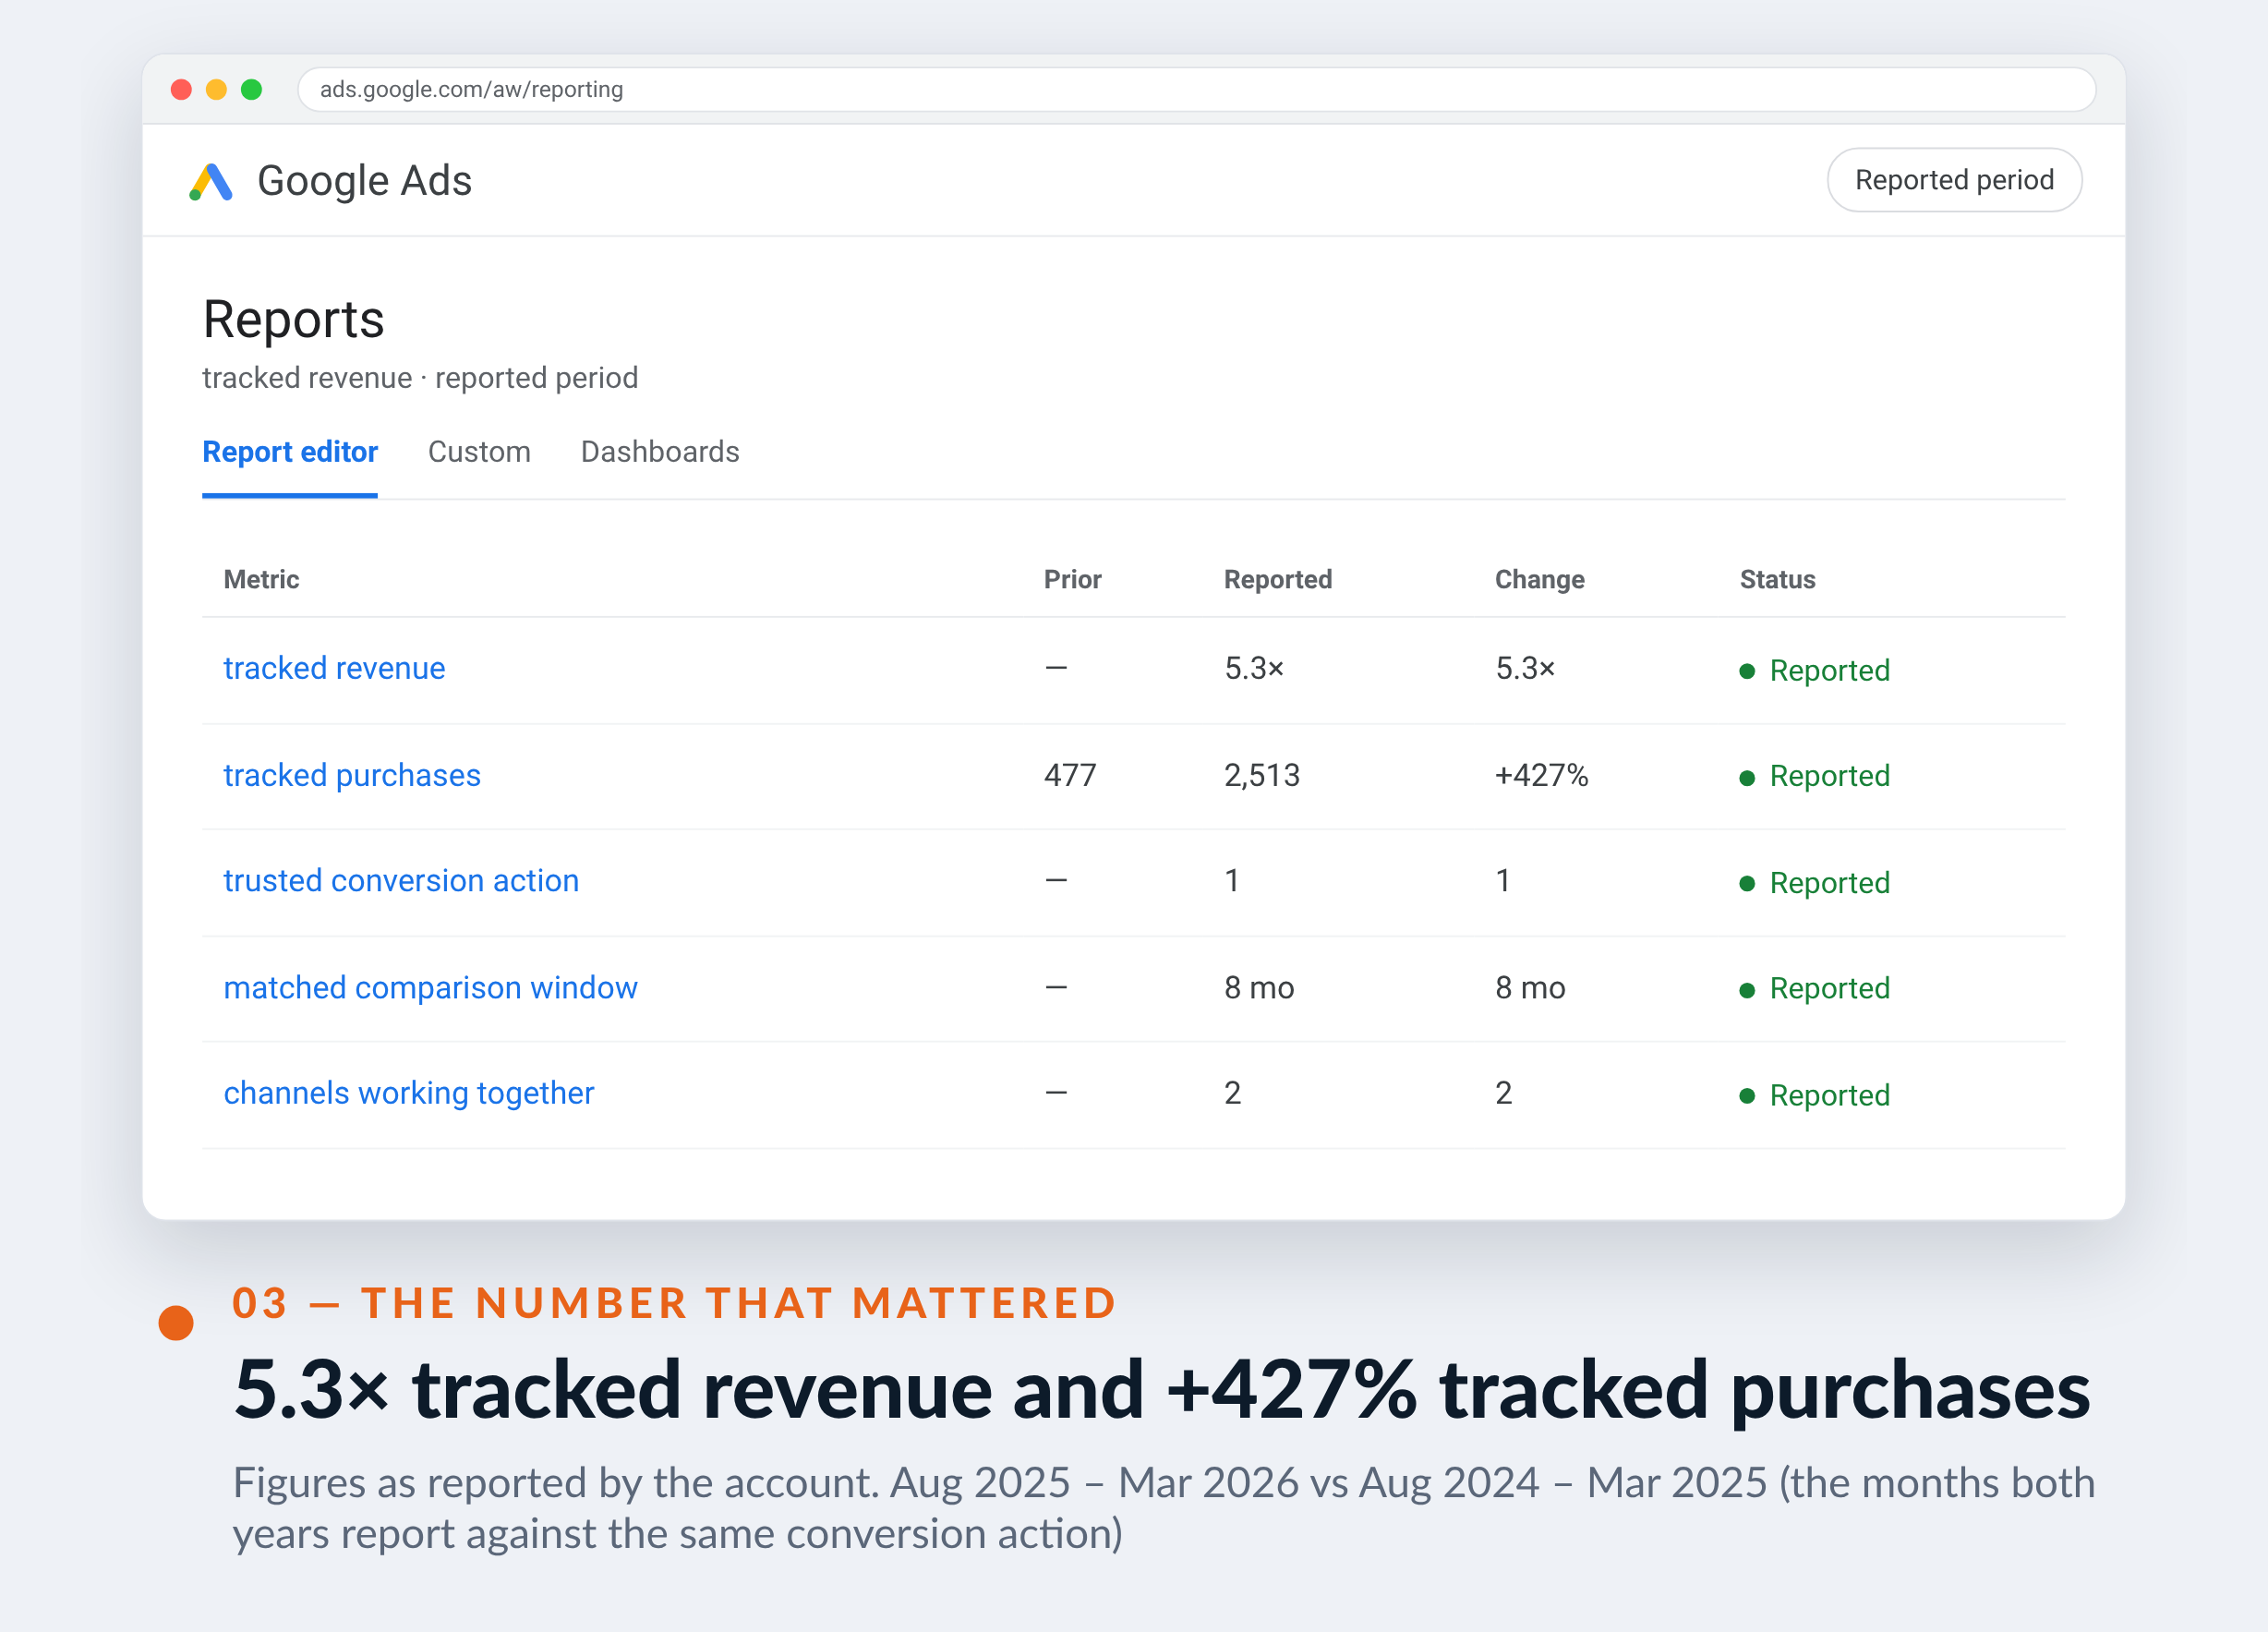
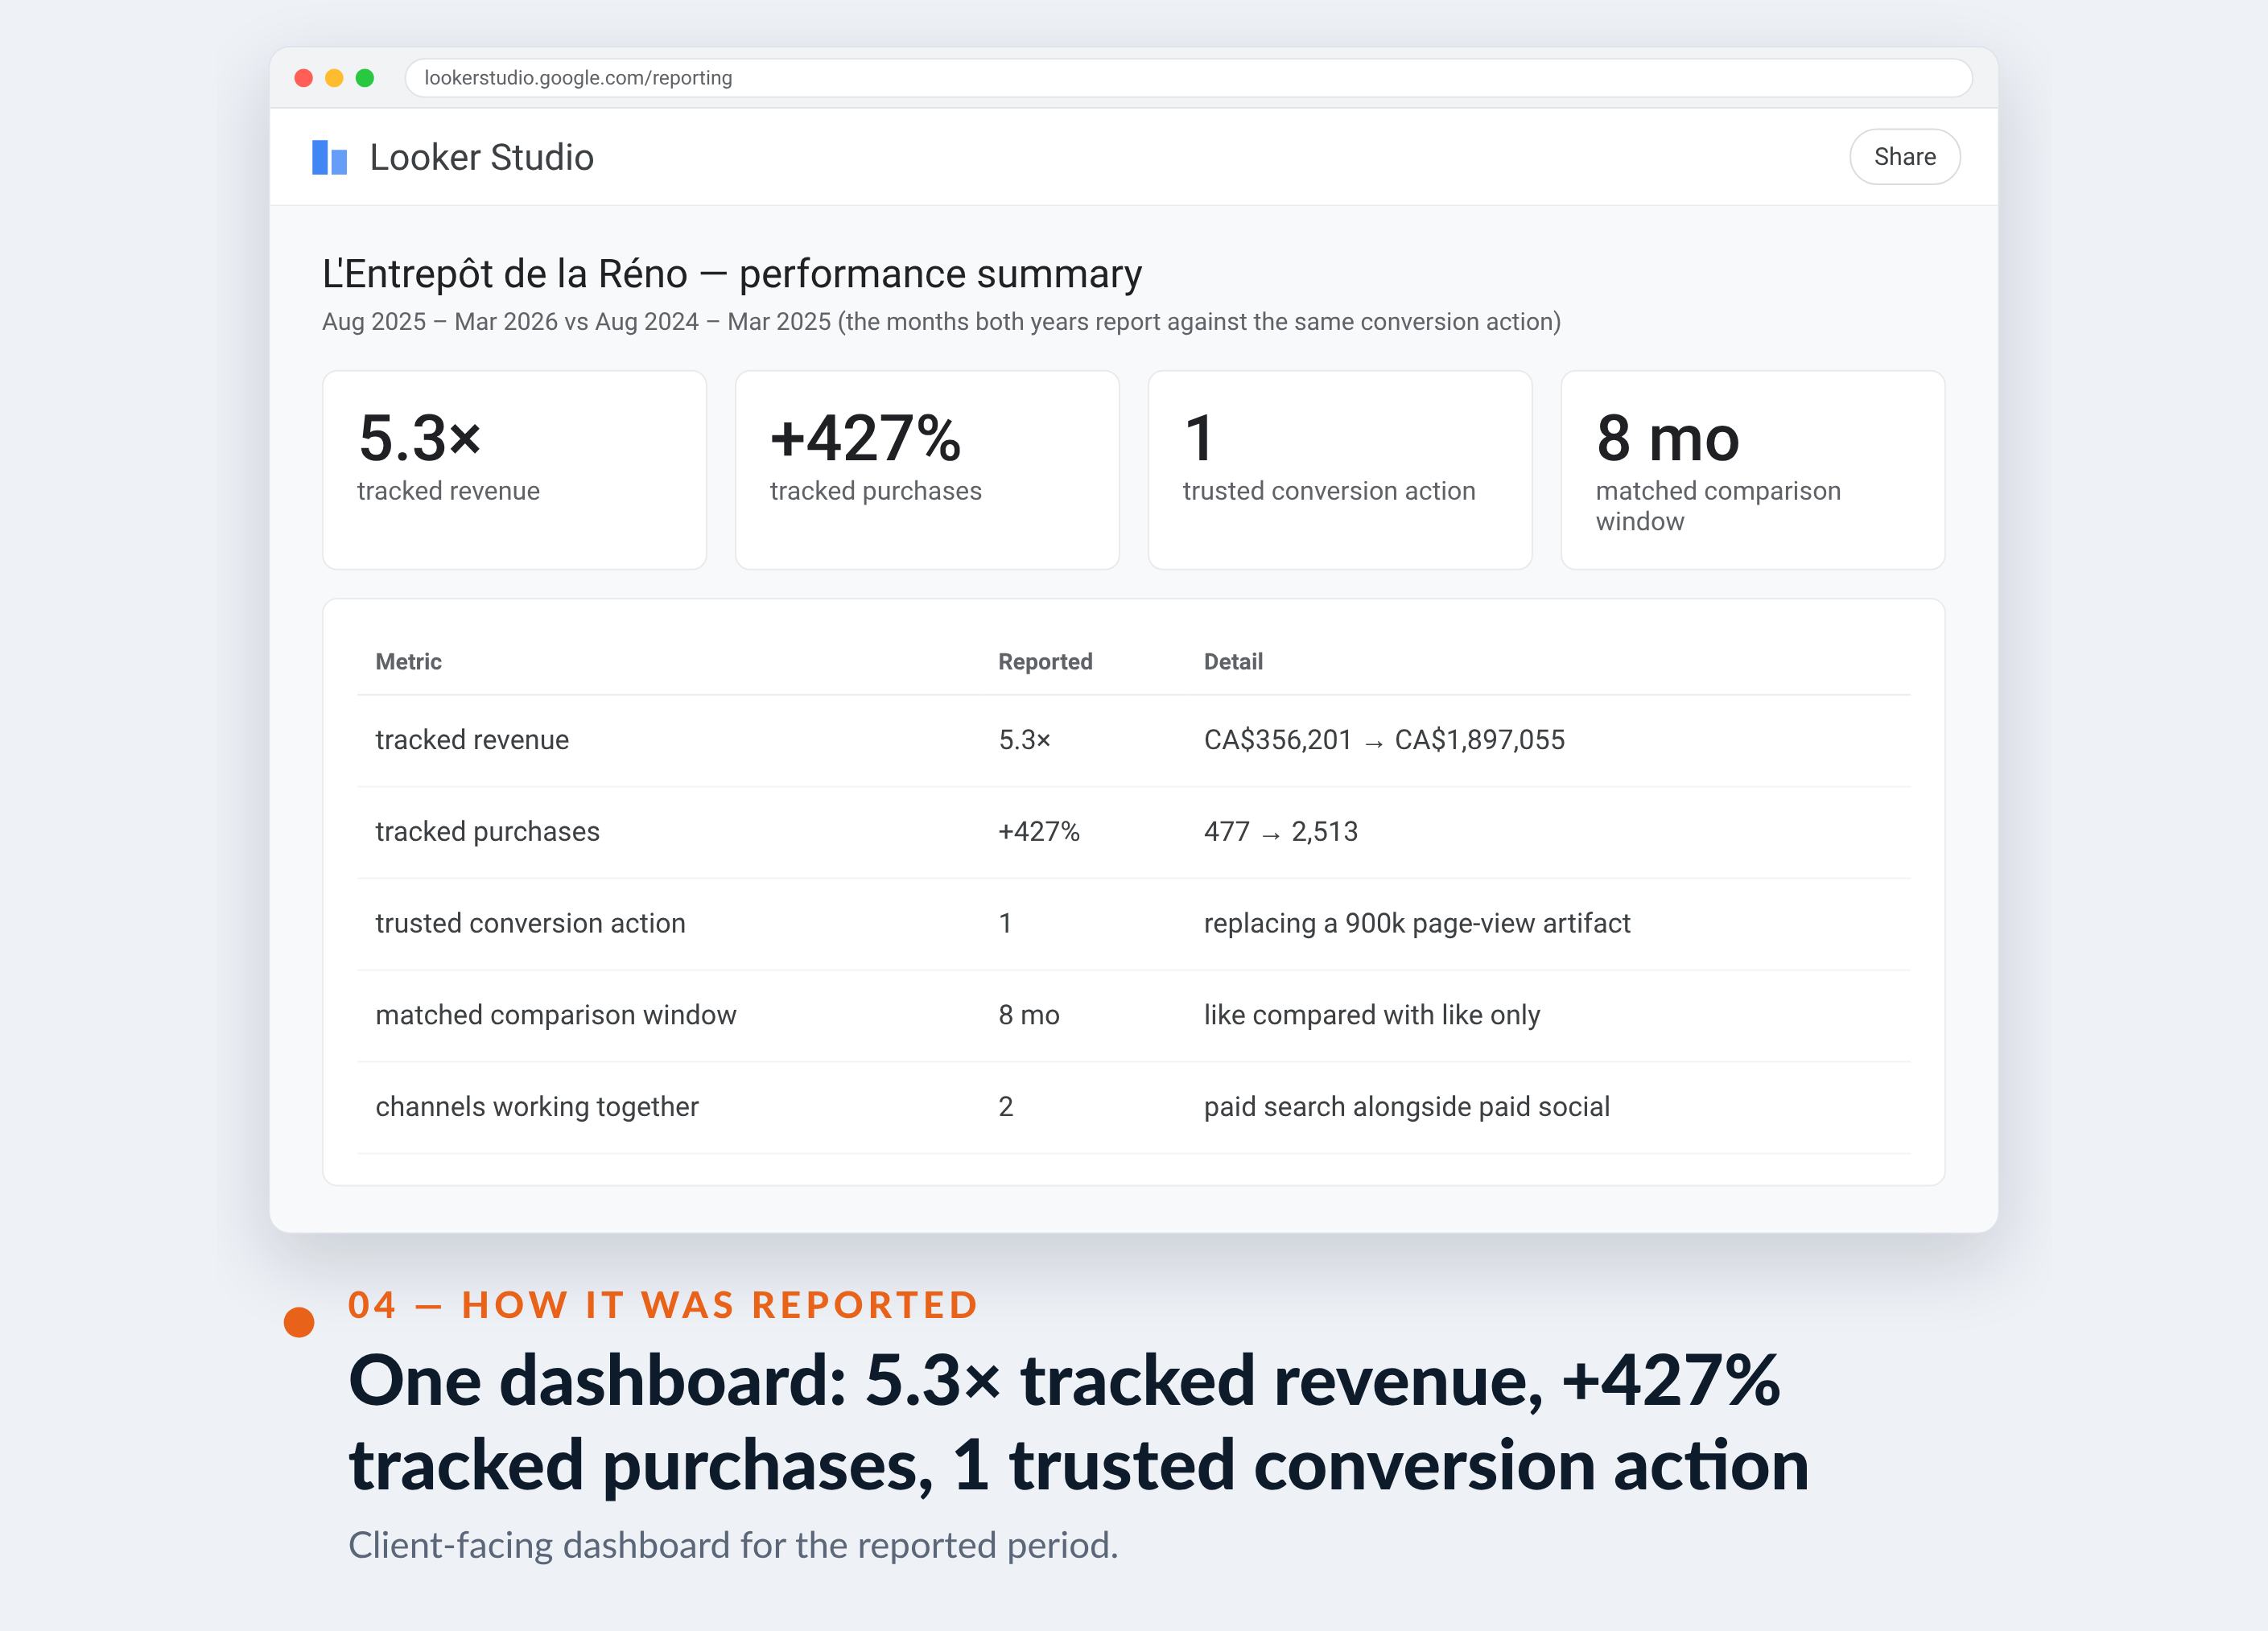
Paid social was scaling. The open question was whether search could carry the same weight. Over the eight months both years cover, tracked purchases went from 477 to 2,513 and tracked revenue from CA$356k to CA$1.90M.

5.3×
tracked search revenue
CA$356,201 → CA$1,897,055
The results, up top — every number is in the strip below
5.3×
tracked revenue
CA$356,201 → CA$1,897,055
+427%
tracked purchases
477 → 2,513
1
trusted conversion action
replacing a 900k page-view artifact
8 mo
matched comparison window
like compared with like only
2
channels working together
paid search alongside paid social


01 — The challenge
A search account that could not tell a sale from a page view.
Quebec's renovation and building-materials market is fiercely price-shopped, and search is where that shopping happens. The account was live and spending, but its conversion setup was a museum of every tag anyone had ever installed — including a page-view action that had recorded more than 900,000 “conversions”.
An account in that state is not badly optimised, it is badly instructed. Smart Bidding does exactly what the data tells it, so the first constraint was not budget or creative — it was deciding, once, which single action represented a real sale.
“We already knew Facebook was working. Search felt like the channel we were supposed to have and never really had. What changed is that someone finally decided what a conversion was, and then held the account to it.”
That is the unglamorous heart of this one. The lift did not come from a clever bidding trick; it came from agreeing on a single trustworthy purchase action and refusing to optimise toward anything else.
02 — Our approach
One trustworthy action, then structure around the catalogue.
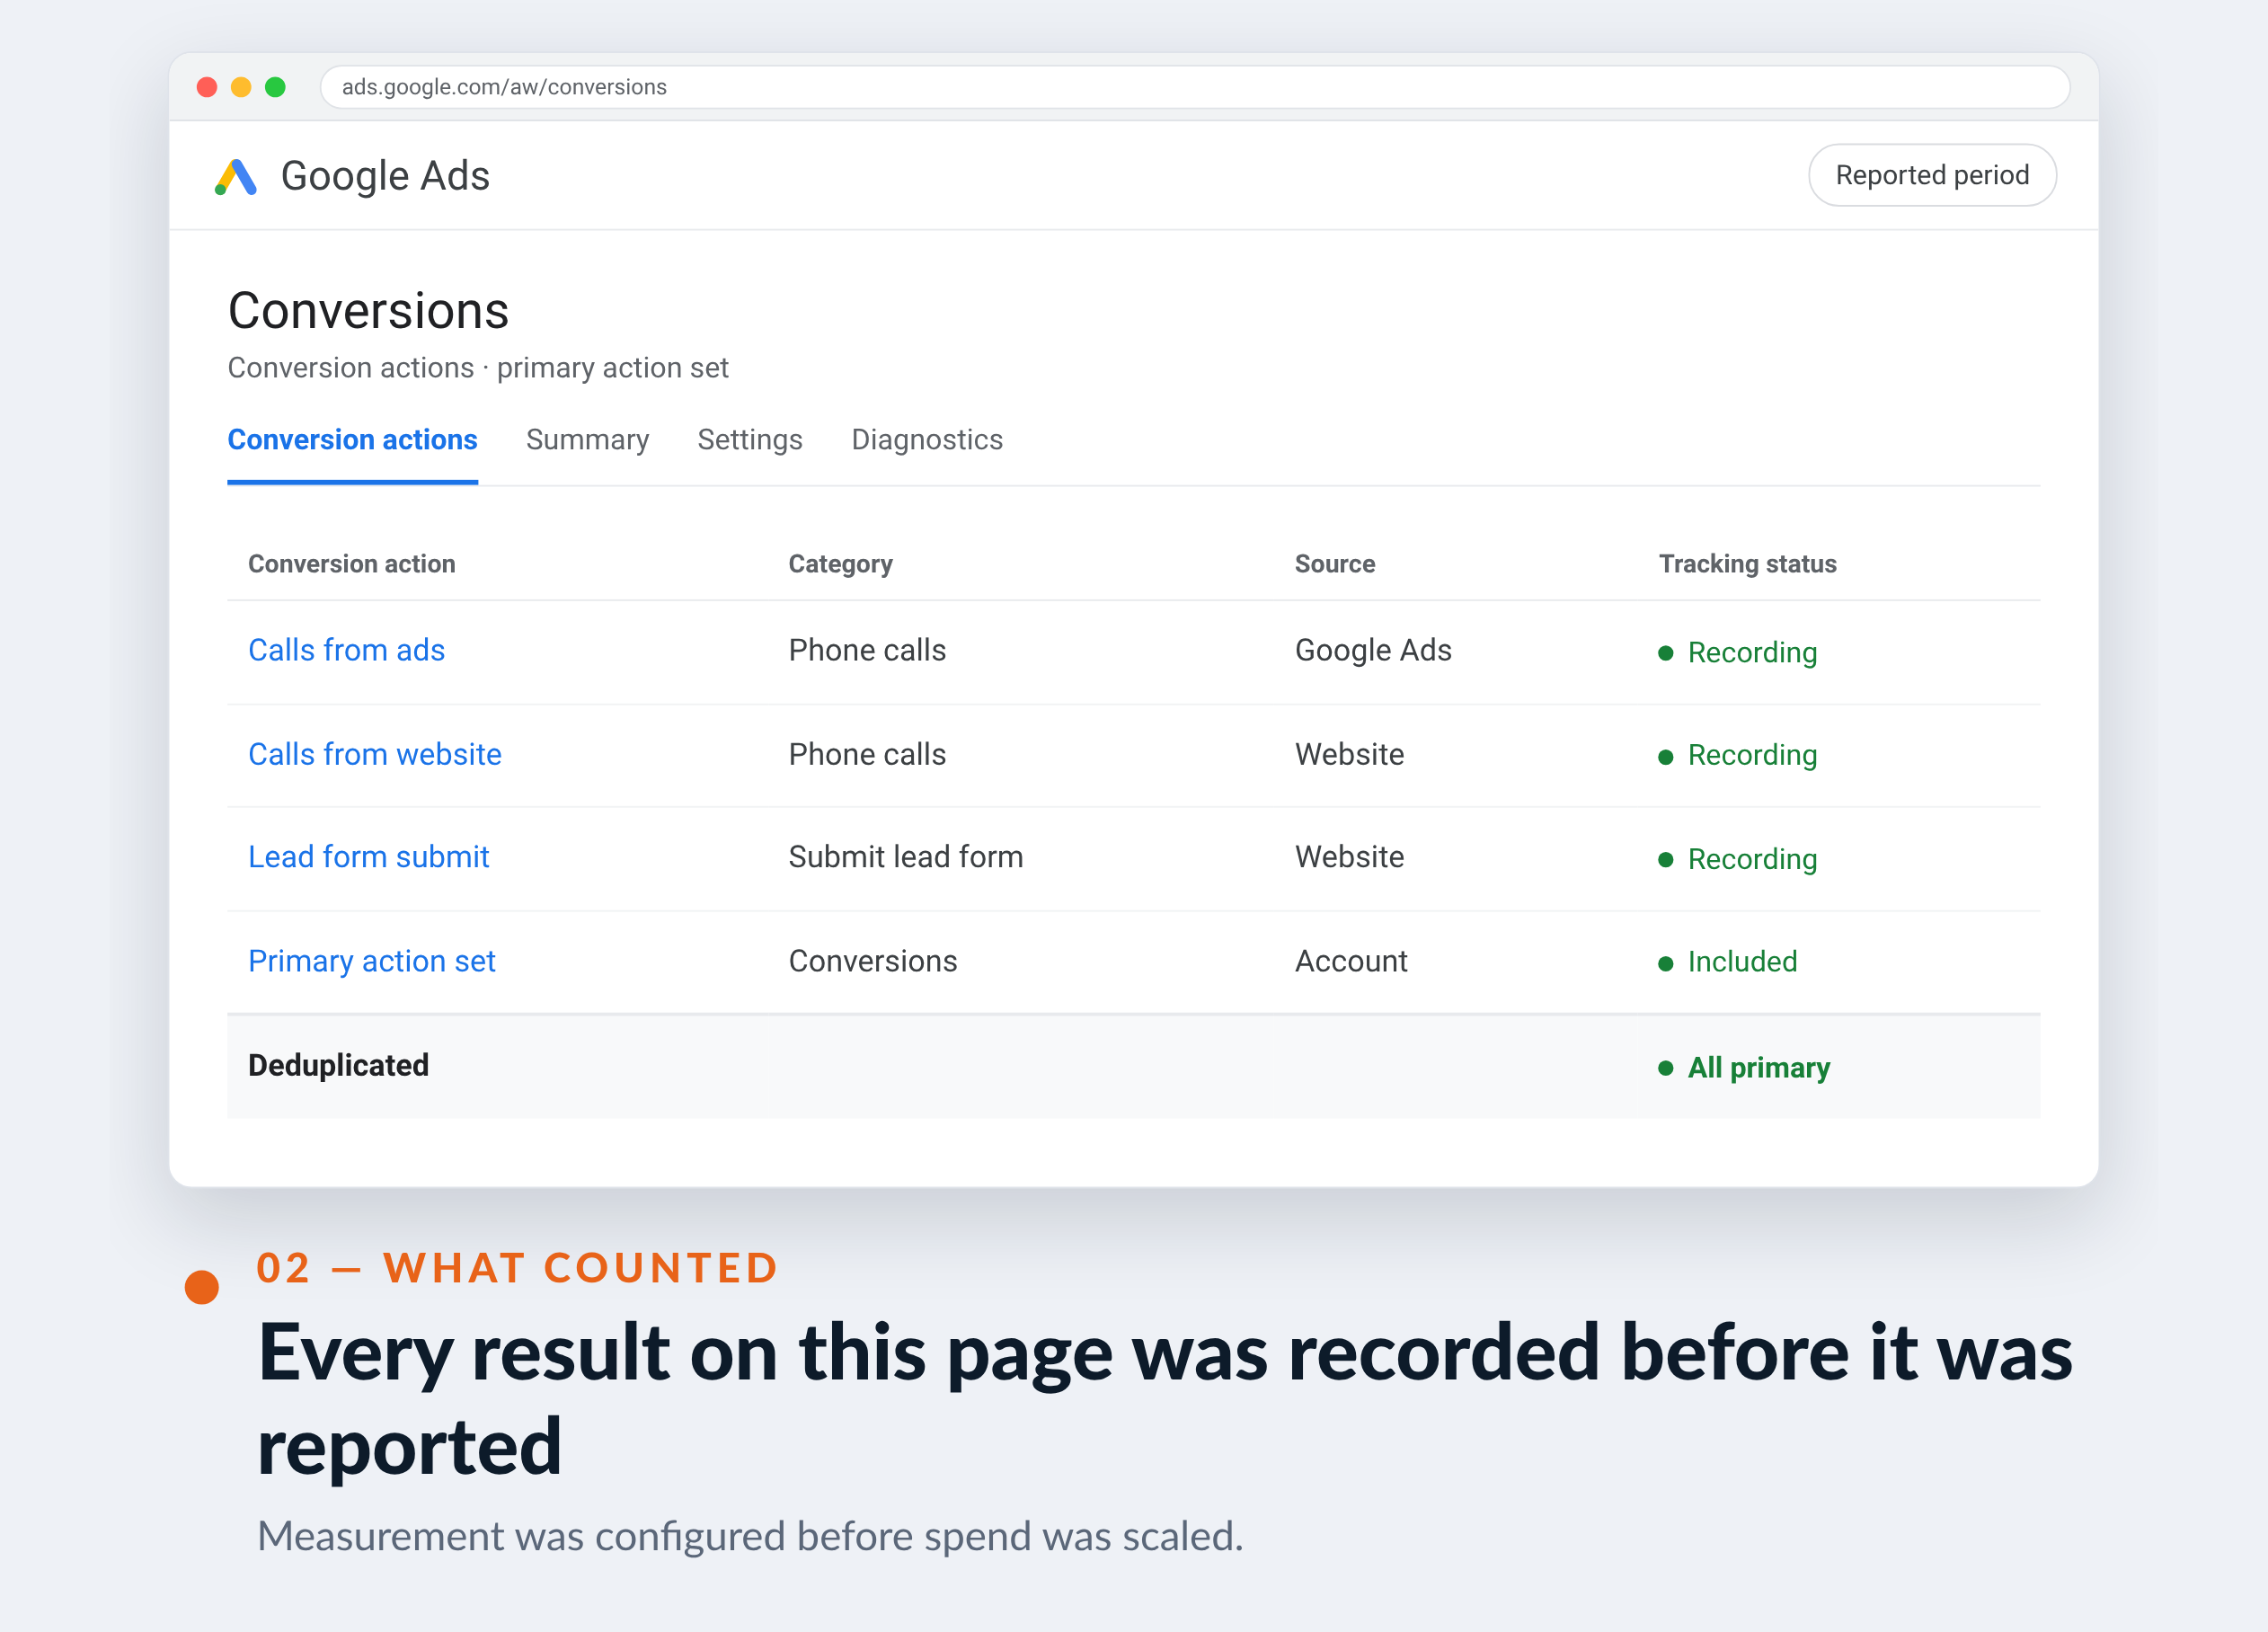
A single verified purchase action was isolated, and reporting and bidding rebuilt reporting and bidding around it, deliberately ignoring the inflated legacy actions even though they made the dashboard look better. Every number on this page comes from that one action, which is also why the window here is eight months rather than a full year.
With measurement honest, the structure followed the way the business actually sells: high-intent product and brand demand kept in tightly controlled search campaigns, and catalogue-driven demand handled where the feed can do the targeting. Shopping and search were judged on their own revenue rather than on a blended figure that hides which one is subsidising the other.
Then the boring, high-yield work ran continuously: search-term mining, negative lists that keep the account out of DIY-advice and job-seeker traffic, and feed hygiene so the products with margin were the ones getting impressions. Budget followed proven revenue rather than promise.


03 — What we did
Fix the definition of a sale, then build around the feed.
Measurement, structure, feed, then budget. In that order, because each step makes the next one honest.
Conversion tracking
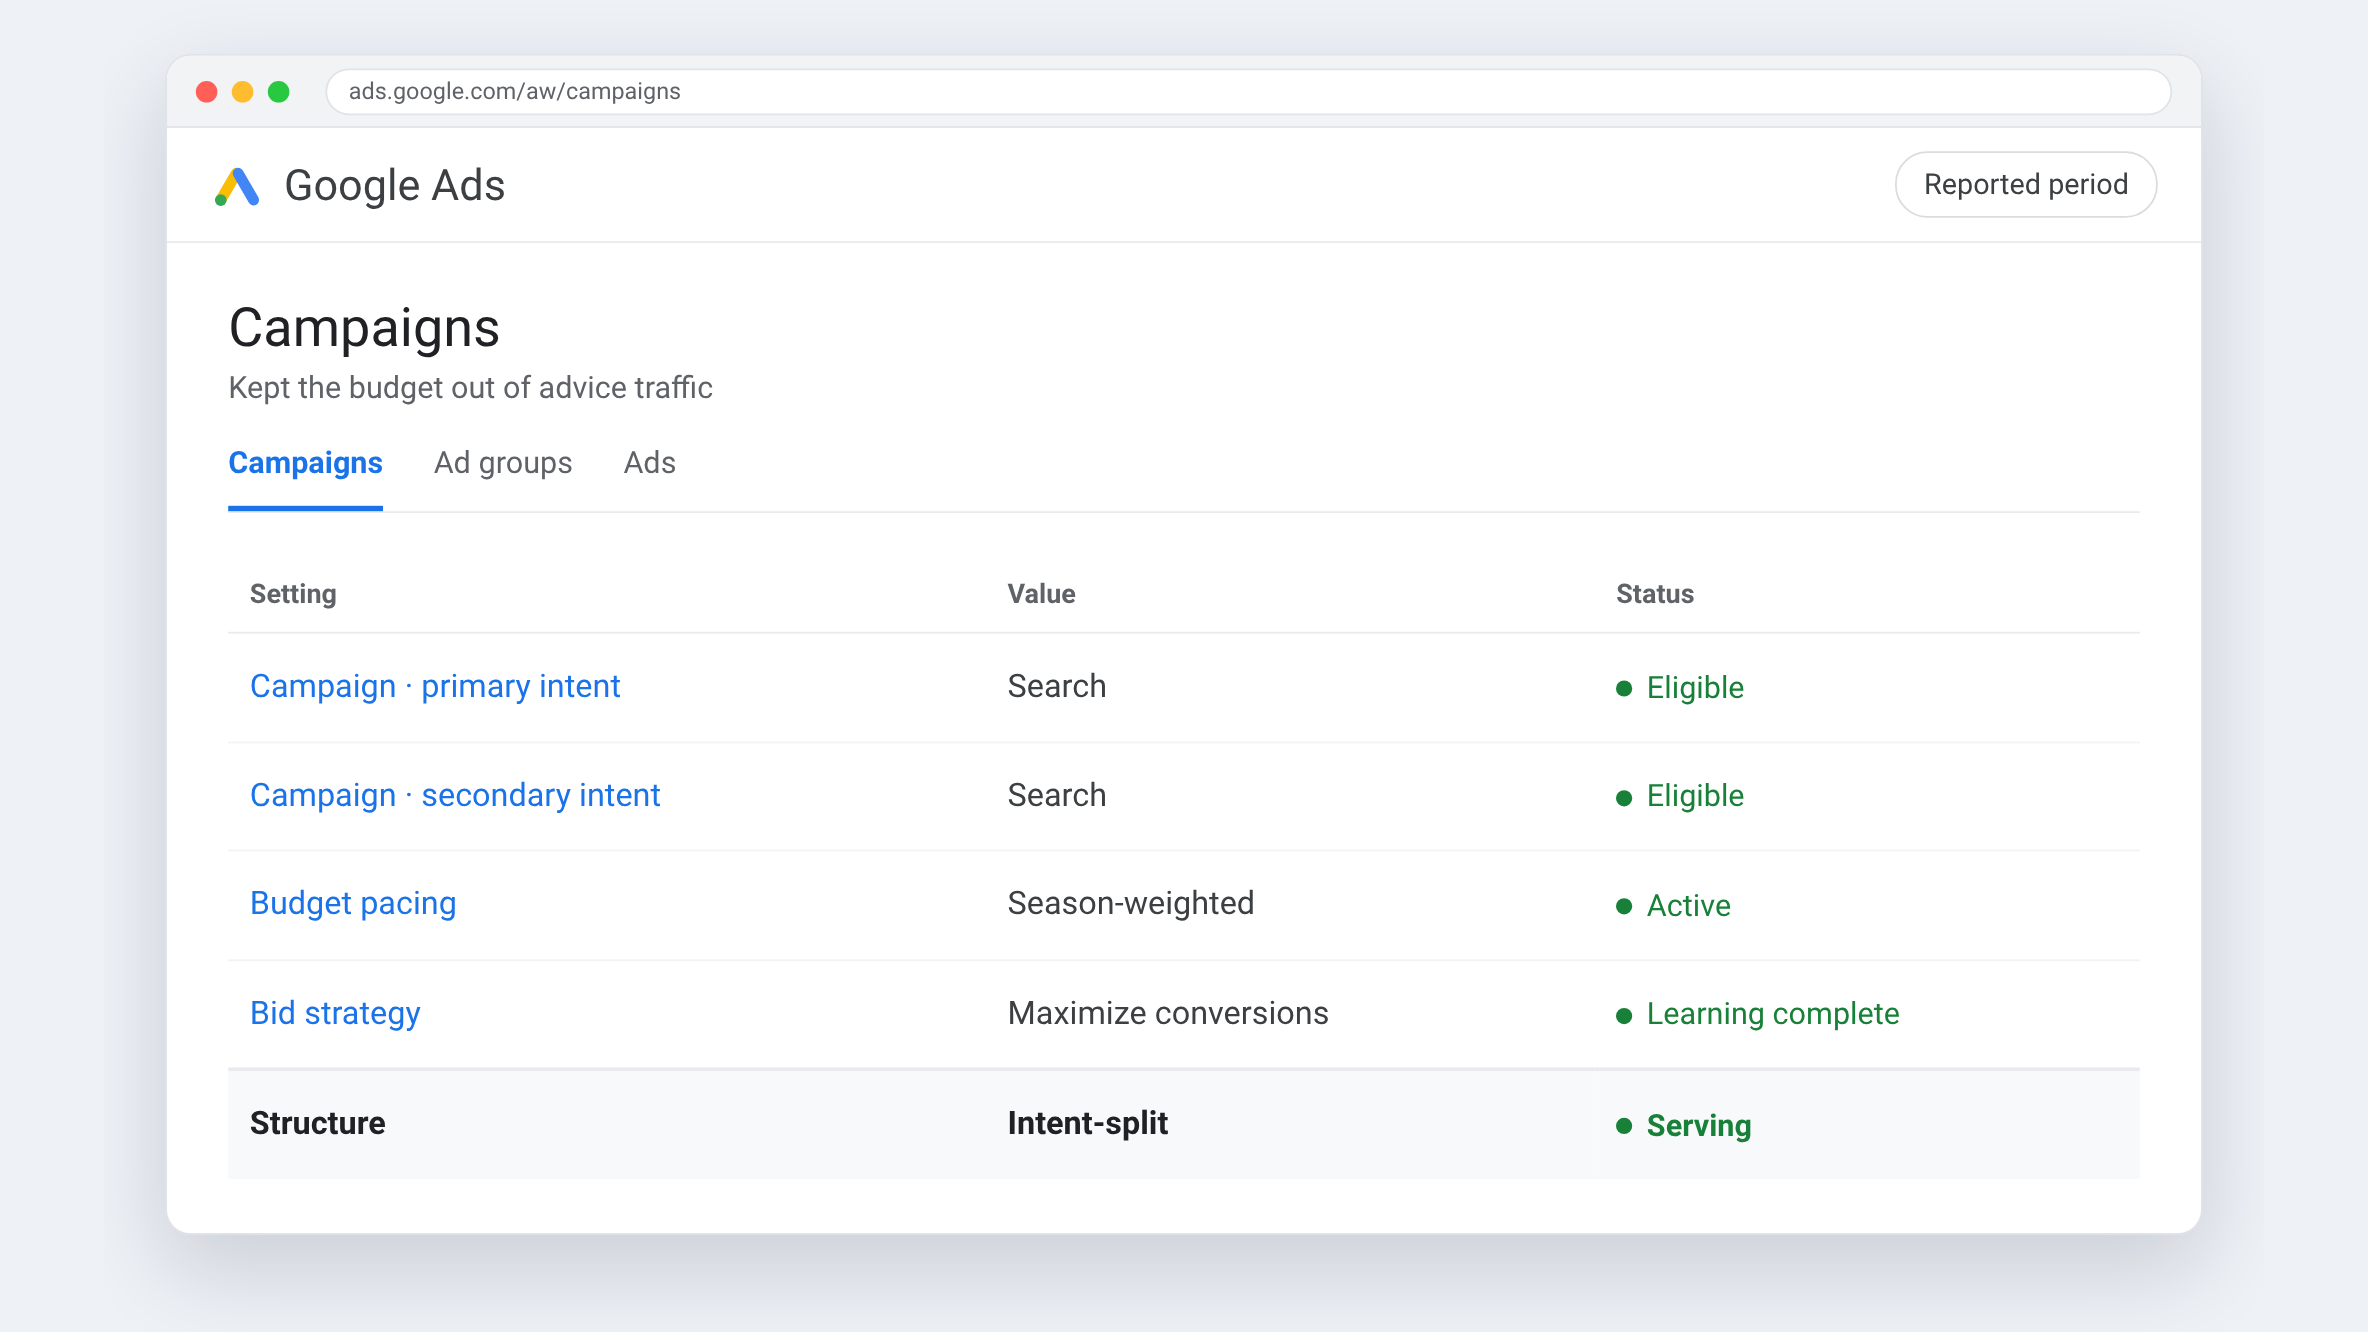
Picked one action that meant a sale, and ignored the rest
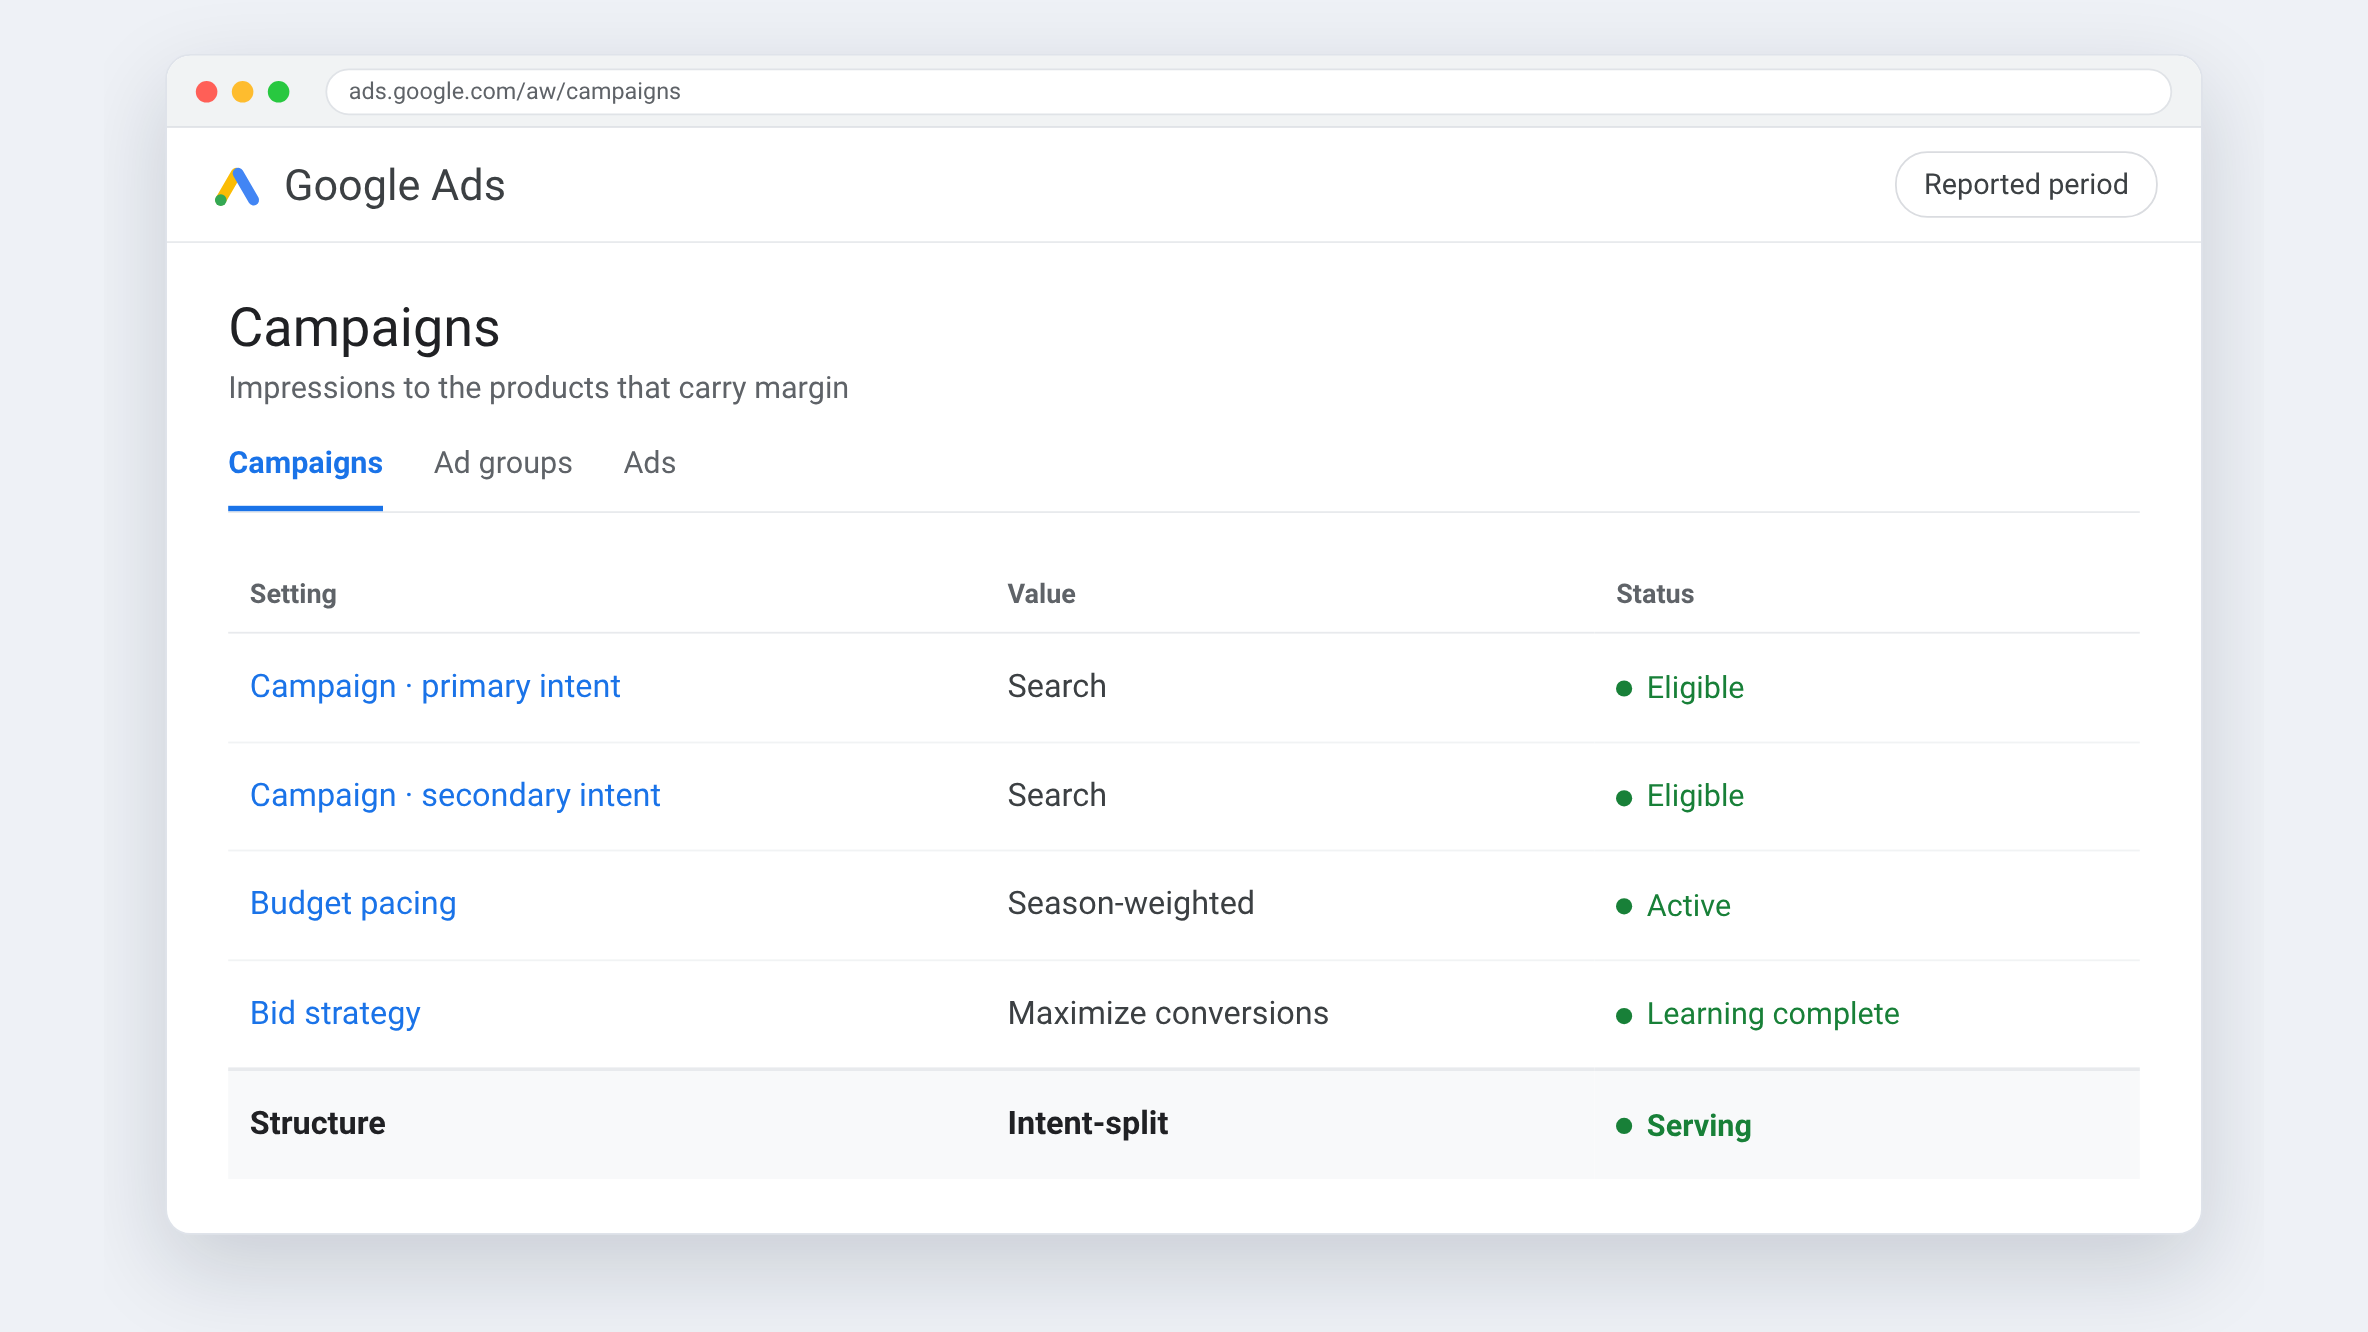
The account carried a page-view action with over 900,000 recorded conversions. Bidding and reporting were rebuilt around a single verified purchase action — the reason the numbers here are lower than the dashboard's, and the reason they are true.
Campaign structure
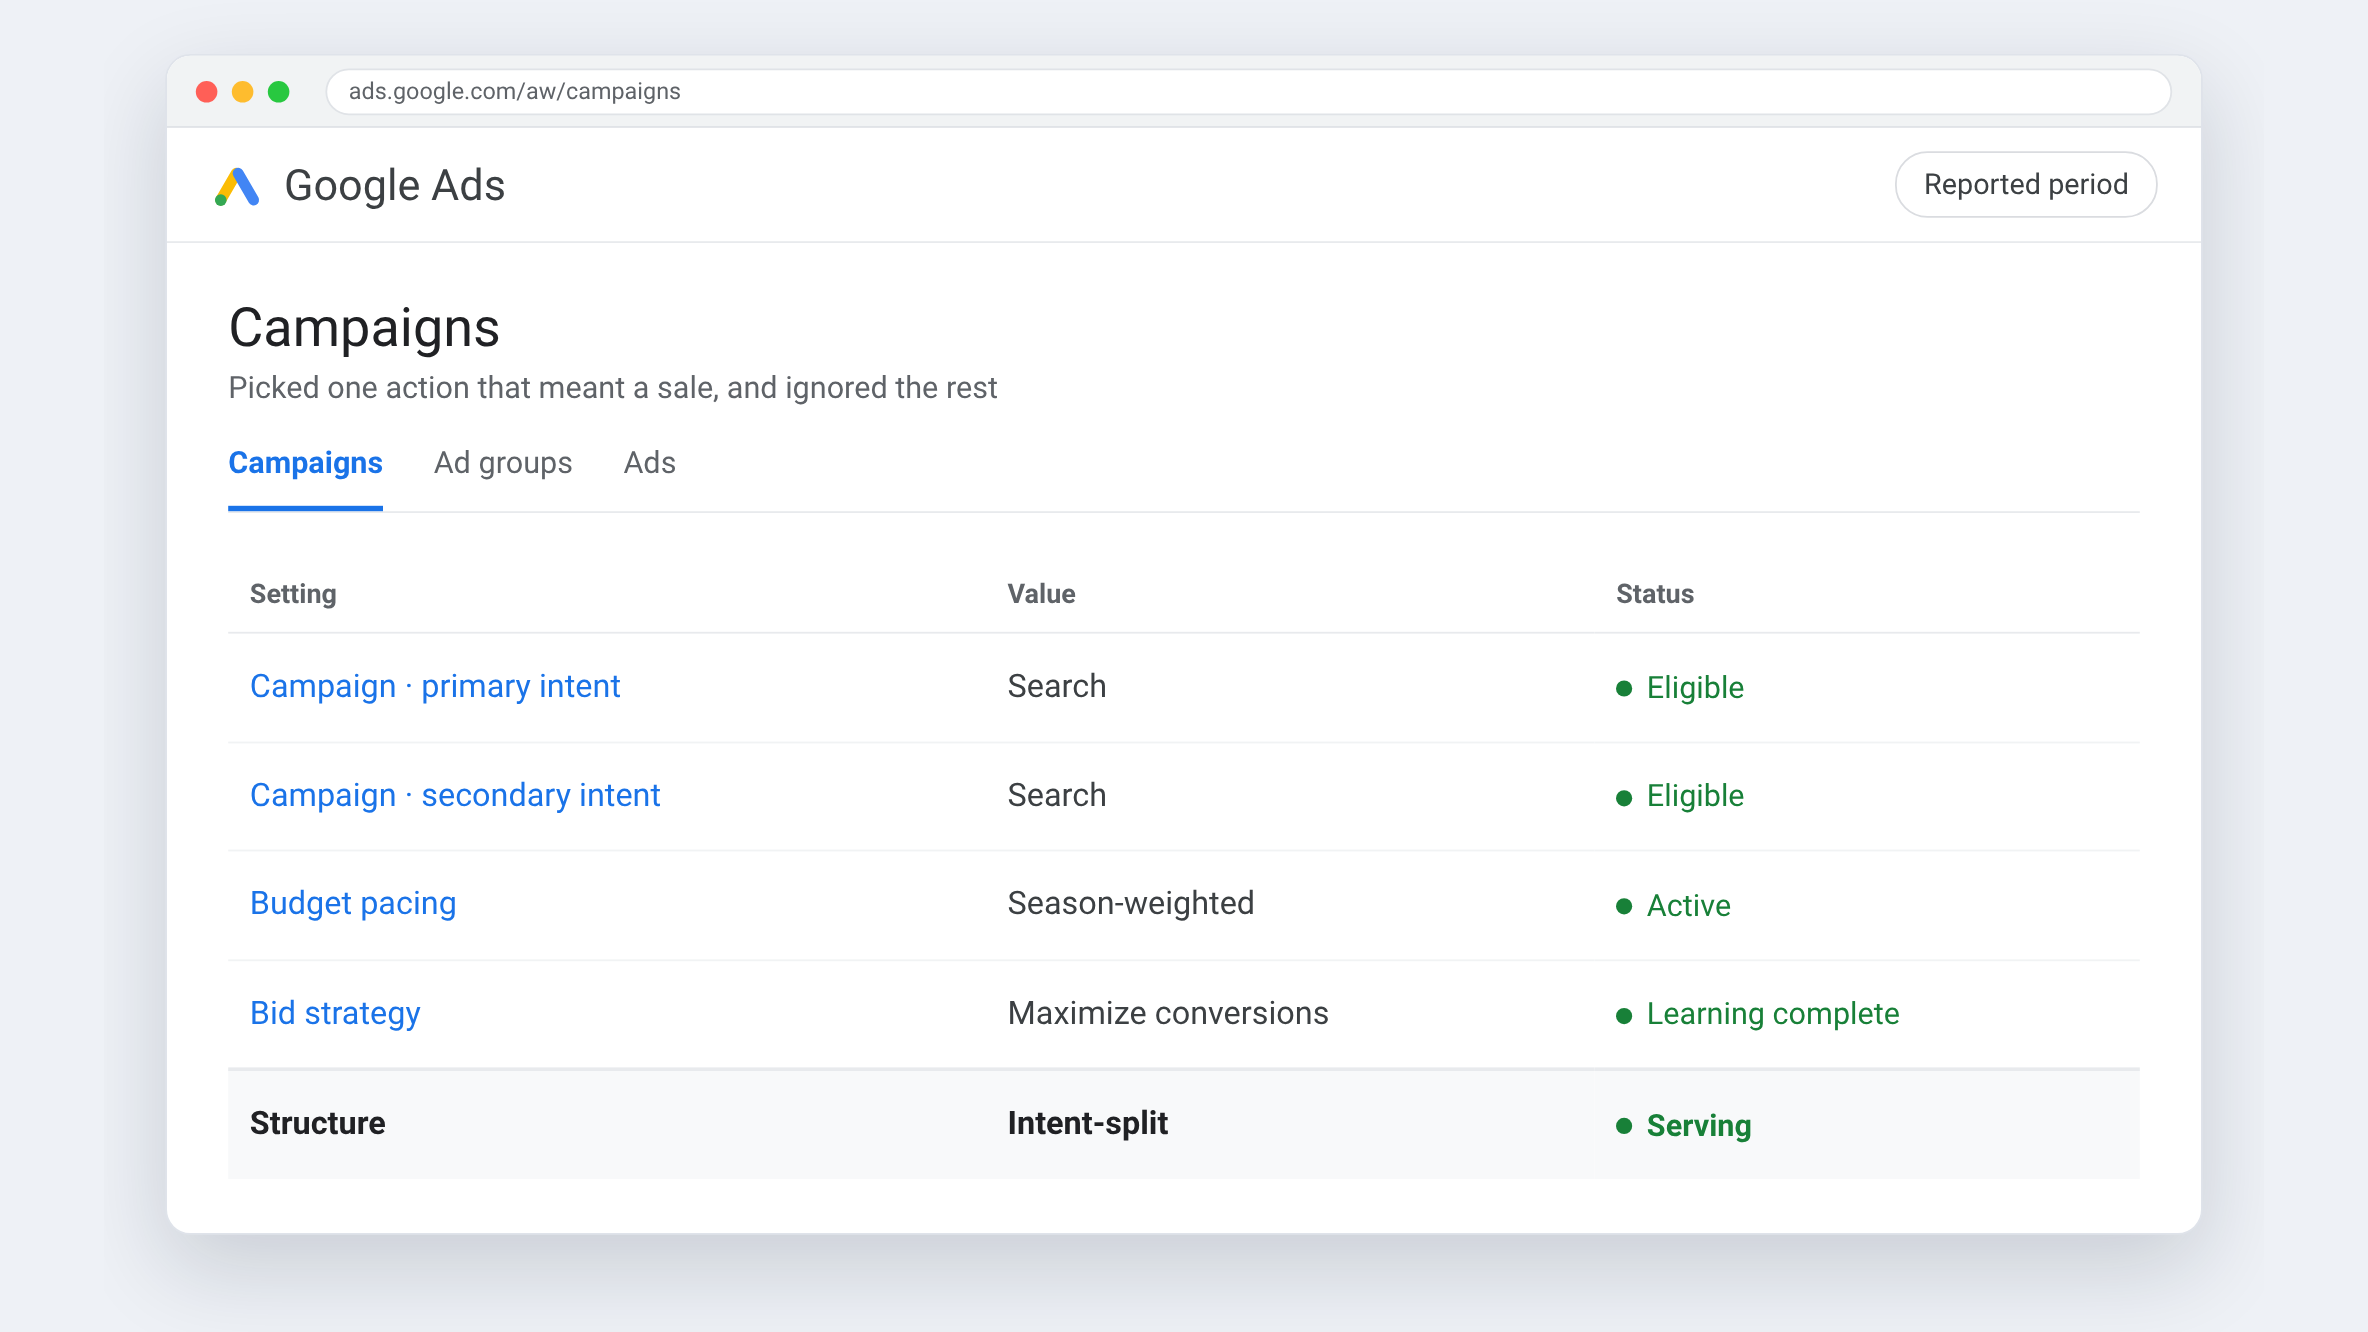
Separated high-intent search from catalogue-driven demand
Brand and product searches stayed in tightly controlled search campaigns; feed-driven demand was handled where the catalogue can do the targeting. Each was judged on its own revenue instead of a blended figure.
Search terms & negatives
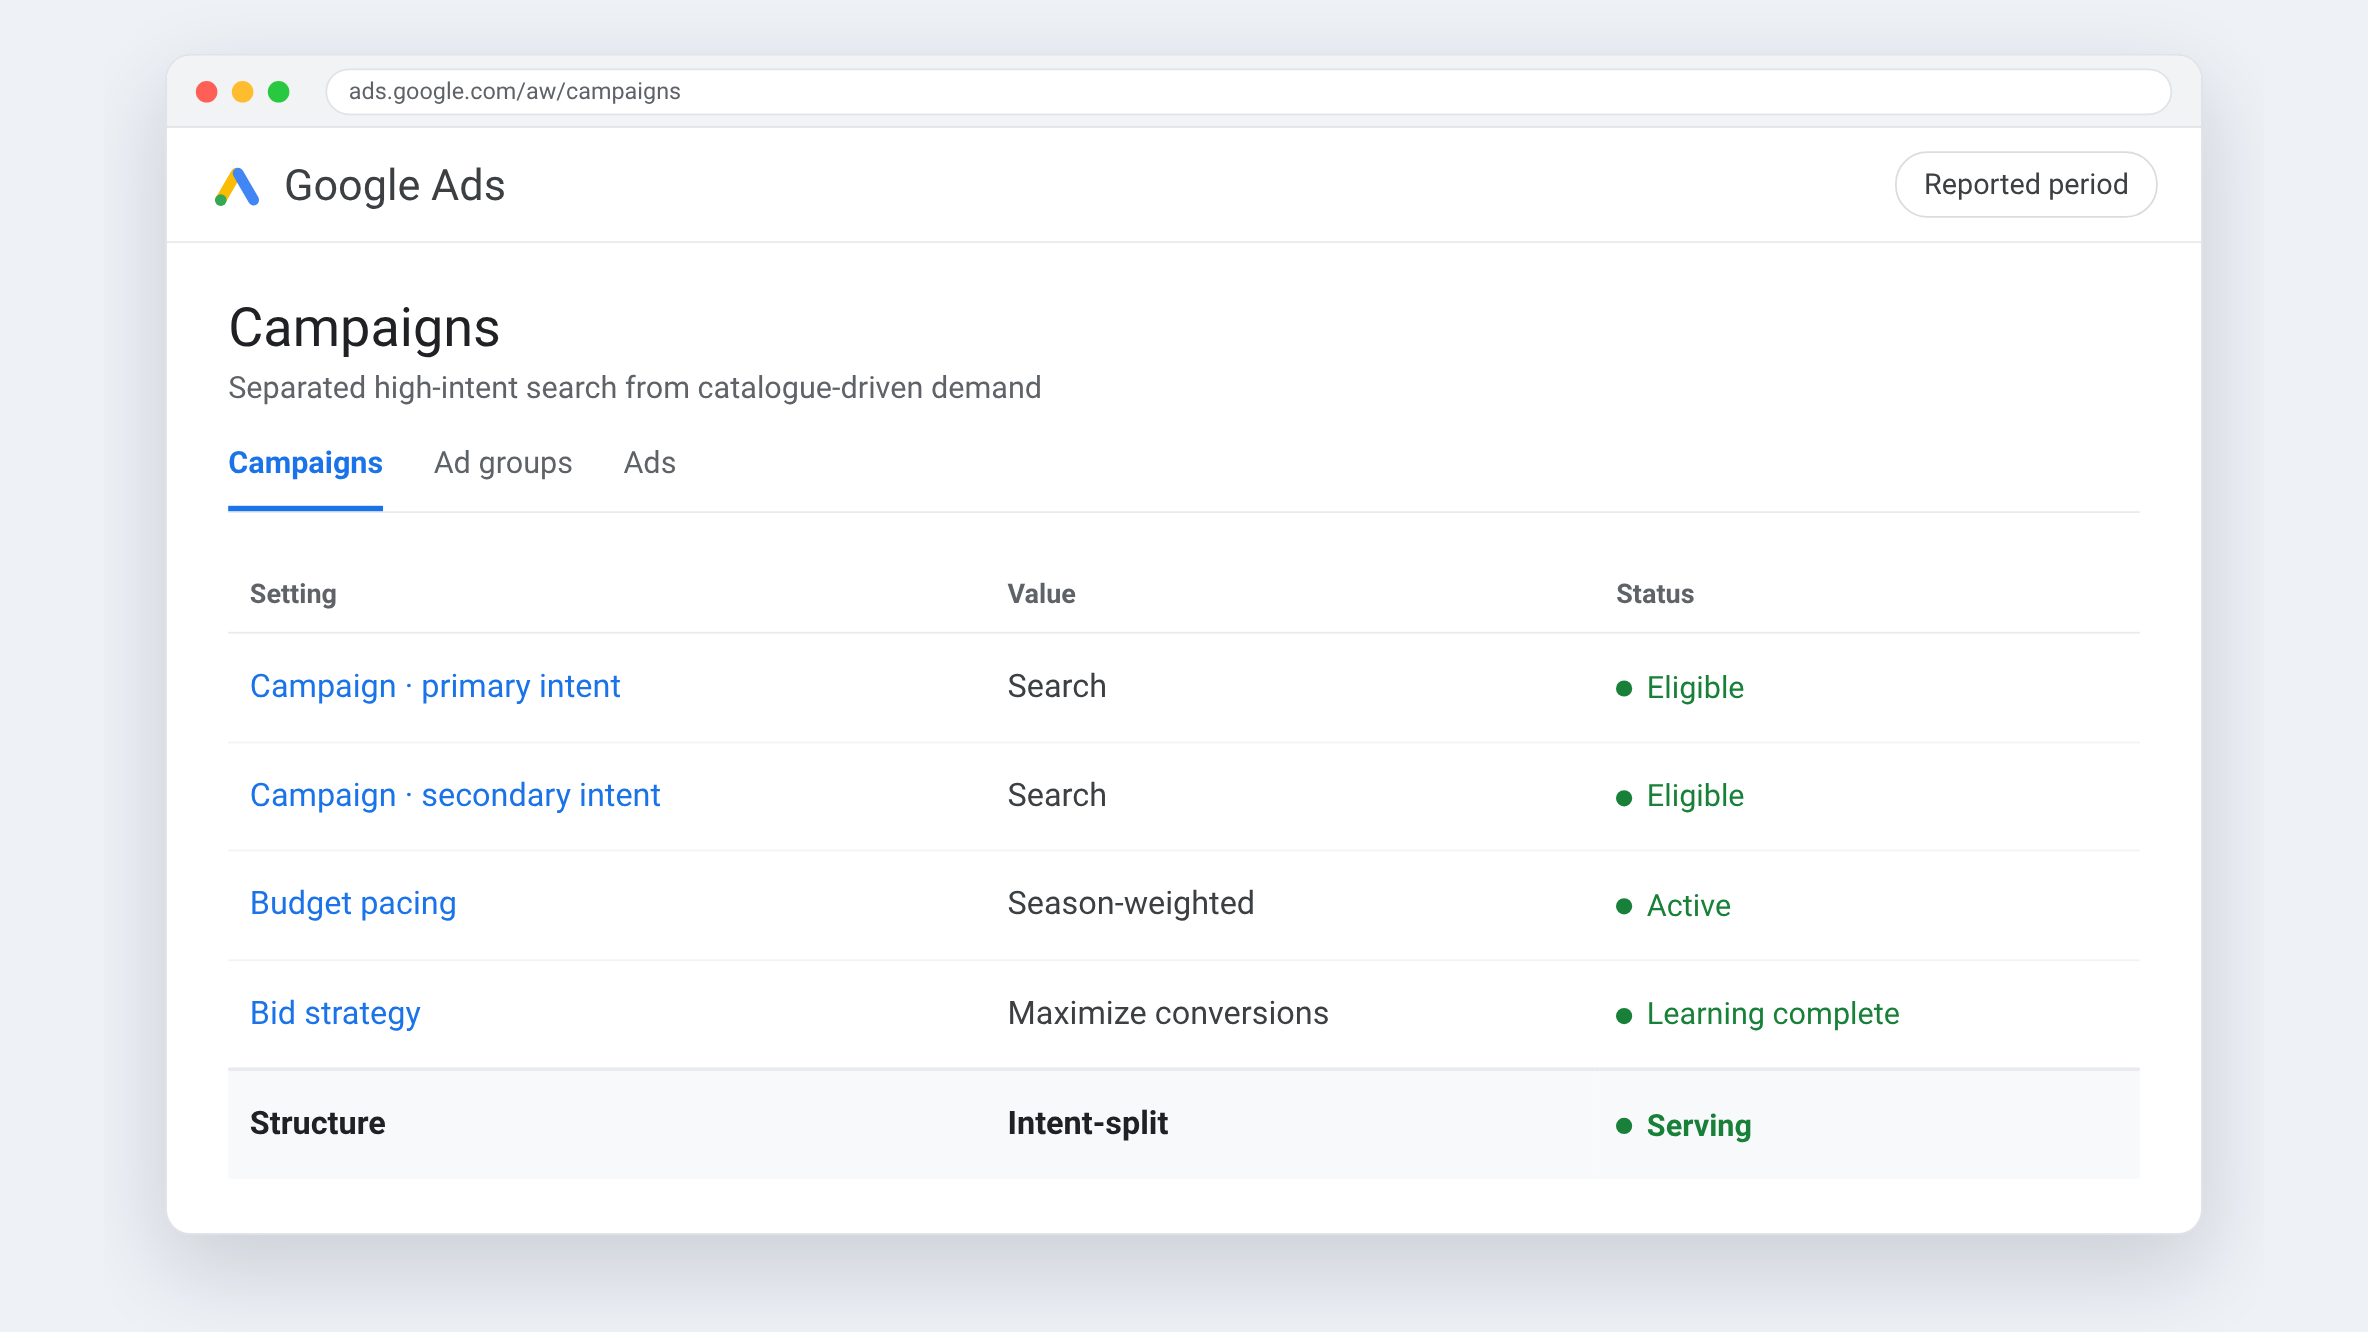
Kept the budget out of advice traffic
Continuous search-term mining with negative lists for DIY how-to, job-seeker and out-of-area queries. In a materials category, that traffic converts at nearly zero and clicks are not cheap.
Feed & budget discipline
Impressions to the products that carry margin
Feed hygiene so titles, categories and availability were correct, then budget moved to proven revenue rather than promise. Revenue grew 5.3× while the account stayed inside a controlled spend increase.

04 — The results
Eight matched months: 477 → 2,513 tracked purchases.
The stack we ran it on

Google Ads
Paid search

Google Merchant Center
Feed

GA4
Analytics

Google Tag Manager
Tracking

Shopify
E-commerce

Meta Ads Manager
Paid social

AgencyAnalytics
Reporting

Looker Studio
Dashboards















































Farrukh Ahmed CPA — Local SEO launch
position 50 → 17 · +166% desktop map impressions



Food Allergy Institute — Paid media and booked consultations
243 → 1,012 consultations/mo · cost per landing page view −30%






















































National Consumer Panel — UGC-driven acquisition & paid media
CPI −30% · CPA −20%


National Debt Relief — UGC, performance creative & influencer strategy
CVR +25% · CAC −30%





New Balance — Casting, post-production & influencer marketing
7 athletes · 750k audience









































"Their transparency, attention to detail, and collaborative approach made them feel like an extension of our own team."


.webp)
.webp)


