



Brand work that shows up in the numbers.
shows up in the numbers
Performance branding is not a compromise between two teams. It is one plan where the brand work is measured and the direct response work is on-brand: memorable assets used consistently, budget split deliberately between demand creation and demand capture, and results read on lift and margin rather than on last-click. Run with your paid social, paid search and creative strategy in the same room.






Tell us a little about your brand and we'll be in touch within 24 hours to lock in a time.



THE FOUR WORKSTREAMS
Four workstreams, one plan.
one plan
Brand and performance usually fail together for the same reason: they are budgeted separately, judged on different metrics and never argued out in one room. So we set the split deliberately, build distinctive assets that both halves use, run creative at the volume paid channels require, and measure with methods that can see beyond the last click.
Budget split
Distinctive assets
Creative at volume
Measurement
Decide the ratio on purpose.
The first question is not which channel. It is how much of your money is creating demand and how much is harvesting it — and most companies have drifted heavily toward harvesting, because harvesting reports better in a weekly dashboard.
The reference point is the best-known finding in advertising effectiveness research. Analysing hundreds of campaigns, Les Binet and Peter Field's work for the IPA produced what is now called the 60:40 rule: as summarised in The Long and the Short of It, at least 60% of budget should sit in mass-reach brand-building media with long-term effects, and around 40% in sales activation. Binet himself has been clear it is a starting point rather than a law: category, growth stage and purchase cycle all move it, and a young company with no awareness sits in a different place than an established brand defending share.
We model your split from your own data — brand search trend, share of category demand, new versus returning revenue, pipeline lag — and write it down as a decision with a review date, not a default.
- Current demand creation and capture split measured, not assumed
- Target ratio modelled from your category, stage and cycle
- The split written down as a decision with a review date
- Both halves reported in one place, on one set of definitions
60:40
brand to activation starting ratio (Binet and Field, IPA)
700+
brands analysed in the underlying effectiveness study
Be recognised before you are read.
Brand growth depends on being noticed and remembered by people who are not buying yet, and that is carried by distinctive assets rather than by positioning statements. A colour, a shape, a character, a phrase, a sonic signature, a framing device — used relentlessly enough that your work is attributable in three seconds without the logo.
We audit what you already own, test which cues people actually associate with you rather than which ones the brand book prefers, and then codify the small set worth defending. Consistency is the mechanism: reinventing the look each quarter resets memory and quietly makes every media pound work harder for less. Distinctiveness is also what makes performance creative cheaper, because a strong asset system means a new ad inherits recognition instead of buying it again.
Then we write the rules down, so the next agency, freelancer or in-house designer extends the system rather than starting over.
- Existing assets audited for real recognition, not preference
- A small defended set: colour, shape, phrase, character, sound
- Attribution tested at three seconds with the logo removed
- Rules documented so anyone can extend the system
3 sec
attribution test we run with the logo removed
One idea, disciplined variation.
Brand campaigns traditionally produce one film a year. Paid platforms consume creative continuously, and the two cadences have to be reconciled or the brand work never reaches the channels doing the selling.
Motion's 2026 benchmarks show advertisers launching an average of 2.8 new creatives a week under $10,000 monthly spend, 6.6 at $50,000-$200,000 and 18.8 above $1m. So we build campaigns as systems: a small number of strong ideas, then disciplined variation in hooks, formats, lengths, offers and end frames, all carrying the same distinctive assets. That gives the platforms the volume they need without fragmenting the brand into forty unrelated looks.
Every asset is built for its placement rather than cropped into it: vertical, square and landscape framed separately, captions built in, and the brand cue present in the first second where the platform allows. The same creative feeds broadcast, out of home and organic without a second production cycle.
- Few ideas, many disciplined variants carrying the same cues
- Framed per placement, captioned, brand cue in the opening second
- Production planned against the volume your spend tier needs
- One asset library feeding paid, organic and offline
2.8
creatives launched weekly under $10K monthly spend
18.8
creatives launched weekly above $1m monthly spend
Measure the half that last-click cannot see.
Last-click attribution systematically overpays for capture and underpays for creation, which is how budgets drift short-term without anyone deciding to. So we measure the two halves differently and report them together: platform data and cost per acquisition for activation, and geographic or holdout testing, branded search trend, share of category demand and blended efficiency for brand work.
Incrementality testing settles the arguments that dashboards cannot. It also produces uncomfortable, useful findings — Haus, which runs these experiments for a living, reports that 82% of brands facing heavy competition on their own brand terms measured significant lift from branded search, against just 35% of brands under low competitive pressure. The same spend is essential in one situation and largely redundant in another, and only a test tells you which you are in.
Downstream matters too: the median landing page in Unbounce's benchmark study converts at 6.6%, so we treat the destination as part of the media plan rather than someone else's problem.
- Geographic and holdout tests to size real incremental effect
- Brand search trend and share of category demand tracked monthly
- Blended efficiency reported next to platform numbers
- Destination pages treated as part of the plan
82%
of brands under heavy brand-term competition saw real lift
35%
the same figure for brands facing low competition
performance marketing services market in 2026 (Mordor)
annual growth rate through 2031 (Mordor)
Lift measured with holdouts before budget moves
The asset system, creative files and models
We made the difference for those brands

Consumer tech and platforms

Healthcare & regulated services

Consumer tech and platforms
Retail & commerce

Beauty, personal care & wellness

Retail & commerce

B2B software, fintech, insurance

Creative, content, arts & culture

Apparel and lifestyle

B2B software, fintech, insurance

Consumer tech and platforms

Home essentials, appliances, kitchen & pet

Home essentials, appliances, kitchen & pet

Food & beverage

B2B software, fintech, insurance

B2B software, fintech, insurance

B2B software, fintech, insurance

B2B software, fintech, insurance

Travel & mobility

Beauty, personal care & wellness

B2B software, fintech, insurance

Food & beverage

Retail & commerce
Consumer tech and platforms

Consumer tech and platforms

Healthcare & regulated services

B2B software, fintech, insurance

Apparel and lifestyle

Retail & commerce

Home essentials, appliances, kitchen & pet

B2B software, fintech, insurance
01 — The challenge
Two teams, two dashboards, one drifting budget.
The performance team reports a respectable cost per acquisition and quietly relies on people who already know you. The brand team runs a campaign a year that the paid channels never use. Nobody owns the middle, so budget follows whatever reports fastest, and after two years of that the cheap demand runs out and everything gets more expensive at once.
“Our cost per acquisition looks fine. Growth stopped anyway.”
This is the pattern the effectiveness research describes. Binet and Field's analysis argues at least 60% of budget belongs in mass-reach brand-building media, with roughly 40% in activation — the reverse of where most dashboards push the money. Fixing it is a planning and measurement decision, taken once and reviewed on a schedule.
02 — Our approach
Set the split, build the assets, prove the lift.
We start by measuring what your budget is actually doing: how much creates demand, how much captures it, and how much of your revenue comes from people who already knew you. Then we model a deliberate split from your own data — brand search trend, share of category demand, new versus returning revenue, purchase cycle length — and write it down as a decision with a review date rather than inheriting a default. Next we audit your distinctive assets for real recognition rather than internal preference, keep a small set worth defending, and document the rules so anyone can extend them. Creative is then built as a system: a few strong ideas with disciplined variation in hooks, lengths, formats and offers, framed per placement and captioned, at the volume your spend tier actually consumes. Measurement runs on two tracks reported in one place — platform numbers for activation, and geographic or holdout tests, brand search trend and blended efficiency for the brand half — with the destination pages treated as part of the plan. You get one monthly review covering both halves with the same definitions.
03 — What we did
Four phases, then one plan the whole team reads.
Diagnosis, asset work, creative build and testing run in sequence, with a weekly working session and one written monthly review covering both halves.
Weeks 1-3 / Diagnosis
Measure the split you actually have
Spend classified into demand creation and capture, brand search and category demand trended, and returning-customer reliance quantified.

Weeks 2-5 / Assets
Keep the cues people recognise
Distinctive assets tested for attribution without the logo, the defended set agreed, and the rules written down for everyone who uses them.

Weeks 4-8 / Creative
Produce at the cadence media needs
A few strong ideas built as a system, varied across hooks, lengths and formats, framed per placement and carrying the same cues.

Ongoing / Proof
Test the lift, then move budget
Geographic and holdout tests sized, brand demand tracked monthly, and budget moved on measured lift rather than on last-click.

WHAT YOU GET
Deliverables you keep.
you keep
Every model, asset system, creative file and test design below is documented and yours, whether we keep working together or not.

Budget split model
Your current demand creation and capture split measured, with a target ratio modelled from your own category and stage.

Distinctive asset system
The cues people genuinely associate with you, tested and codified into rules anyone in your team can apply.

Campaign creative library
A few strong ideas produced as many disciplined variants, framed per placement and carrying the same brand cues.

Media plan across both halves
One plan covering mass-reach and activation channels, with the reasoning and the cut order written down.

Incrementality test design
Geographic and holdout tests designed before spend moves, so the lift argument is settled with evidence.

One report, both halves
Brand demand, blended efficiency and platform performance in one place, plus a written monthly review.
HOW WE WORK
Operating standards, not promises.
Operating standards



















Built on trust. Proven by results.
We partner with SMBs and Fortune 500 companies to deliver more than reach — we bring clarity, execution, and measurable outcomes. Every successful partnership starts with a strong culture fit and a shared drive to grow.






CASE STUDIES
Case studies
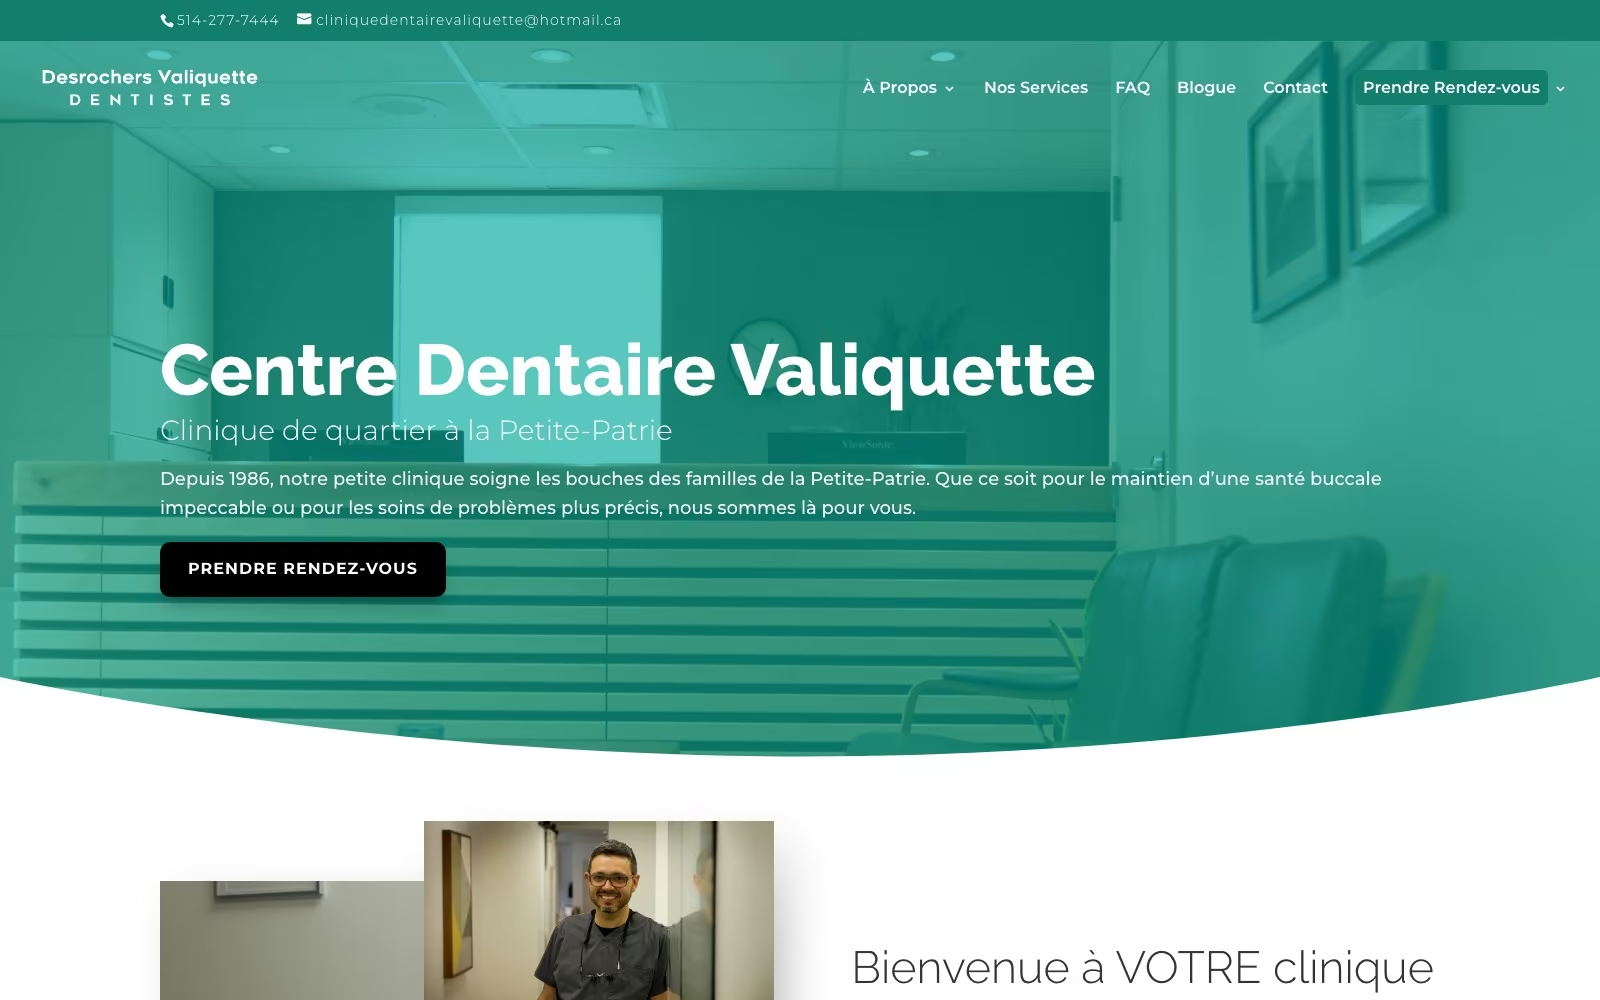
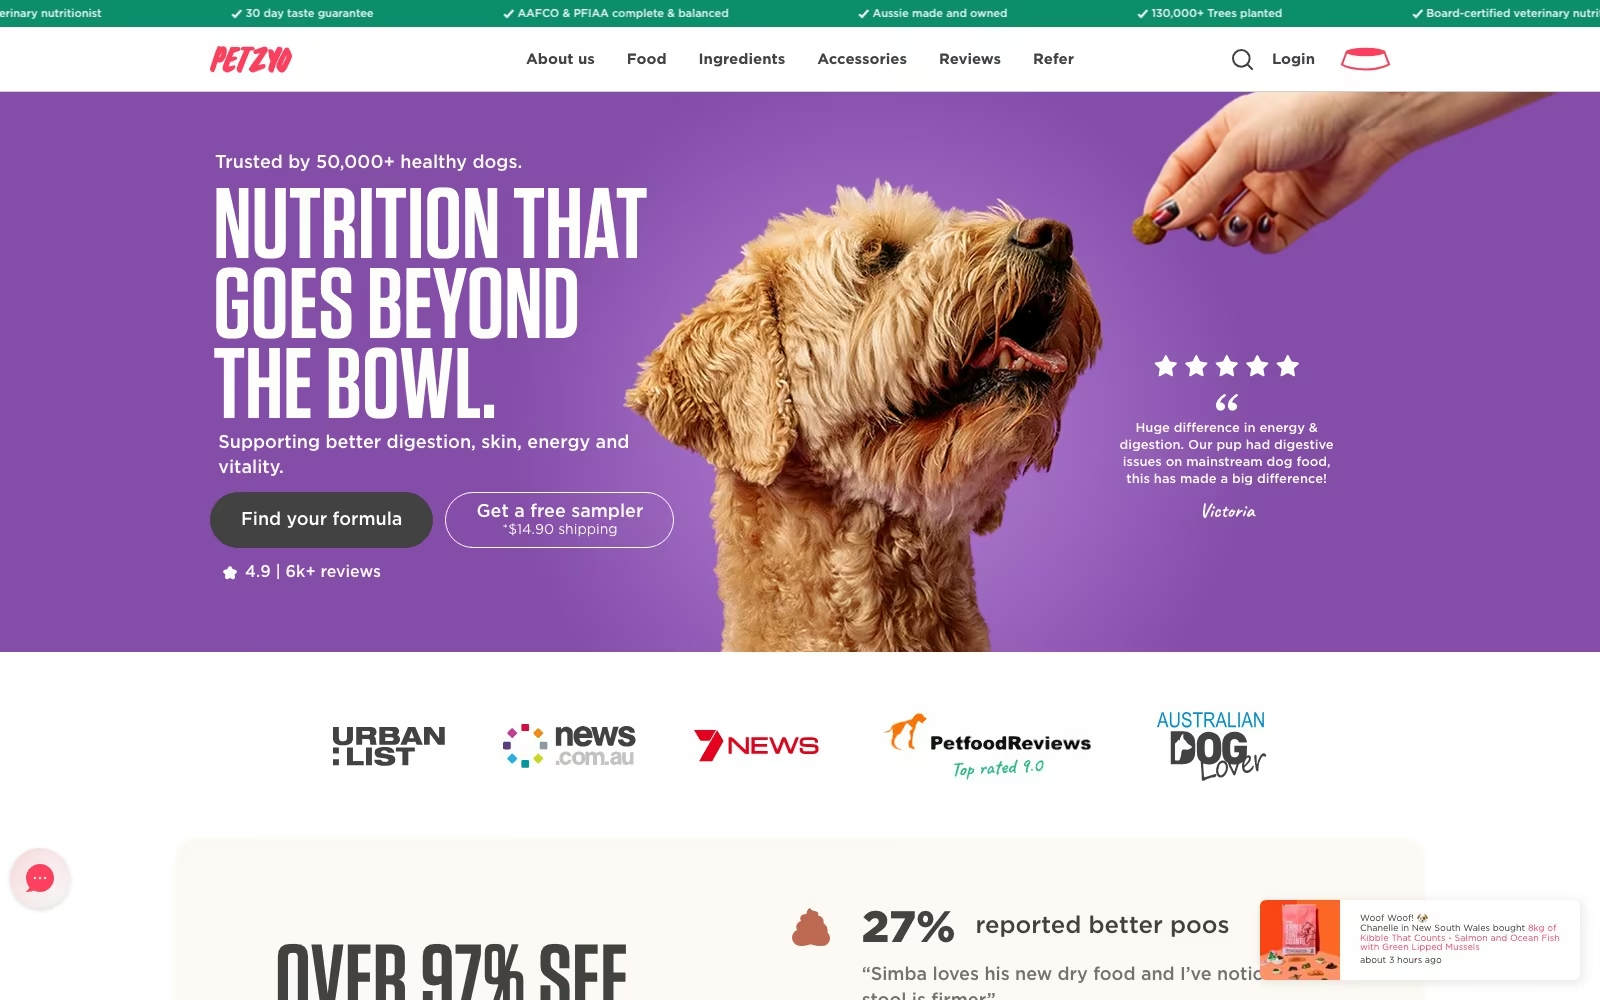
Website Portfolio
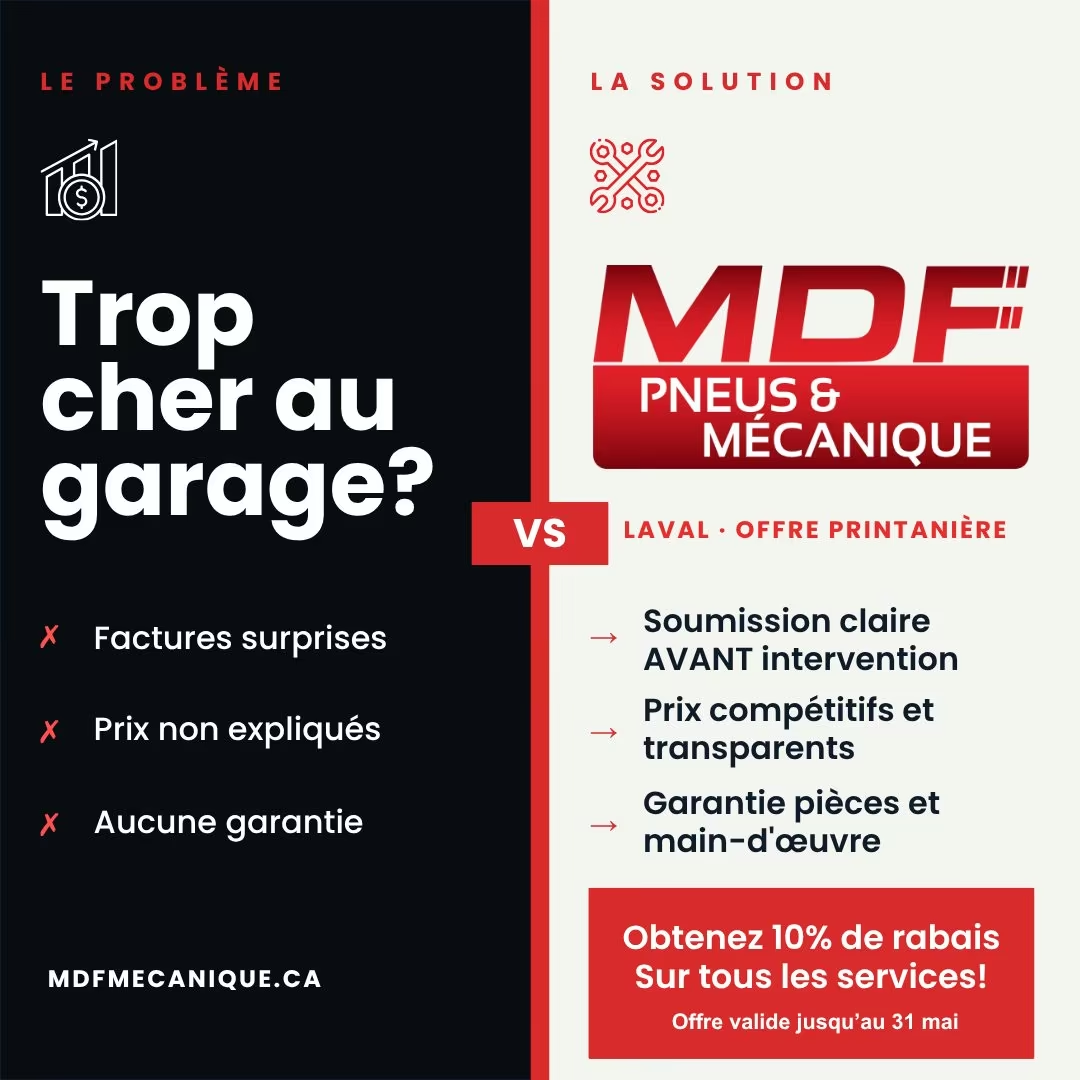
Video Ads
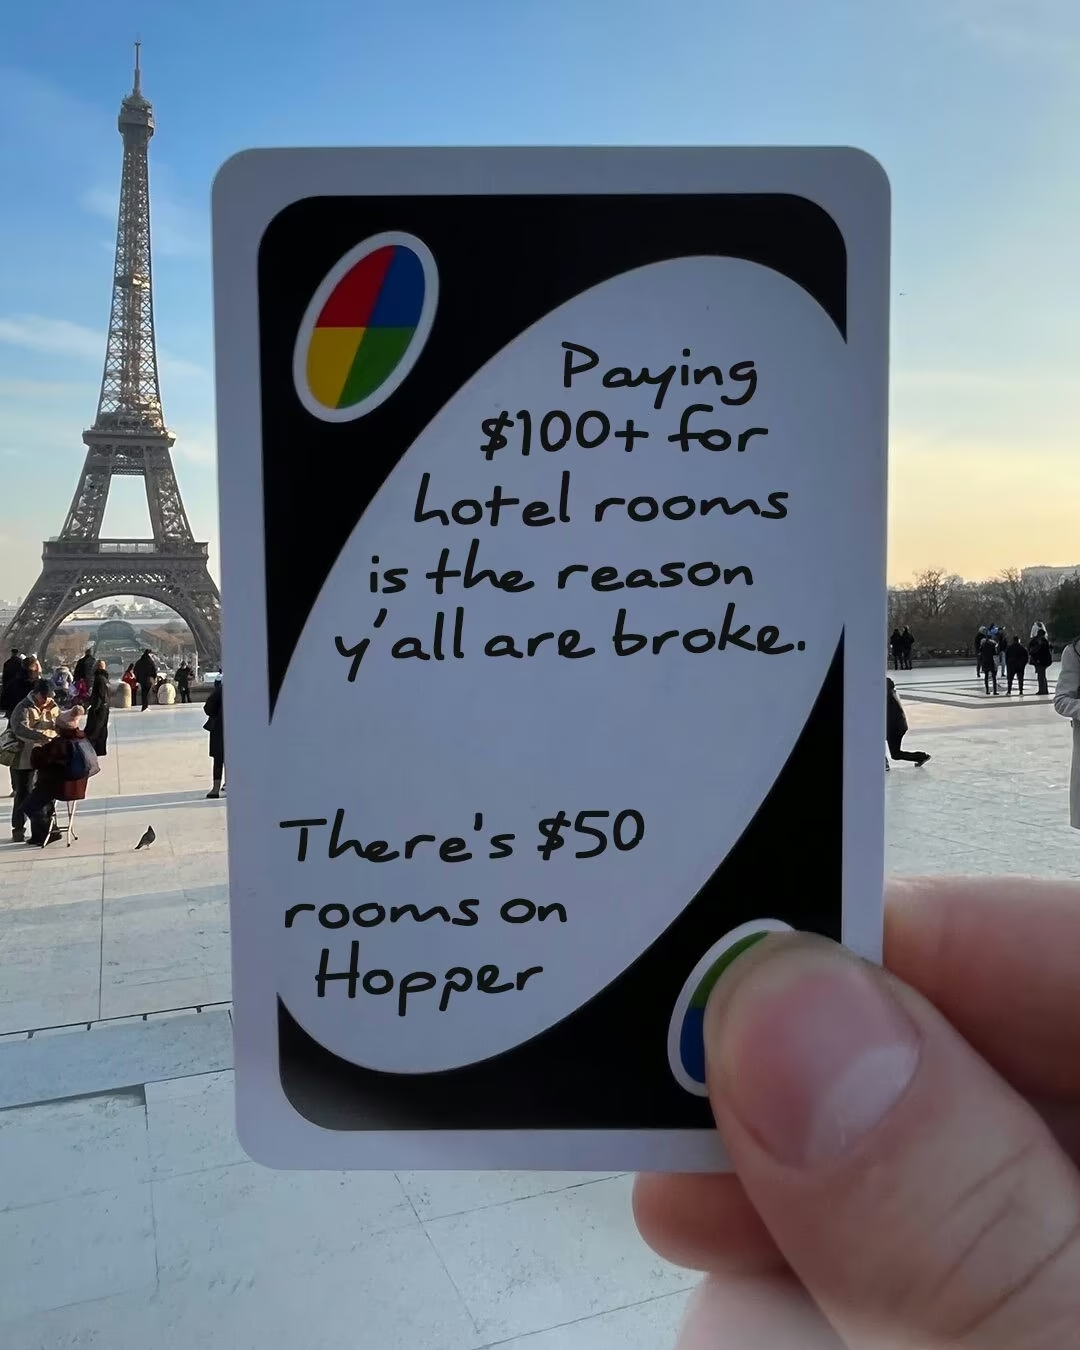
Static Ads





















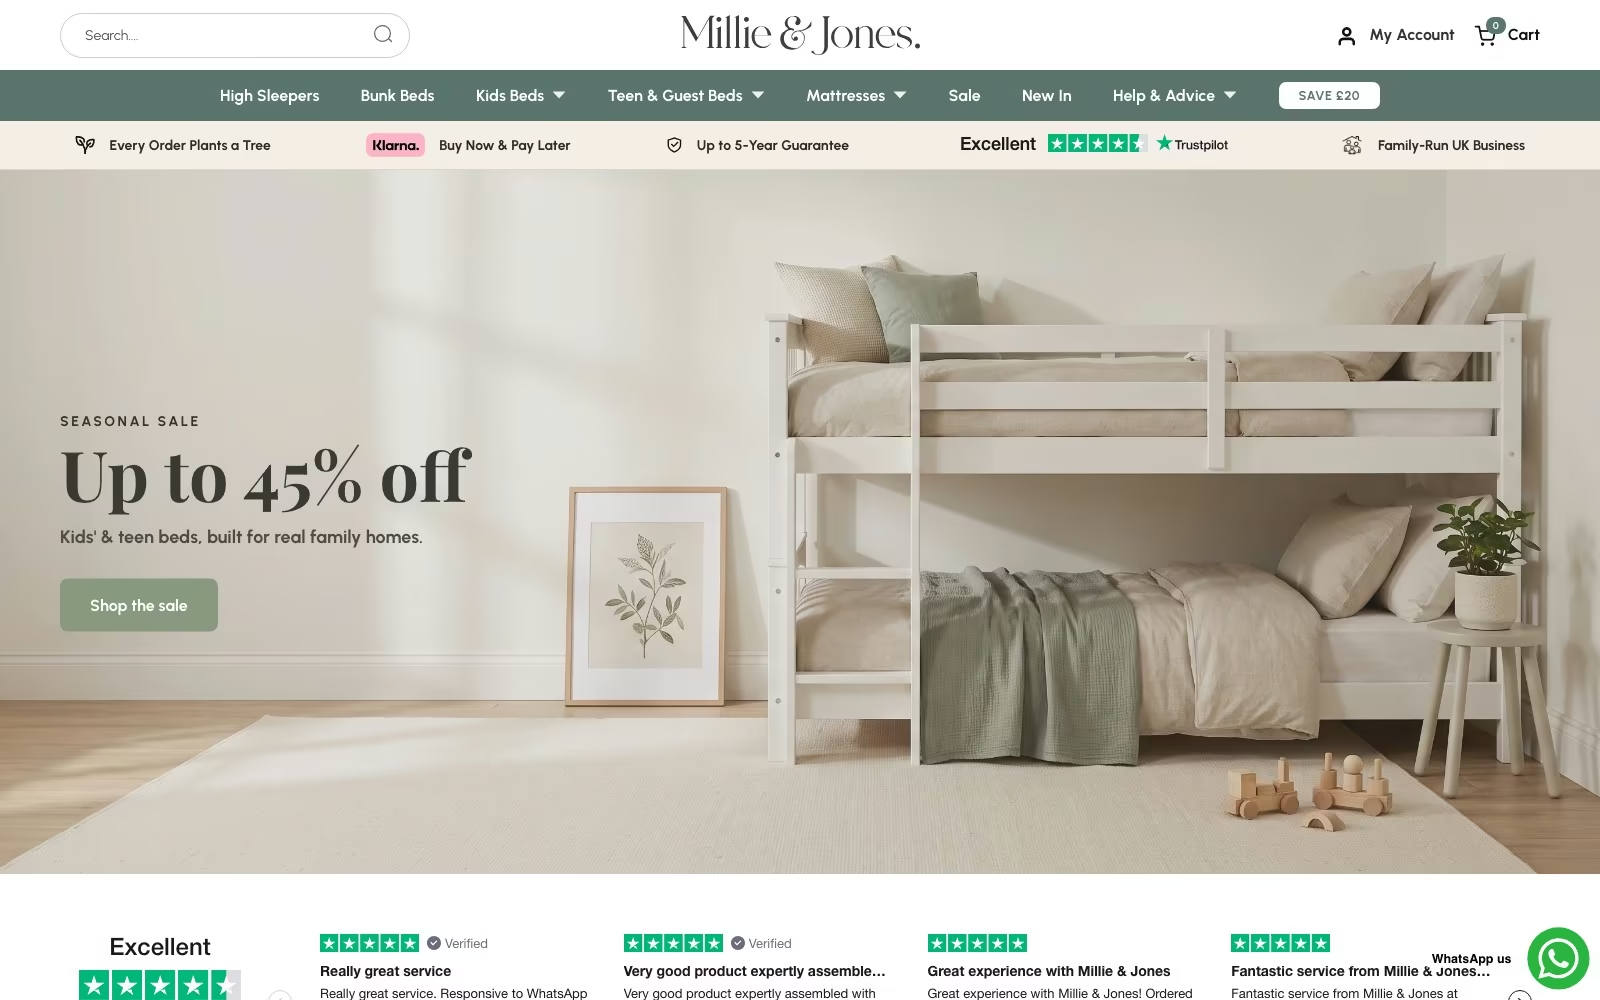

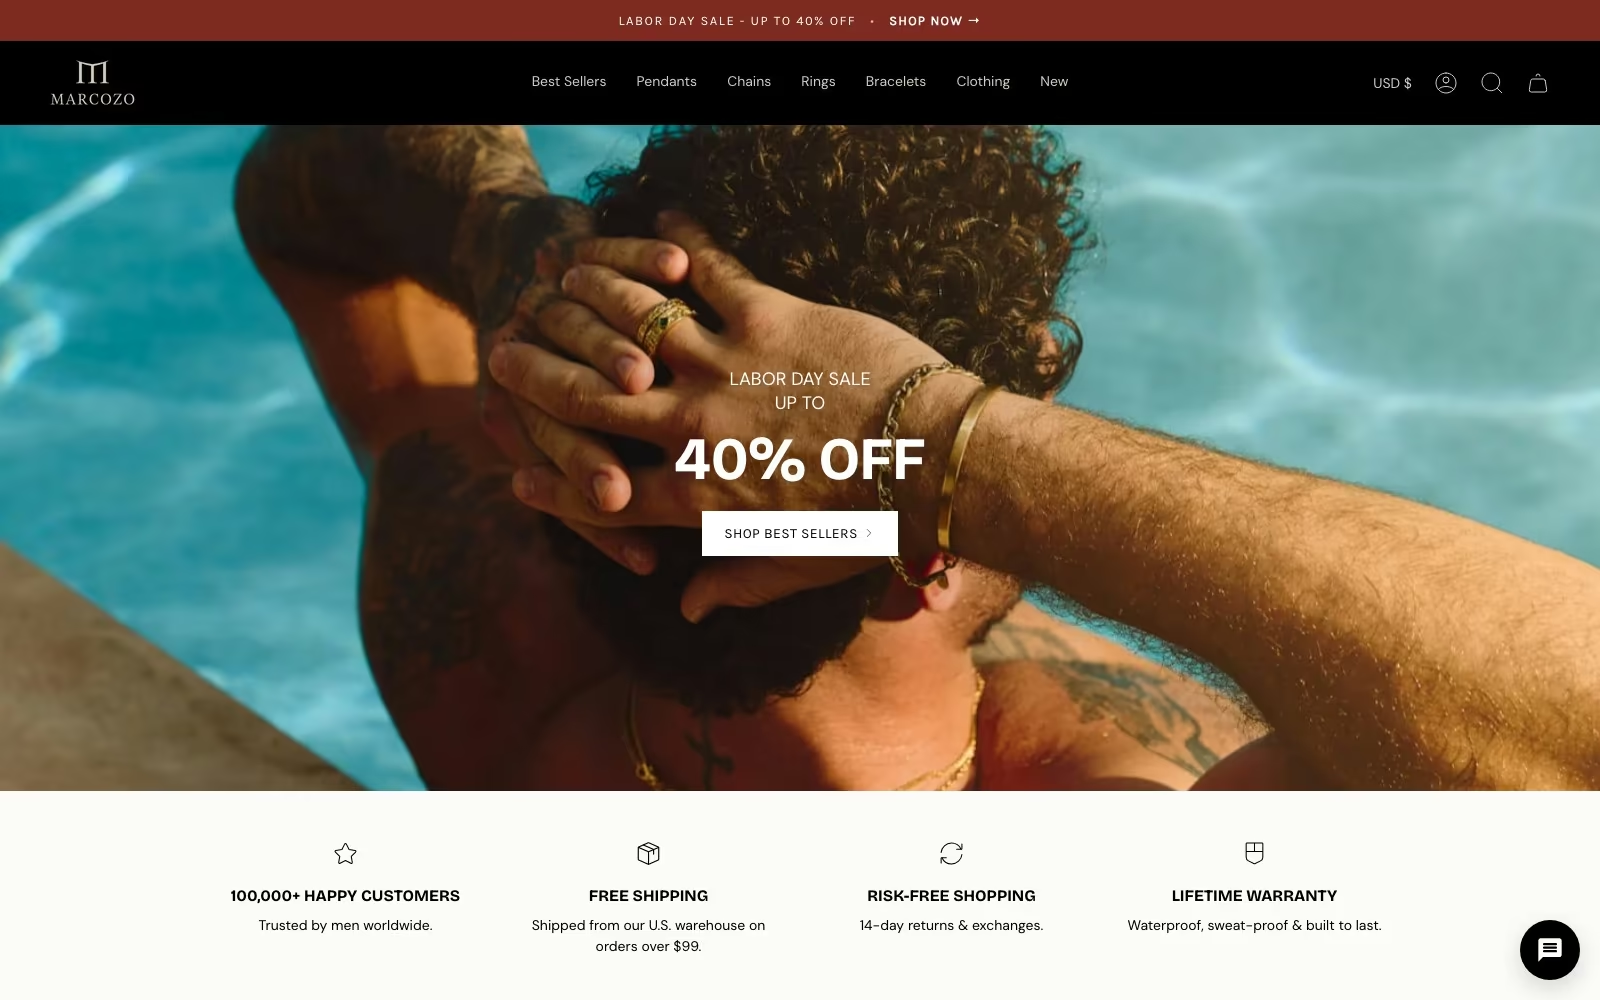

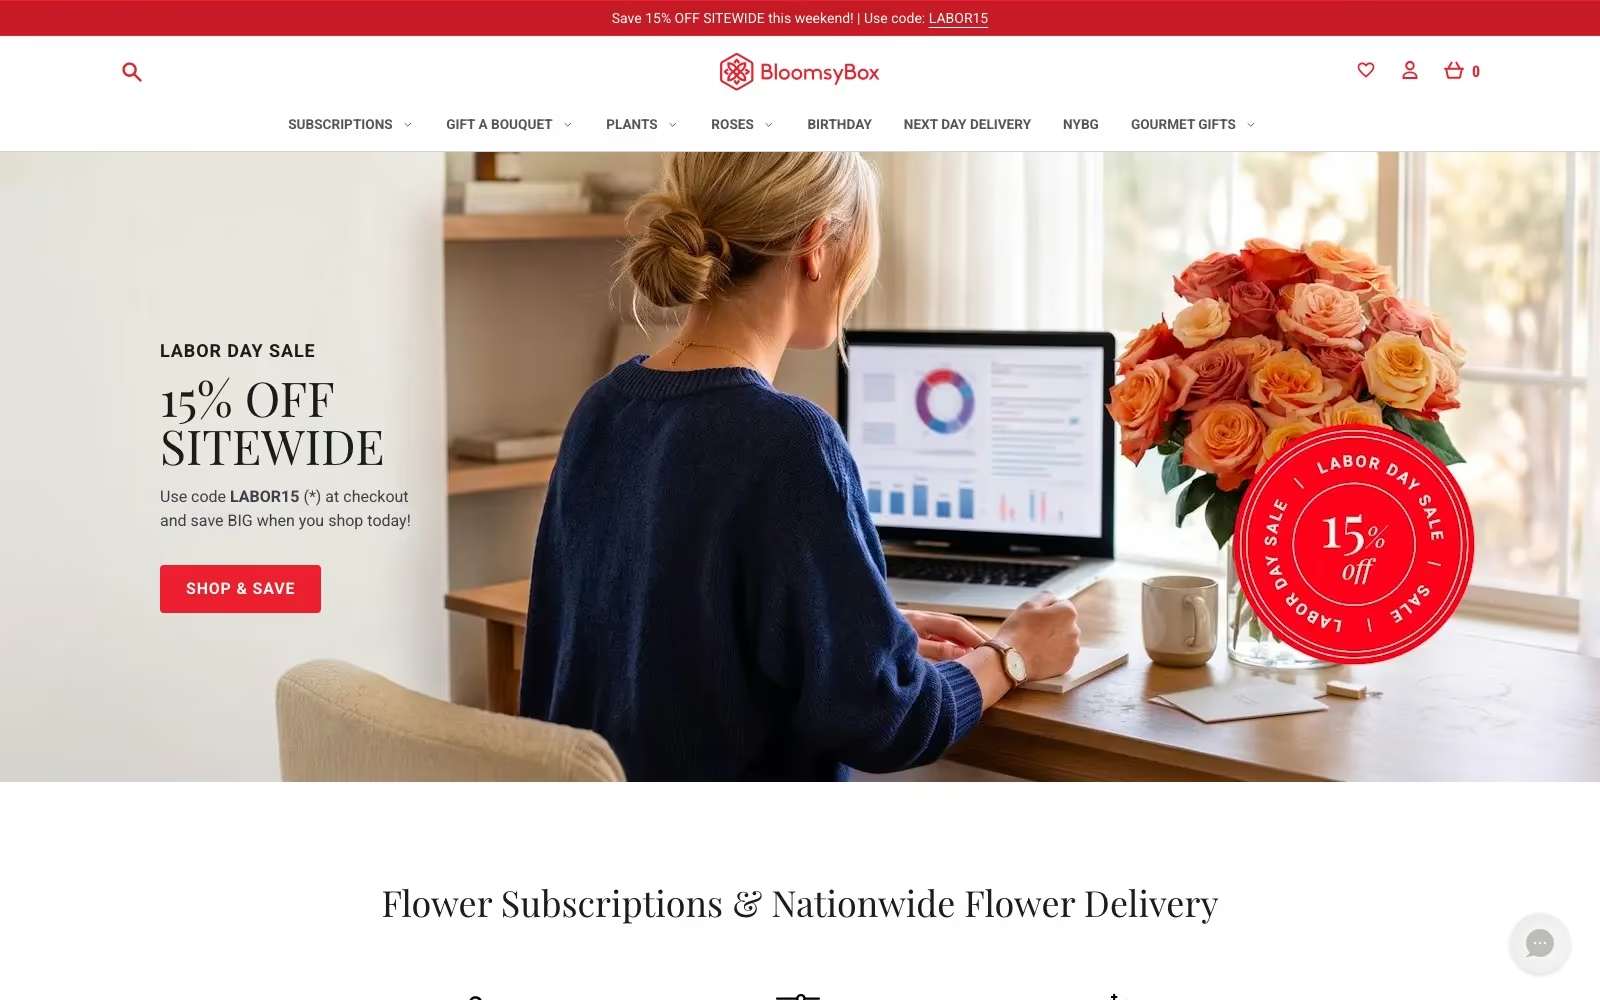



































FAQ
What teams ask us first.
What is performance branding, in plain terms?
Running brand building and direct response as one plan, with one set of definitions and one report. In practice that means three things: the budget split between creating demand and capturing it is a deliberate decision, the creative that runs in performance channels carries the same distinctive cues as the brand work, and the brand half is measured with methods that can actually see it — holdouts, geographic tests, brand search trend, blended efficiency — instead of being excused from measurement. It is not a rebrand project and it is not a media discount. It is a way of stopping the two halves of a marketing budget from competing.
How should we split budget between brand and performance?
Start from the research, then adjust to your situation. Binet and Field's analysis of hundreds of campaigns points to roughly 60% of budget in mass-reach brand-building media and 40% in sales activation, and their wider IPA work shows the ratio moves with category, brand size, growth stage and purchase cycle. Binet has said plainly that it is a guide rather than an iron rule. A young company with no awareness and a short cycle sits nearer even; a considered-purchase category with long lags sits further toward brand. We model your starting point from your own data and revisit it on a schedule.
Can brand advertising be measured properly?
Yes, just not with last-click reporting. The reliable methods are experimental: hold back matched regions or audiences, run the campaign elsewhere, and measure the difference in branded search, direct traffic, lead volume and revenue. Alongside that we trend brand search volume and share of category demand monthly, and watch blended efficiency rather than channel-level cost per acquisition. Tests routinely overturn assumptions in both directions: Haus found 82% of brands facing heavy competition on their brand terms measured significant incremental lift from branded search, versus 35% under low competitive pressure. Same tactic, opposite verdict, depending on context.
Our cost per acquisition looks healthy. Why change anything?
Because a healthy cost per acquisition can be a symptom of harvesting existing demand rather than creating new demand, and that pool has a floor. The pattern is familiar: efficiency holds for a couple of years while the brand's stored awareness is spent down, then acquisition costs rise across every channel at once and nothing in the account explains why. The diagnostic is straightforward — how much of your revenue comes from people who already knew you, and is branded search growing with the business or flat? If it is flat while spend rises, you are converting a fixed audience more efficiently, which is a good position to fix from and an uncomfortable one to ignore.
What are distinctive assets and why do they matter here?
They are the cues that make your advertising recognisable in the first second: a colour, a shape, a character, a phrase, a sound, a framing device. They matter because most people who see your advertising are not buying today, so the job is to be remembered later — and memory attaches to consistent sensory cues far more reliably than to positioning language. They also make performance creative cheaper, since a new ad inherits recognition instead of paying for it again. We test which cues people actually associate with you, keep the small set that earns its place, and document the rules so consistency survives staff changes and new agencies.
How much creative volume does this take?
More than a traditional brand campaign and fewer separate ideas than people fear. Motion's 2026 benchmarks show average weekly creative output rising from 2.8 new creatives under $10,000 monthly spend to 6.6 at $50,000-$200,000 and 18.8 above $1m. The way to hit that without fragmenting the brand is disciplined variation: a handful of strong ideas, then variants on hooks, lengths, formats, offers and end frames, all carrying the same cues. That is a production planning decision made once, and it costs far less than commissioning fresh concepts at the same cadence.
Which channels count as brand building?
Any channel bought for reach and memory rather than immediate response — television and connected television, online video, audio, out of home, sponsorships, and broad reach buys on social platforms. Channels bought for capture are search, shopping, retargeting and comparison. The useful distinction is intent, not medium: the same platform can serve either purpose depending on how it is bought and judged, which is why we classify spend by job rather than by channel name. That classification is usually the first genuinely surprising output of the diagnosis.
How long before we see results?
Two clocks, and we report both. Activation changes — creative, structure, bidding, landing pages — read within weeks. Brand effects build over quarters and keep paying afterwards, which is exactly why they get cut in companies that only look at monthly dashboards. Rather than asking you to wait on faith, we use holdout and geographic tests to get an early, honest read on the brand half, and we set expectations for each half separately in writing. If a brand investment is not showing measurable lift by the read date we agreed, we say so and change the plan.
Do you handle the creative or just the strategy?
Both, and we would rather do both because the split between them is where most of this work leaks. Strategy covers the diagnosis, the budget split, the asset system and the measurement design; production covers the campaign ideas, the variants, motion graphics, static assets and the formats each placement needs. If you have an in-house studio or a creative agency you rate, we will set the system and the briefs and let them produce — the deliverables are documented for exactly that. What we would not recommend is a strategy nobody is accountable for turning into ads.
Can you run the media as well?
Yes. Our paid social, paid search and creative strategy teams work from the same plan and the same measurement, which shortens the loop between a test result and a budget change. It is equally workable for us to set the strategy, the asset system and the test design while your existing agencies buy the media — we share the models and the reads with them, because incrementality testing only works when everyone agrees not to touch the control group halfway through.

.webp)
.webp)


