



Same traffic. More customers.
More customers
We are the CRO agency for teams who have stopped believing in best-practice lists. We find out where your buyers hesitate, form hypotheses that name a cause, test them properly, and ship the winners into the site with our development team — so the media you already buy through paid search and paid social produces more revenue without a bigger budget.






Tell us a little about your brand and we'll be in touch within 24 hours to lock in a time.



THE FOUR STAGES
Diagnose, hypothesise, test, then keep the win.
keep the win
Research first, always. A test list assembled from other people's case studies is how programmes end up with a flat quarter and a folder of inconclusive results. We test what the evidence says is broken, in the order the money says matters.
Research & diagnosis
Hypotheses & prioritisation
Experimentation & build
Shipping & compounding
Find where buyers actually hesitate.
The starting point is knowing what normal looks like. Unbounce's benchmark across 41,000 landing pages, 464 million pageviews and 57 million conversions found a median conversion rate of 6.6%, with industry medians ranging from 3.8% to 12.3% — so “good” depends entirely on your category, and a number in isolation is not a diagnosis.
Then we look for the leak. Funnel analysis by step, device and traffic source to find where value drops out. Session recordings and heatmaps on the pages that carry revenue. Form and checkout field analysis, which almost always surfaces something embarrassing. On-site polls and exit surveys for intent we cannot infer. Reviews, support tickets and sales calls for the objection nobody put on the page. Technical checks too, because speed is a conversion factor: Deloitte measured a 0.1s mobile improvement worth 8.4% in retail conversion rate and 21.6% in lead-generation form submissions.
The output is a prioritised list of friction points with evidence attached to each, and an estimate of what fixing it is worth.
- Funnel analysis by step, device and traffic source
- Session recordings, heatmaps and form field analysis
- Polls, surveys, reviews and sales calls for real objections
- Speed and technical checks on revenue pages
- Friction points prioritised by value, with evidence attached
6.6%
median landing page conversion rate across 41,000 pages
3.8-12.3%
range of industry medians, so context decides what is good
Name the cause before building the test.
A hypothesis is not “try a green button”. It is a statement with a cause, a mechanism and a predicted effect: buyers on this step abandon because delivery cost appears late, so showing it earlier will raise step completion. That format is what lets a losing test still teach you something, and it stops the programme becoming a shopping list of other companies' redesigns.
Prioritisation is where most value is won or lost. We score each hypothesis on the traffic and revenue exposed to it, the strength of the evidence behind it, the size of the expected effect and the effort to build it, then sequence deliberately. High-traffic revenue steps first; clever ideas on low-traffic pages last, however appealing they are. Where traffic cannot support a test we say so and ship the change as a considered improvement instead of pretending to measure it.
The roadmap is visible to you, and reordered as evidence changes rather than defended for the sake of the plan.
- Every test states a cause, mechanism and predicted effect
- Scored on exposed revenue, evidence strength, effect and effort
- High-value funnel steps sequenced first
- Low-traffic pages improved by judgment, not fake tests
Cause first
no test enters the roadmap without a stated mechanism
58%
of companies have no clear test prioritisation framework (Speero)
Tests built well and called honestly.
Execution decides whether the result means anything. We calculate the sample and duration before launching, run full business cycles so weekday and payday effects wash out, avoid flicker by building variants properly rather than hiding them with a script, validate that tracking fires for both variants, and refuse to call a test early because it looks good on day three.
Expectations are set by the data, not by case studies. VWO's 2026 experimentation benchmark shows call-to-action copy as the most-tested element, around 3,500 tests, at roughly a 10% win rate — which is a useful corrective: most tests do not win, so the programme has to be judged on cumulative learning and shipped winners rather than on any single experiment. We report losers as clearly as winners, because a disproved assumption is worth money too.
Segment analysis comes after the headline result, never instead of it, and we are explicit when a segment finding is a hypothesis rather than a conclusion.
- Sample size and duration calculated before launch
- Full business cycles, no early calls
- Variants built properly so there is no flicker
- Tracking validated for both variants before traffic
- Losers reported as clearly as winners
~10%
win rate on the most-tested element in VWO's benchmark
~3,500
tests on call-to-action copy in that dataset
A win is not a win until it is live.
The most common failure in CRO is a winning variant that never becomes permanent code. We build winners into the site properly — not left running in the testing tool where a script injects your revenue — then re-verify performance after deployment and keep the experiment log so the same idea is not retested in a year by someone new.
Programmes compound when the learning outlives the test. Each win feeds the design system, the ad creative and the messaging, which is why we work closely with our creative strategy and web design teams. Performance work belongs here too, since site speed is a conversion input rather than an engineering vanity metric: T-Mobile's programme reported a 20% reduction in user-reported site issues and a 60% improvement in visit-to-order rate.
Measurement is validated by our analytics team, so a lift in the testing tool also shows up in the numbers your finance team uses.
- Winners built into the codebase, not left in the testing tool
- Post-deployment performance re-verified
- Experiment log kept so learning outlives the test
- Wins fed back into design, creative and messaging
60%
visit-to-order improvement in Google's T-Mobile case study
48%
of cart abandonments are caused by shipping costs (Baymard)
average Google Ads conversion rate (WordStream)
mobile conversion vs 5.06% desktop (Dynamic Yield)
Sample and duration calculated before any test launches
The tools, the code and the experiment log
We made the difference for those brands

Beauty, personal care & wellness

Consumer tech and platforms

Retail & commerce

Consumer tech and platforms
Retail & commerce

Food & beverage

Travel & mobility

Home essentials, appliances, kitchen & pet

B2B software, fintech, insurance

Beauty, personal care & wellness

Apparel and lifestyle

Healthcare & regulated services

Consumer tech and platforms

Beauty, personal care & wellness

B2B software, fintech, insurance

Home essentials, appliances, kitchen & pet

Beauty, personal care & wellness

Consumer tech and platforms

Consumer tech and platforms

B2B software, fintech, insurance

Apparel and lifestyle

Retail & commerce

Creative, content, arts & culture

Creative, content, arts & culture

Healthcare & regulated services

Apparel and lifestyle

Food & beverage

B2B software, fintech, insurance

Food & beverage

B2B software, fintech, insurance

Creative, content, arts & culture
01 — The challenge
Traffic is up. Revenue is not.
Acquisition costs keep climbing, so every extra sale costs more than the last one. Meanwhile the checkout leaks on mobile, the form asks for a phone number nobody wants to give, and the last redesign was decided in a meeting rather than by evidence.
“We are buying more visitors to hide a conversion problem.”
Fixing the site is the cheaper half of growth, and it is measurable. Unbounce's benchmark of 41,000 landing pages puts the median conversion rate at 6.6% with industry medians spanning 3.8% to 12.3%, which means the honest question is not whether your rate is good but where in your funnel value is leaving. That is answerable with research, and once answered it stays answered — unlike a bid strategy.
02 — Our approach
Evidence, hypothesis, honest test, shipped code.
We begin with research rather than a test list: funnel analysis by step, device and source; session recordings and heatmaps on the pages that carry revenue; form and checkout field analysis; polls and surveys for intent; and reviews, tickets and sales calls for the objections nobody put on the page. Speed gets checked too, because it is a conversion input. Each friction point becomes a hypothesis naming a cause and a predicted effect, scored on exposed revenue, evidence, expected size and effort. Tests are sized before launch, run for full business cycles, built without flicker and never called early. Winners are built into the codebase and re-verified, losers are reported plainly, and everything goes into an experiment log you own.
03 — What we did
Four stages, compounding conversion gains.
Diagnosis, roadmap, testing and shipping run as a loop, with a weekly working session and a monthly written read of results and what they proved.
Weeks 1-3 / Diagnosis
Find the leaks with evidence
Funnel, recordings, heatmaps, form analysis, surveys and speed checks combined into a prioritised list of friction points with the value of fixing each.

Week 3 / Roadmap
Turn friction into testable hypotheses
Each hypothesis names a cause, mechanism and predicted effect, then is scored on exposed revenue, evidence strength, expected size and build effort.

Ongoing / Testing
Run tests that can be believed
Sample and duration calculated up front, variants built without flicker, tracking validated, full business cycles run and no early calls.

Ongoing / Shipping
Ship winners and keep the learning
Winning variants built into the codebase and re-verified live, losers documented, and every result logged so the programme compounds.

WHAT YOU GET
Deliverables that outlive the engagement.
outlive the engagement
Everything is built in your own tools and codebase, documented as we go, and yours to keep.

Conversion research and audit
Funnel, recordings, heatmaps, form analysis, surveys and speed checks combined into prioritised friction points with evidence attached.

Hypothesis roadmap
Every test written as a cause and predicted effect, scored on exposed revenue, evidence, expected size and build effort.

Test design and build
Variants built properly to avoid flicker, with sample size and duration calculated before a single visitor sees them.

Result analysis and readouts
Honest calls on winners and losers with segment analysis after the headline, and the assumptions stated rather than hidden.

Implementation of winners
Winning variants built into your codebase and re-verified live, instead of left running inside a testing tool indefinitely.

Experiment log and playbook
A living record of what was tested, proved and disproved, so the next team does not repeat a year of work by accident.
HOW WE WORK
Operating standards, not promises.
Operating standards


















Built on trust. Proven by results.
We partner with SMBs and Fortune 500 companies to deliver more than reach — we bring clarity, execution, and measurable outcomes. Every successful partnership starts with a strong culture fit and a shared drive to grow.






CASE STUDIES
Case studies
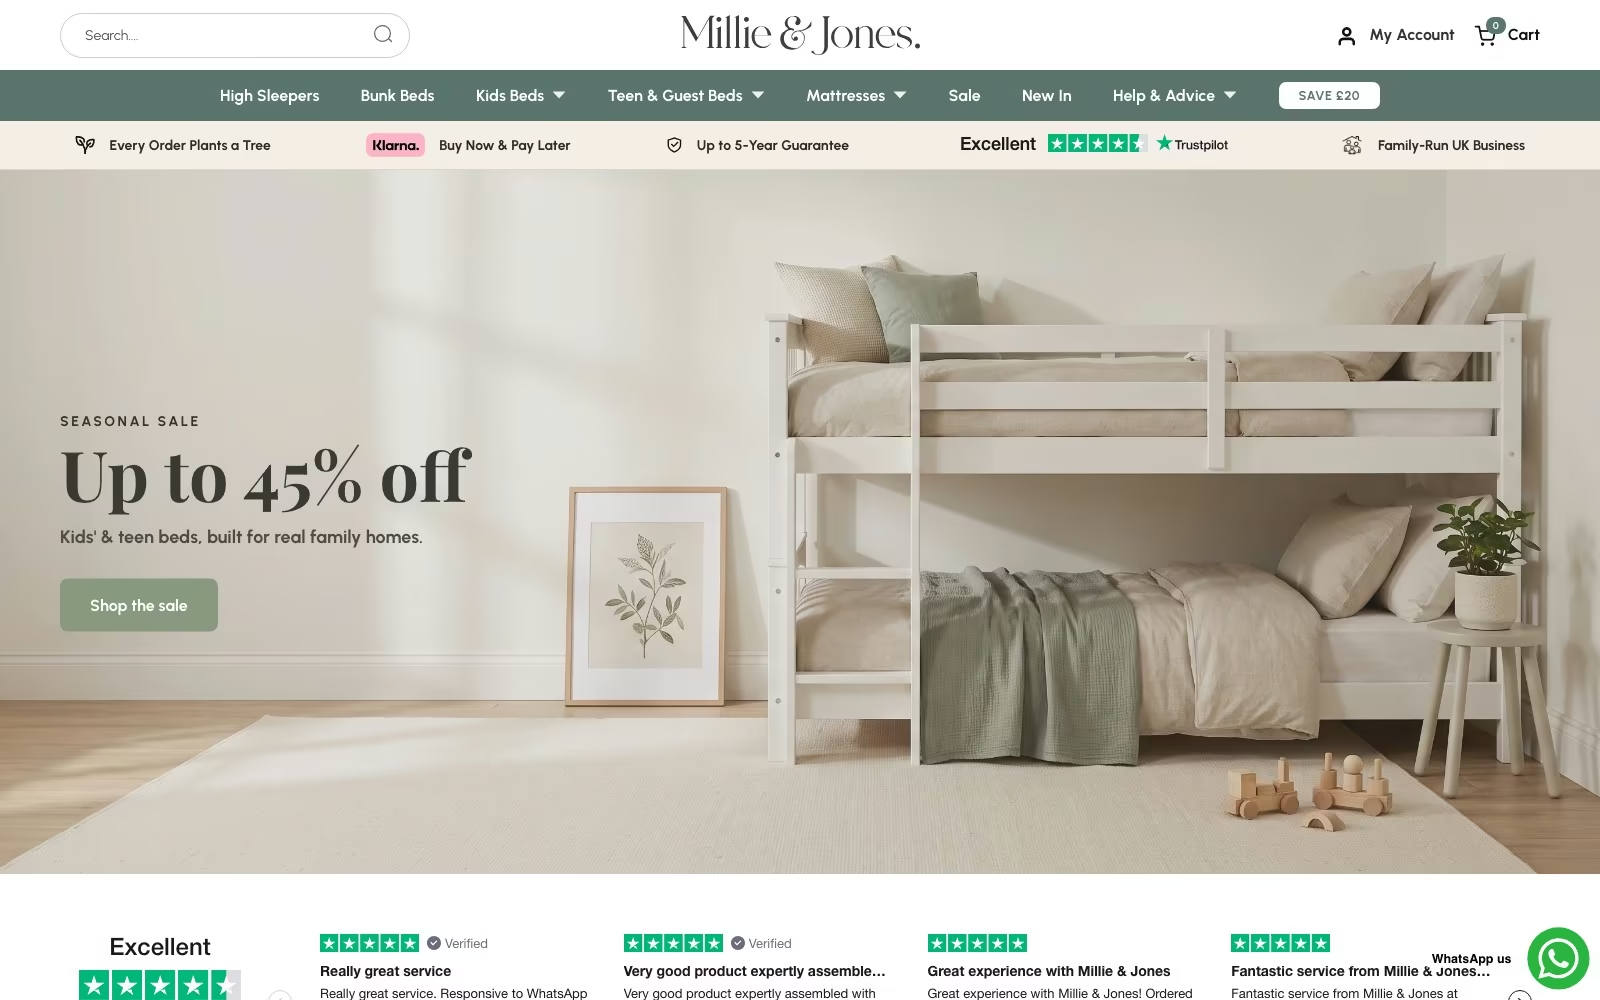
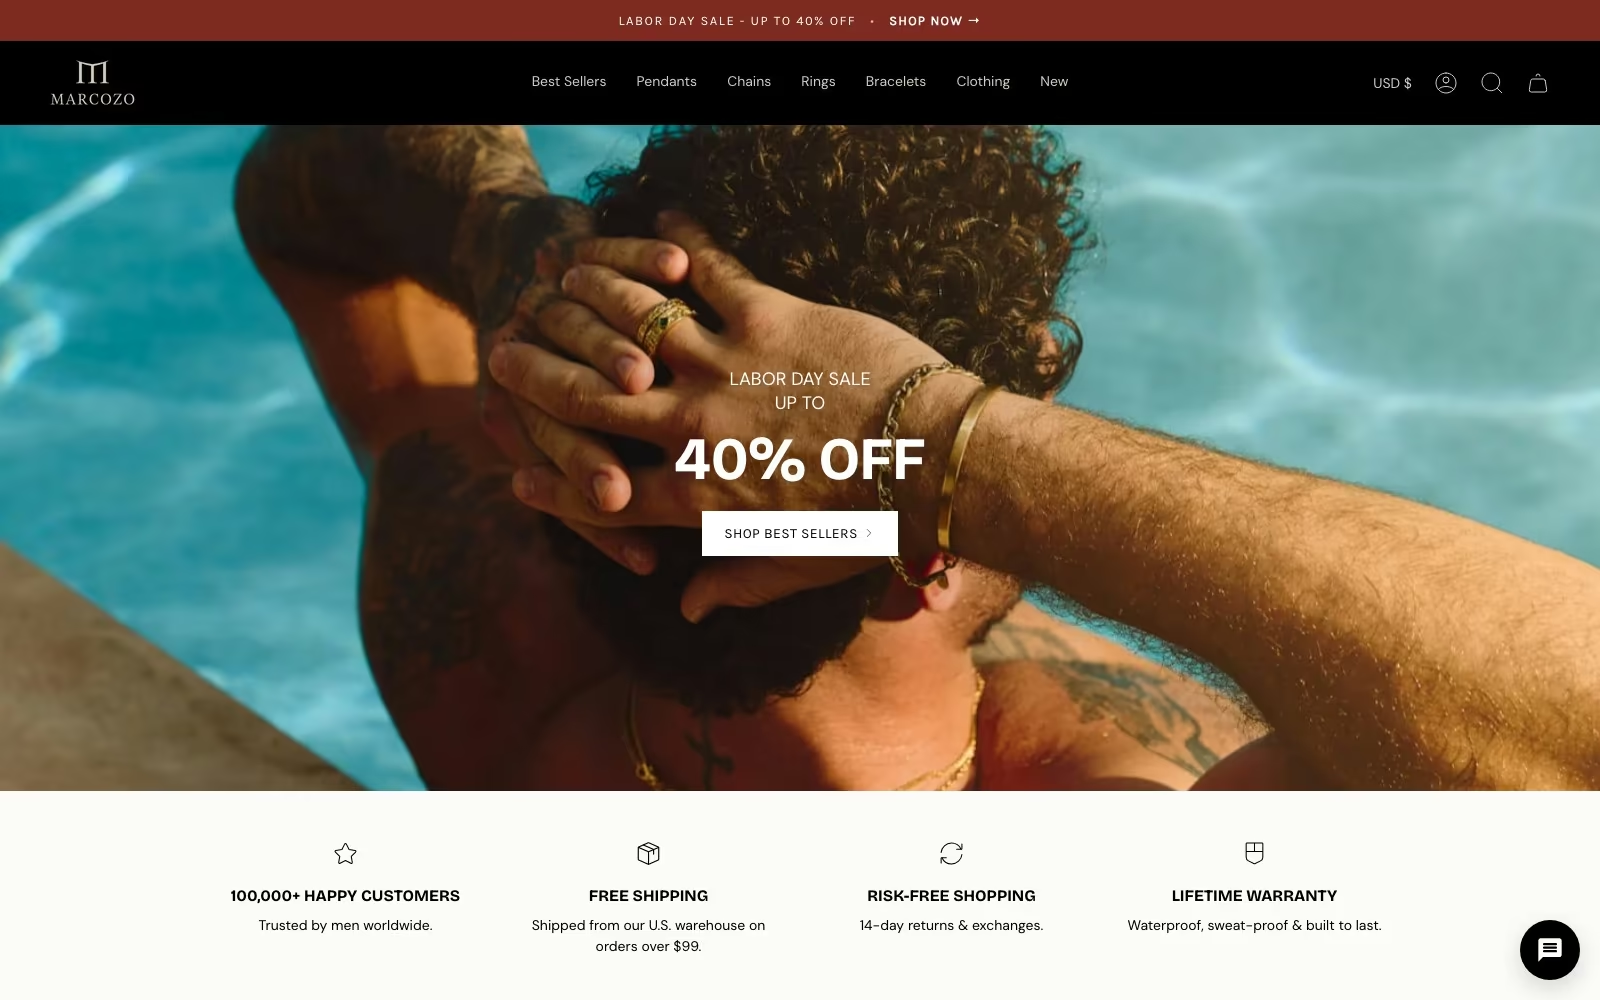
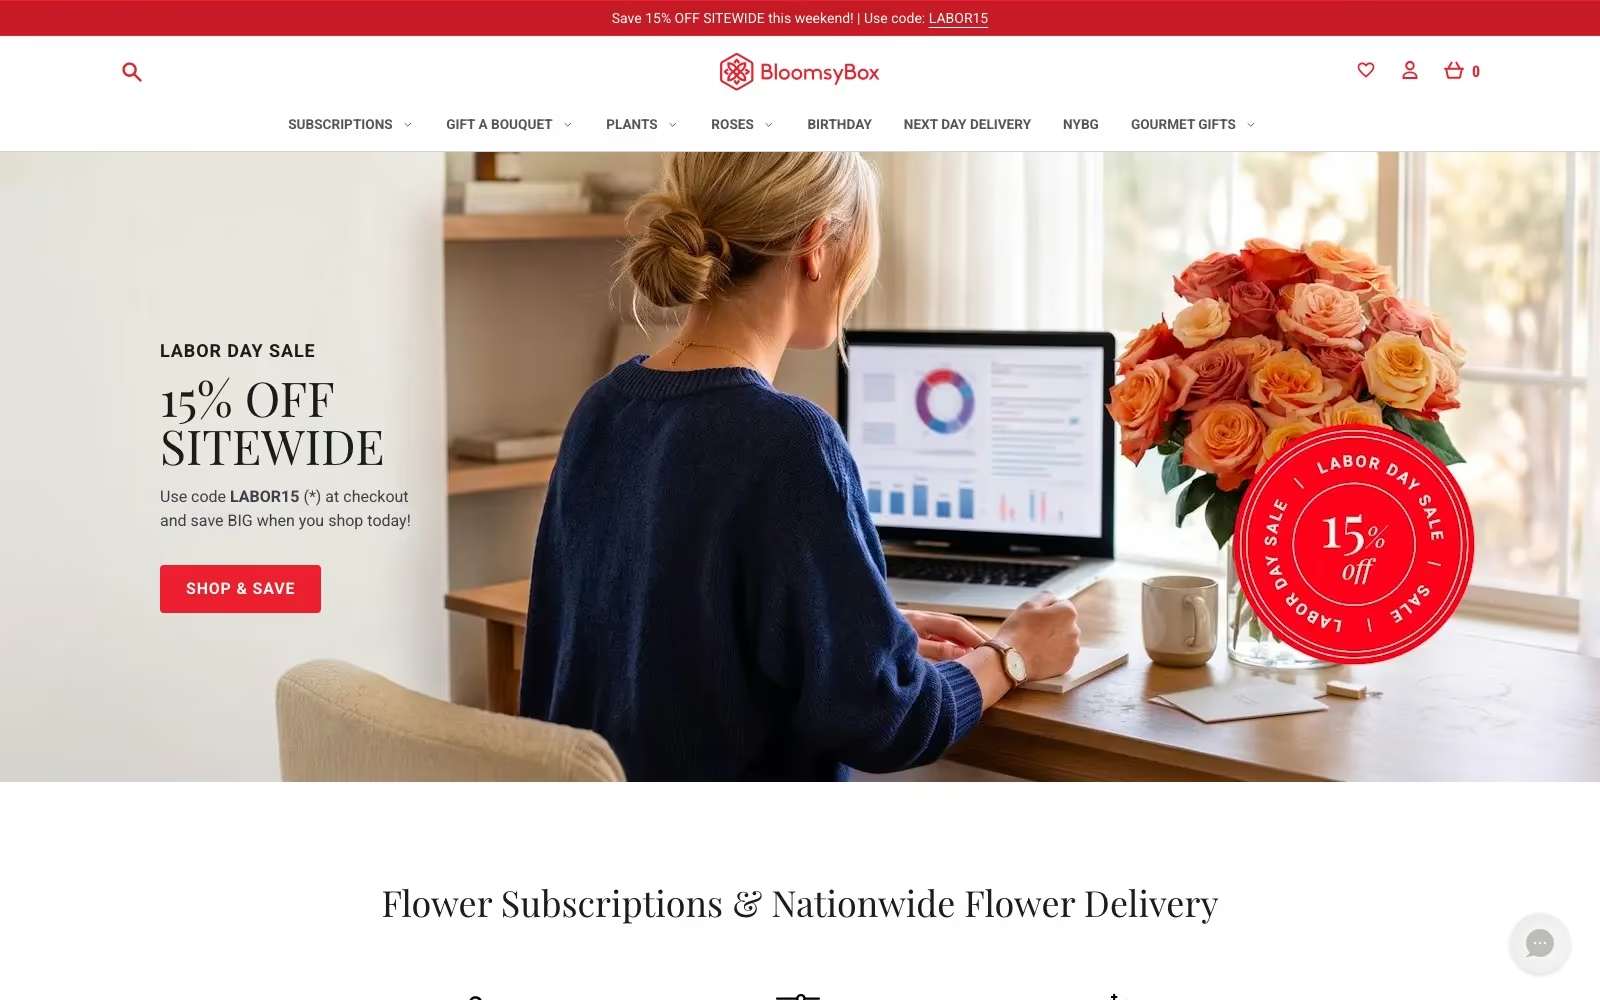
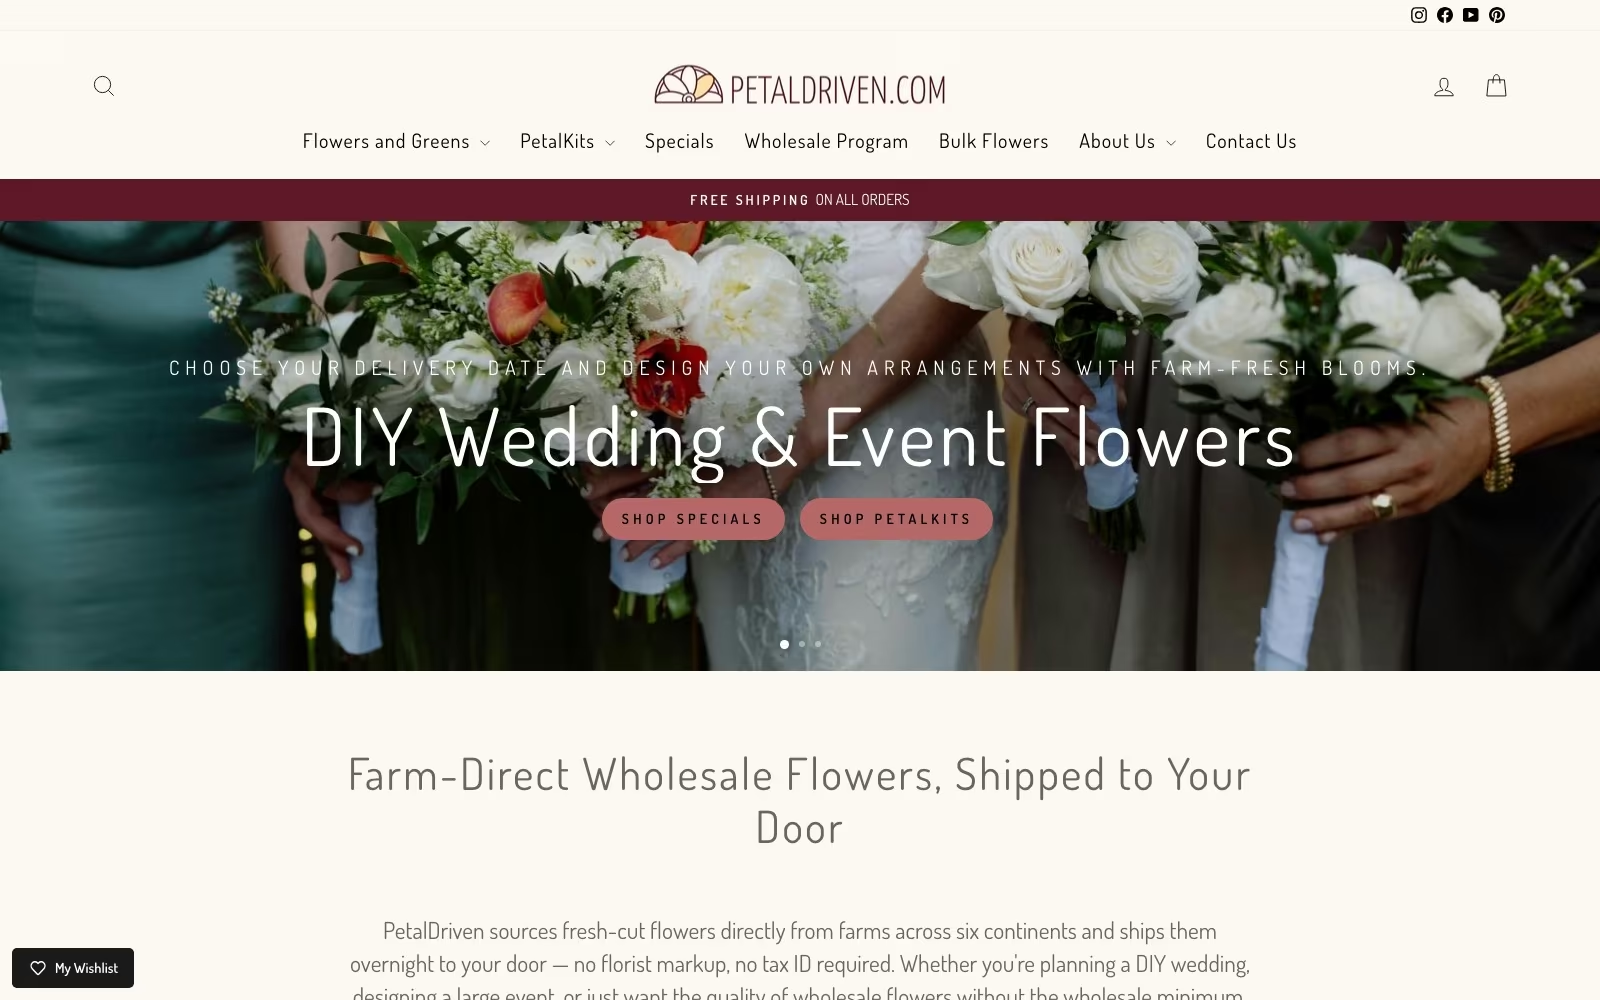
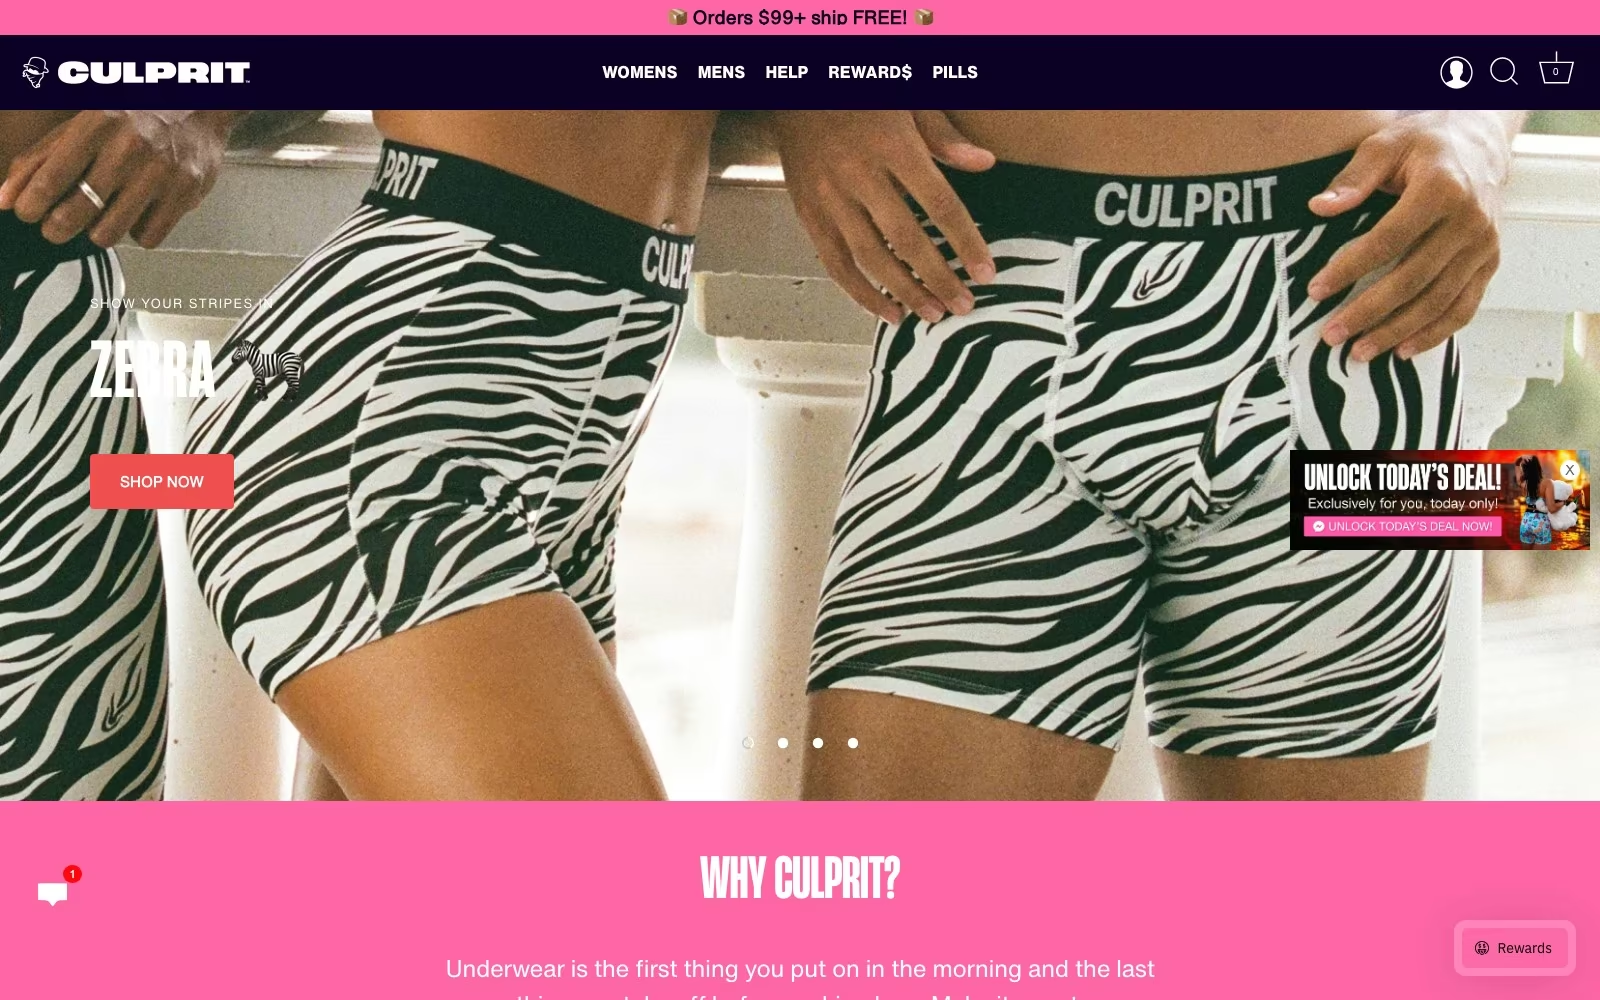
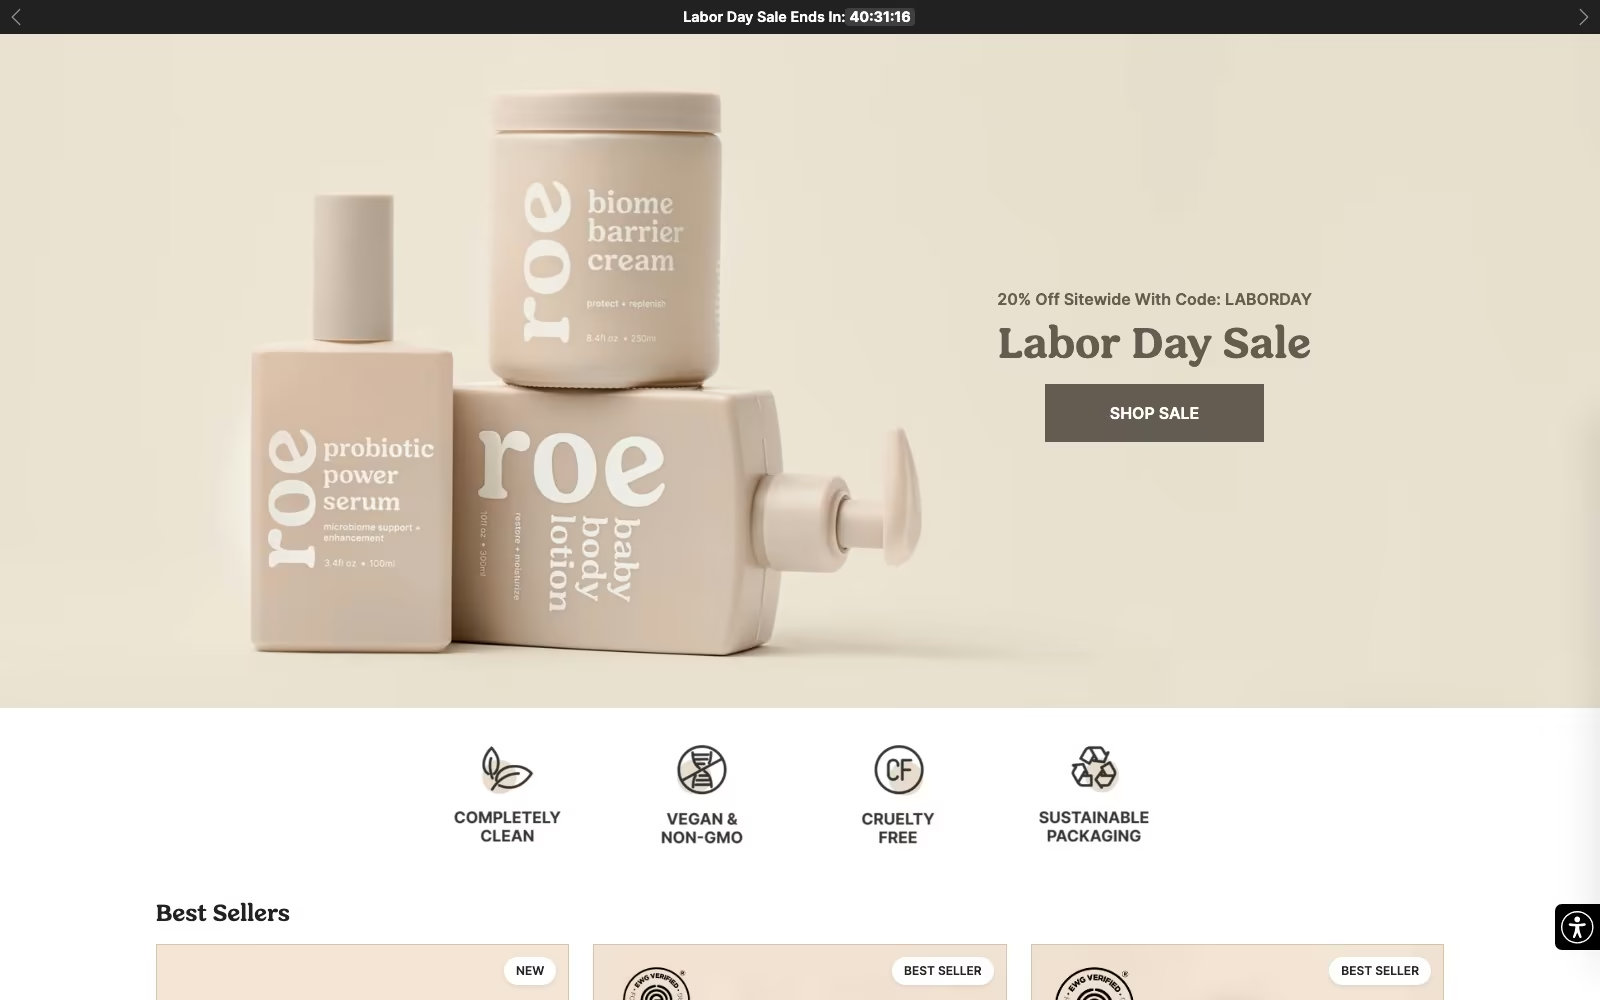
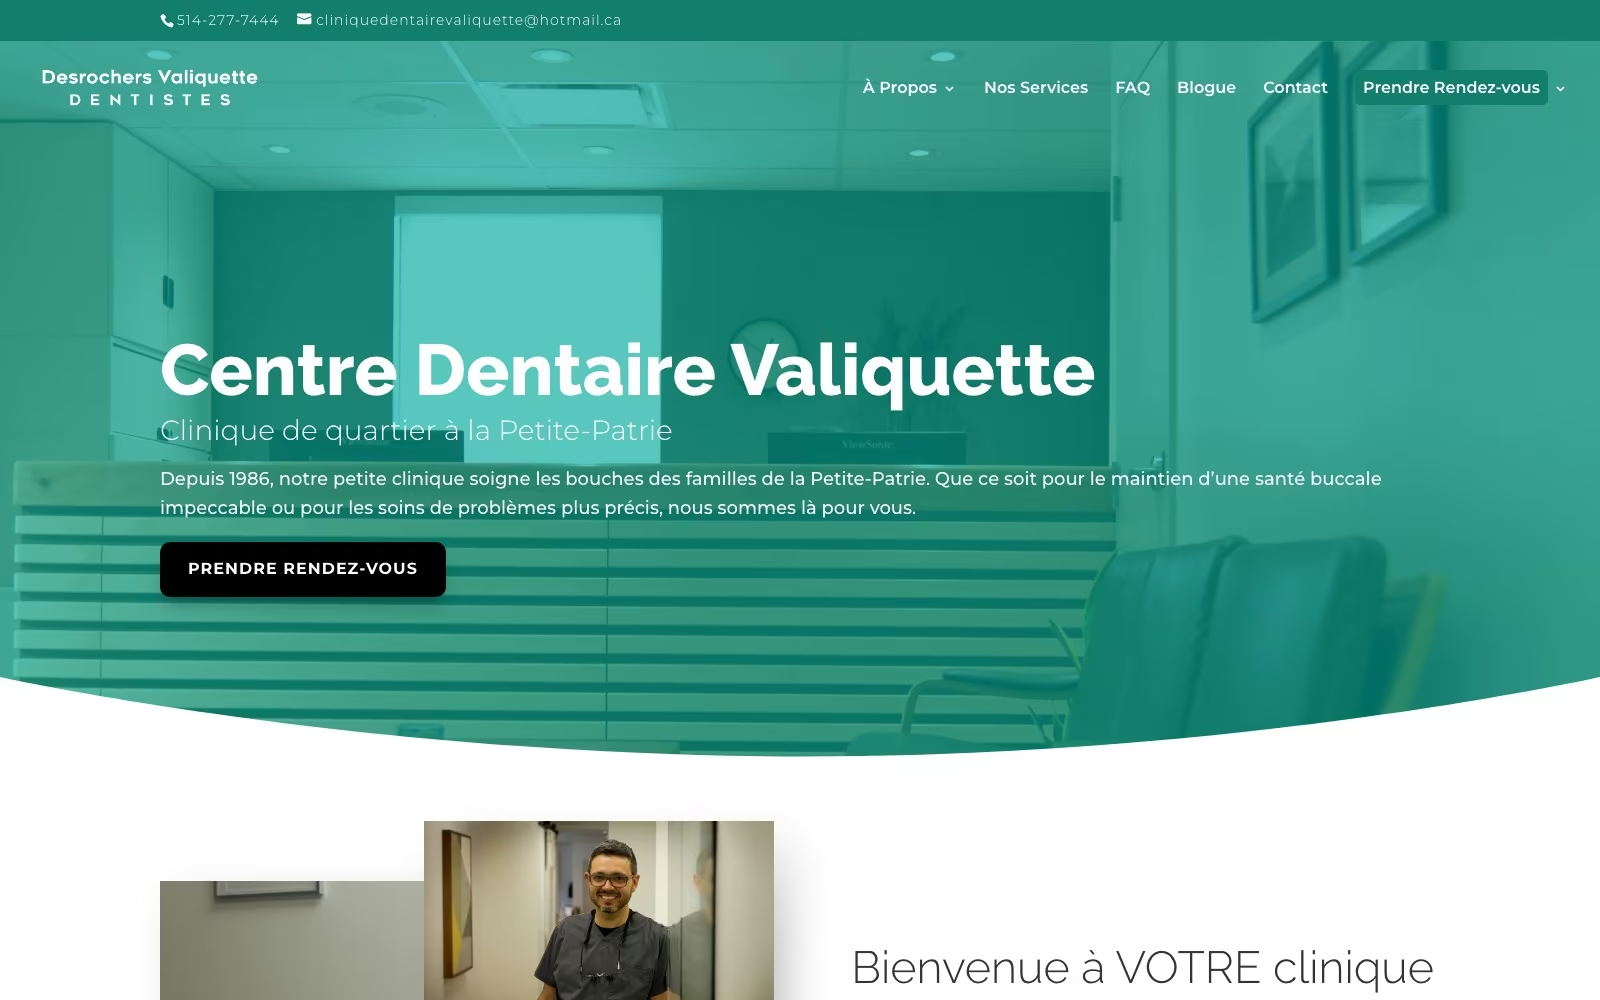
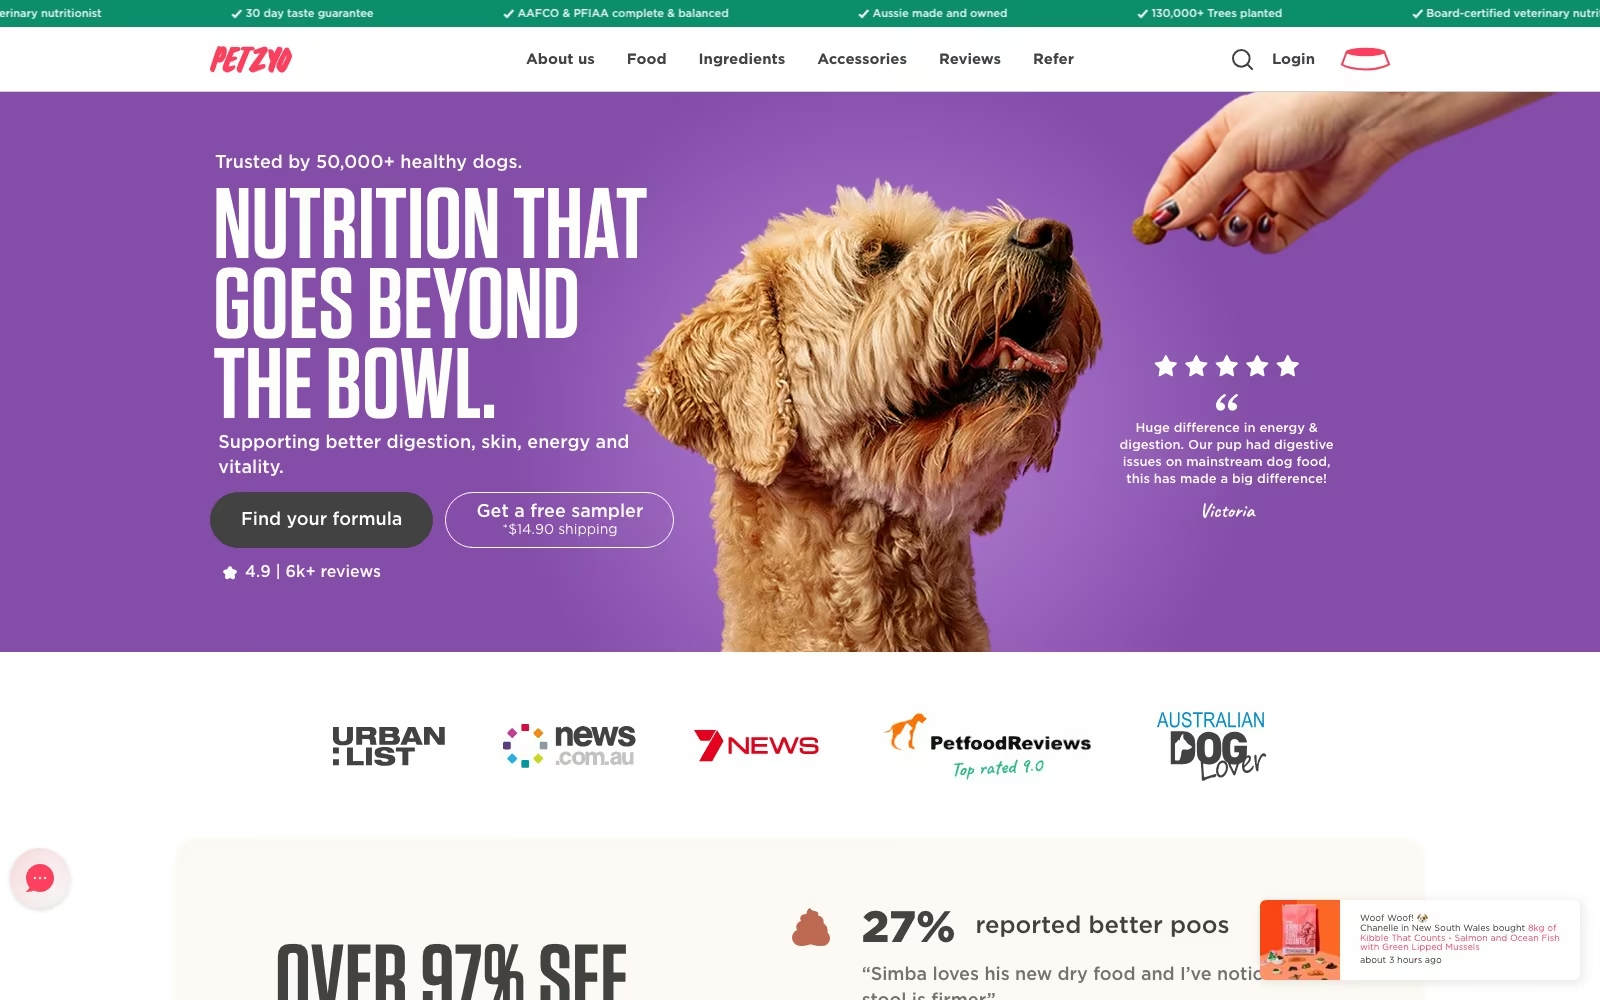
Website Portfolio
Video Ads
Static Ads





























































FAQ
What teams ask us first.
What does a CRO agency actually do?
Four things in a loop: research where and why visitors fail to convert, turn that into hypotheses with a named cause, test them in a way that can be believed, and ship the winners permanently. The research is the part that separates a real programme from a list of best practices, and the shipping is the part most programmes forget. Done properly it also produces a second asset beyond the revenue: a documented understanding of your buyers that improves your ads, your sales conversations and your next redesign.
How much traffic do we need before testing is worth it?
It depends on the conversion rate of the step you are testing, not on total site traffic, which is why generic thresholds mislead. A checkout step converting at 40% can reach significance far faster than a homepage converting at 2%. We calculate the required sample before proposing a test, and where the numbers do not support an experiment we say so plainly and recommend the change on the strength of the research instead. Faking rigour on thin data is worse than making a well-reasoned judgment call, because it produces confident conclusions that are simply noise.
What kind of uplift should we expect?
Cumulative rather than dramatic, and honest programmes talk about win rates rather than headline percentages. VWO's 2026 benchmark shows call-to-action copy tested around 3,500 times at roughly a 10% win rate, which tells you most individual tests will not win. The value comes from the winners compounding while the losers stop you shipping harmful changes. Anyone promising a fixed percentage before looking at your funnel is selling a case study, and the more useful forecast is how much revenue the steps we plan to test currently expose.
Do you only test buttons and headlines?
No, and a programme that does will plateau fast. Copy and layout tests are the cheap end; the gains usually sit in flow and offer. Removing a required field, reordering a multi-step form, exposing delivery cost earlier, changing what qualification happens before a demo, adding proof where the objection actually lands, or fixing mobile checkout behaviour typically move more money than any headline. Sometimes the honest answer is that the page is fine and the offer is the problem, in which case we will say that rather than run a decorative test.
How does site speed fit into conversion work?
It is a conversion input, so we treat it as part of the same programme. Deloitte's mobile research found a 0.1 second improvement worth 8.4% in retail conversion rate and 21.6% more form submissions on lead-generation sites, and Google's T-Mobile case study reported a 60% improvement in visit-to-order rate alongside fewer reported issues. On most sites the biggest culprits are third-party tags and unoptimised images rather than the framework, which makes it some of the cheapest conversion work available. Our development team handles the implementation.
Who implements the winning variants?
We do, into your codebase, unless your team prefers to take it. Leaving winners running permanently inside a testing tool is a common and expensive habit: it adds a script to every page load, breaks when the tool changes, and means your revenue depends on a vendor's client-side injection. So a test is not finished until the change is real code, deployed, and re-verified in your analytics. That is also why we work closely with development rather than handing over a document and hoping it reaches a sprint.
Can you work with our existing analytics and dev team?
Yes, and that is the usual arrangement. We tend to own research, hypothesis design, test build and analysis while your developers own review and deployment, working in your repositories and following your conventions. Where your analytics setup is the weak link we will fix or flag it first, because a testing programme built on unreliable events produces confident wrong answers — our analytics team handles that validation, and it is often the first thing we do.
What happens to tests that lose?
They get reported as clearly as the winners and logged with what they disproved. A loss that kills a redesign somebody was about to ship has obvious value; a loss that disproves an assumption about your buyers has more, because it redirects the whole roadmap. We keep an experiment log with the hypothesis, the result, the segment detail and the decision taken, so a new team member cannot spend a quarter re-running last year's tests. Roughly speaking, we judge a programme on shipped winners plus retired assumptions, not on a win rate.
How do you price CRO?
A fixed-scope research and roadmap engagement first, so you can see the evidence and the sequenced plan before committing to anything ongoing. After that it is a monthly fee scoped to the testing and implementation cadence you want, including the development time to ship winners — we include that deliberately, because programmes that price implementation separately tend to accumulate unshipped wins. We do not charge a share of the uplift, since isolating that share honestly over time is not something either party can verify cleanly.
Can you redesign pages as well as test them?
Yes. Where research says a page needs rethinking rather than tuning, our web design team designs it and we test the new version against the old one rather than assuming the redesign wins — which is exactly the assumption that makes redesigns risky. For landing pages behind paid media we usually build several deliberate variations mapped to the ad angles from our creative strategy work, so message and page match instead of fighting each other.

.webp)
.webp)


