



Which half of the budget works?
half of the budget
We build marketing mix models that answer the budget question with evidence: what each channel contributed, what it would return with more money, and what nothing at all would have produced. Built on open-source frameworks you keep, and validated against real experiments — alongside attribution, analytics and dashboards when the answer has to reach the whole team.






Tell us a little about your brand and we'll be in touch within 24 hours to lock in a time.



THE FOUR WORKSTREAMS
Data, model, validation, decisions.
Data, model
A model is only as good as the history behind it, the assumptions inside it, the tests that check it and the decisions it changes. Skip the last one and you have bought an expensive slide.
Data collection and preparation
Modelling
Validation and experiments
Planning and decisions
Two years of honest history.
Modelling starts with assembling weekly history across every channel: spend, impressions, clicks where they exist, and the outcome you actually care about — orders, qualified leads, revenue, sometimes contribution margin. Alongside it go the things that move sales and are not marketing: price changes, promotions, stock outages, store openings, seasonality, competitor activity, weather where it matters, and the macro noise nobody controls.
Most of the effort lives here. Currency and time zones reconciled, channels defined consistently over time, spend restated after refunds and platform credits, offline media digitised from plans rather than guessed, and gaps documented instead of quietly interpolated. We insist on at least two years of weekly data where it exists, because a model with one seasonal cycle cannot separate Christmas from a campaign.
Where the history genuinely is not there, we say so at the audit stage and recommend geo experiments and incrementality tests first. That is a cheaper, faster answer, and it becomes the calibration evidence when a model is eventually worth building.
- Weekly spend and outcome history, ideally two years or more
- Price, promotion, stock, seasonality and competitive context included
- Channel definitions kept consistent across the whole period
- Gaps documented, never quietly interpolated
- Offline and retail media digitised from real plans
67-76%
of US buy-side teams use incrementality, attribution or MMM (IAB)
2 yrs
minimum weekly history we ask for before modelling
Bayesian, open-source, and inspectable.
We build on open-source frameworks rather than a black box: Google's Meridian and Meta's Robyn are both free, documented and fully visible, which means the model you commission can be re-run, audited and extended by anyone you hire later. That matters more than any proprietary refinement a vendor claims.
The craft is in the assumptions, and we make every one explicit: adstock and carryover per channel, diminishing returns curves, priors informed by your own experiments rather than by a vendor's benchmark, controls for price and promotion, and treatment of brand versus performance spend. We show the sensitivity of the answer to each assumption, because a result that collapses when one prior moves is not a finding, it is a coincidence.
Output is a contribution decomposition, a return per channel with credible intervals rather than false precision, response curves showing where each channel saturates, and a budget optimisation you can interrogate scenario by scenario.
- Open-source Bayesian frameworks you can keep and re-run
- Adstock, carryover and saturation stated per channel
- Priors informed by your own experiments where they exist
- Credible intervals reported, never single-point certainty
- Sensitivity of the answer to each assumption shown
43%
of marketers say MMM built a more effective media mix
41%
report stronger data-driven decision-making
A model that never met reality is a guess.
Correlation is generous, so we test the model against outcomes it did not see: holdout periods, backtesting against known events, and above all live experiments. Geo tests, matched-market designs and platform holdouts give an incremental answer for one channel, and that answer becomes both a check on the model and a prior for the next refresh.
This is also where MMM earns its place next to other measurement rather than replacing it. The IAB found most US buy-side decision-makers now use at least one of incrementality testing, attribution analysis or marketing mix models, with incrementality tests the most common — and the reporting from HBR and Google shows marketers who combine methods report higher confidence in decisions (68%) and more accurate measurement of impact (67%).
So we run a calibration calendar: a small number of experiments each year, chosen where the model is least certain and the budget at stake is largest.
- Holdout and backtest validation before any recommendation
- Geo and matched-market experiments to measure incrementality directly
- Experiment results fed back as priors on the next refresh
- Calibration calendar targeting the least certain, highest spend areas
- Model used alongside attribution, never as a replacement
68%
report higher decision confidence when methods are combined
67%
report more accurate measurement of marketing impact
The output is a plan, not a PDF.
The most common failure in this field is a technically sound model nobody acts on. Google's own write-up of the Harvard Business Review Analytic Services research put it plainly: nearly 40% of marketers say their organisation struggles to connect MMM outputs to real-world decisions, and only 22% rate themselves effective at turning models into timely action, against 42% classed as laggards.
So the deliverable is built for the planning meeting. Scenario planning your team can run themselves: move a million between channels and see the projected outcome with its uncertainty. Recommended allocations for the next quarter with the reasoning attached. Clear statements of where the model is confident and where it is not. And a short list of decisions the model would change — which is the test of whether it was worth building.
We present it to the people who hold the budget, in language a finance director accepts, and we say plainly when the honest answer is that the data cannot settle the question yet.
- Scenario planning your team can run without us
- Quarterly allocation recommendations with reasoning attached
- Confidence stated per channel, including where it is low
- Presented to budget holders in finance-ready language
- Refresh cadence agreed so the model stays current
40%
struggle to connect MMM outputs to real decisions (HBR + Google)
22%
rate themselves effective at turning models into action
of brands spending $100M+ run MMM (Presenc AI)
of US marketers plan MMM investment (TransUnion/EMARKETER)
Results reported with uncertainty, never false precision
Data pipeline, model code and documentation
We made the difference for those brands

Healthcare & regulated services

B2B software, fintech, insurance

Food & beverage

Beauty, personal care & wellness

B2B software, fintech, insurance

Beauty, personal care & wellness

B2B software, fintech, insurance

Creative, content, arts & culture

Food & beverage

B2B software, fintech, insurance

Consumer tech and platforms

Retail & commerce

B2B software, fintech, insurance

Home essentials, appliances, kitchen & pet

Creative, content, arts & culture

Food & beverage

Healthcare & regulated services

Beauty, personal care & wellness

Travel & mobility

Food & beverage

B2B software, fintech, insurance

Home essentials, appliances, kitchen & pet

Healthcare & regulated services

Food & beverage

Home essentials, appliances, kitchen & pet

Home essentials, appliances, kitchen & pet

Healthcare & regulated services

B2B software, fintech, insurance

Beauty, personal care & wellness

Consumer tech and platforms
01 — The challenge
Every platform claims the same sale.
Add up the returns reported by each ad platform and you have apparently doubled the business. Meanwhile brand spend, retail media, sponsorship and offline show up nowhere, cookie-based attribution keeps shrinking, and the budget conversation ends with whoever argues hardest getting the increase.
“Our dashboards say we made twice the revenue we actually banked.”
Marketing mix modelling answers a different question from attribution: not which touchpoint got the credit, but what the whole plan produced and what each part contributed. That is why adoption has moved from a handful of large advertisers to the mainstream — the IAB found most US buy-side decision-makers now use incrementality testing, attribution analysis or MMM. The work is to build one you can trust and actually use.
02 — Our approach
Build it open, validate it live, plan with it.
We start with a feasibility audit rather than a sales pitch: what history exists, how consistently channels were defined, how much of your outcome is explained by price and promotion, and whether the spend at stake justifies the exercise at all. If it does not yet, we say so and run geo experiments instead. When it does, we assemble the weekly dataset, restate spend honestly, and add the commercial context that moves sales. The model is built on open-source Bayesian frameworks so you keep and can re-run it, with adstock, saturation and priors stated explicitly and sensitivity shown for each. Then it meets reality: holdouts, backtests and live geo experiments, whose results become priors for the next refresh. Finally we make it usable — scenario planning your team runs themselves, quarterly allocation recommendations with reasoning, and confidence stated openly per channel. Code, data pipeline and documentation are handed over in full.
03 — What we did
Four phases, ending in a budget decision.
Feasibility, dataset, model, then planning — the last phase is the point, and it is the one most modelling projects never reach.
Weeks 1-2 / Feasibility
Decide whether to model at all
History checked, channel definitions reviewed, spend at stake weighed. If experiments are the better answer, we say so.

Weeks 2-5 / Dataset
Assemble two years of truth
Weekly spend and outcomes reconciled, offline plans digitised, price, promotion and stock context added, gaps documented.

Weeks 5-9 / Model
Build it where you can see it
Open-source Bayesian model with adstock, saturation and priors stated, credible intervals reported, sensitivity shown.

Ongoing / Planning
Turn it into next quarter's budget
Scenario planning, allocation recommendations, calibration experiments and a scheduled refresh so it stays current.

WHAT YOU GET
Deliverables you can re-run yourself.
re-run yourself
Everything below is handed over: the data pipeline, the model code, the assumptions and the documentation, so nothing depends on us being here next year.

Feasibility assessment
An honest read on whether your history supports a model, and what to run instead if it does not yet.

Modelling dataset and pipeline
Weekly spend, outcomes and commercial context assembled, reconciled and automated so refreshes are cheap.

The model itself
Open-source Bayesian model with contribution decomposition, response curves and credible intervals per channel.

Experiment programme
Geo and matched-market tests designed, run and read, then fed back as priors on the next refresh.

Scenario planner
A tool your team uses in the planning meeting to test allocations and see projected outcomes with their uncertainty.

Quarterly readout
Allocation recommendations with reasoning, confidence stated per channel, presented to the people holding the budget.
HOW WE WORK
Operating standards, not promises.
Operating standards


Retail and DTC
Promotion, price and stock modelled alongside media, so a discount is not credited to advertising.
ExploreB2B and considered purchase
Long lags handled explicitly, with pipeline rather than same-week orders as the outcome.
ExploreMulti-market brands
Market-level models that support geo experiments and allow honest cross-country comparison.
Explore

















Built on trust. Proven by results.
We partner with SMBs and Fortune 500 companies to deliver more than reach — we bring clarity, execution, and measurable outcomes. Every successful partnership starts with a strong culture fit and a shared drive to grow.






CASE STUDIES
Case studies
Website Portfolio
Video Ads
Static Ads


























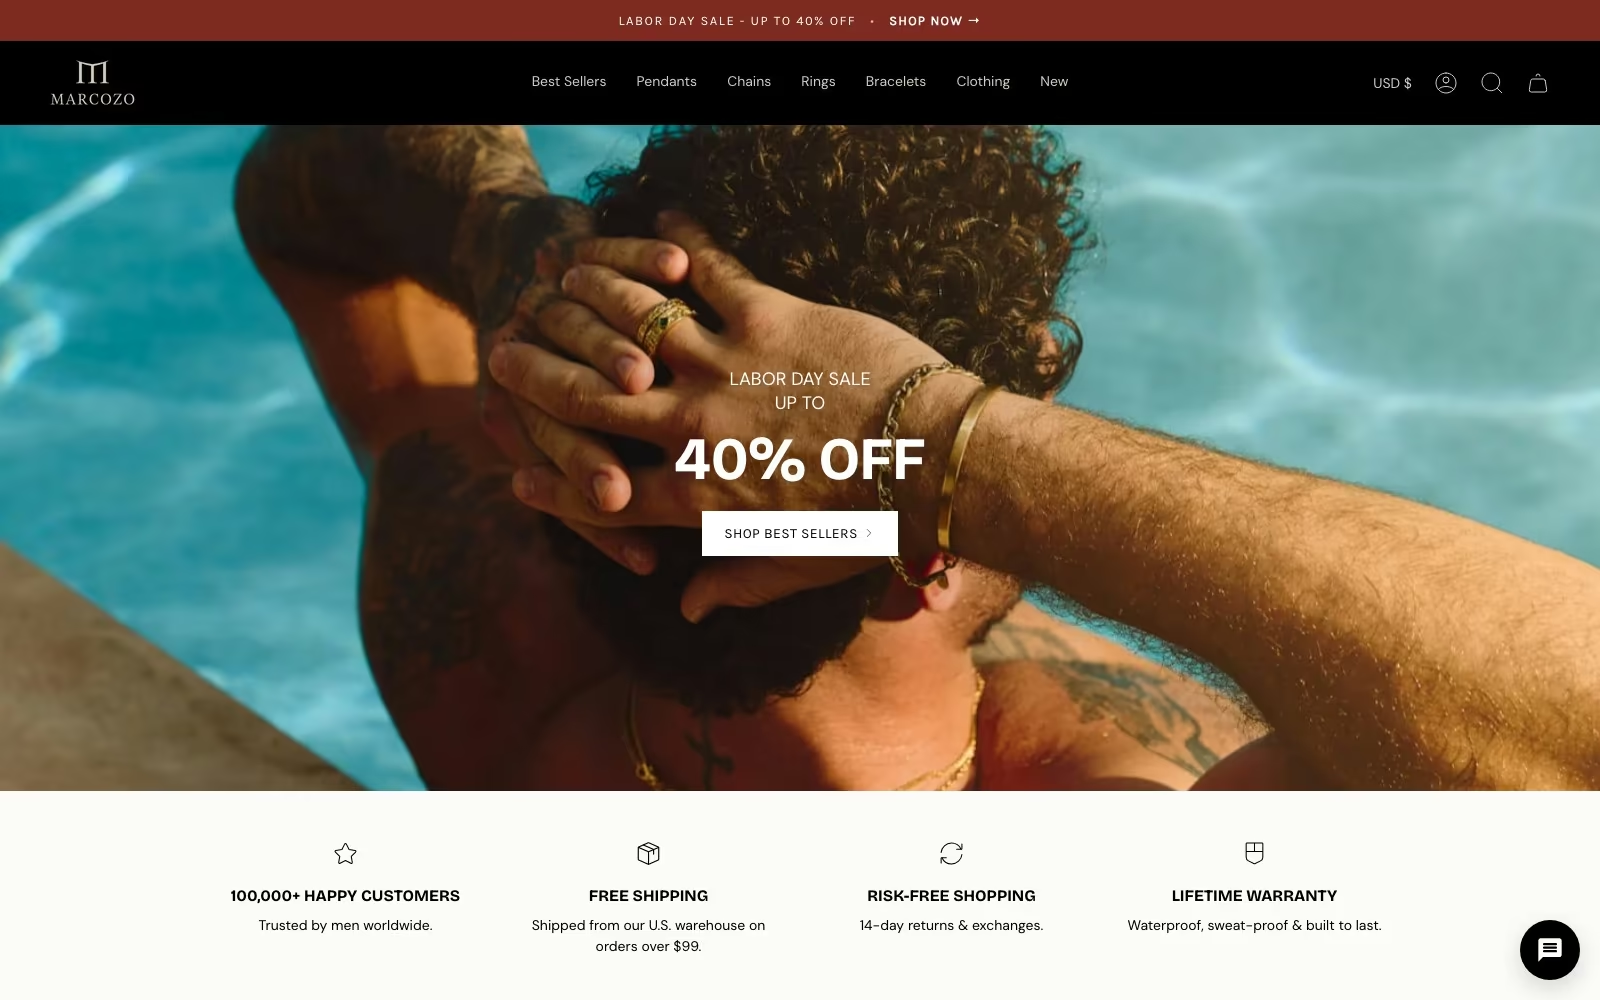













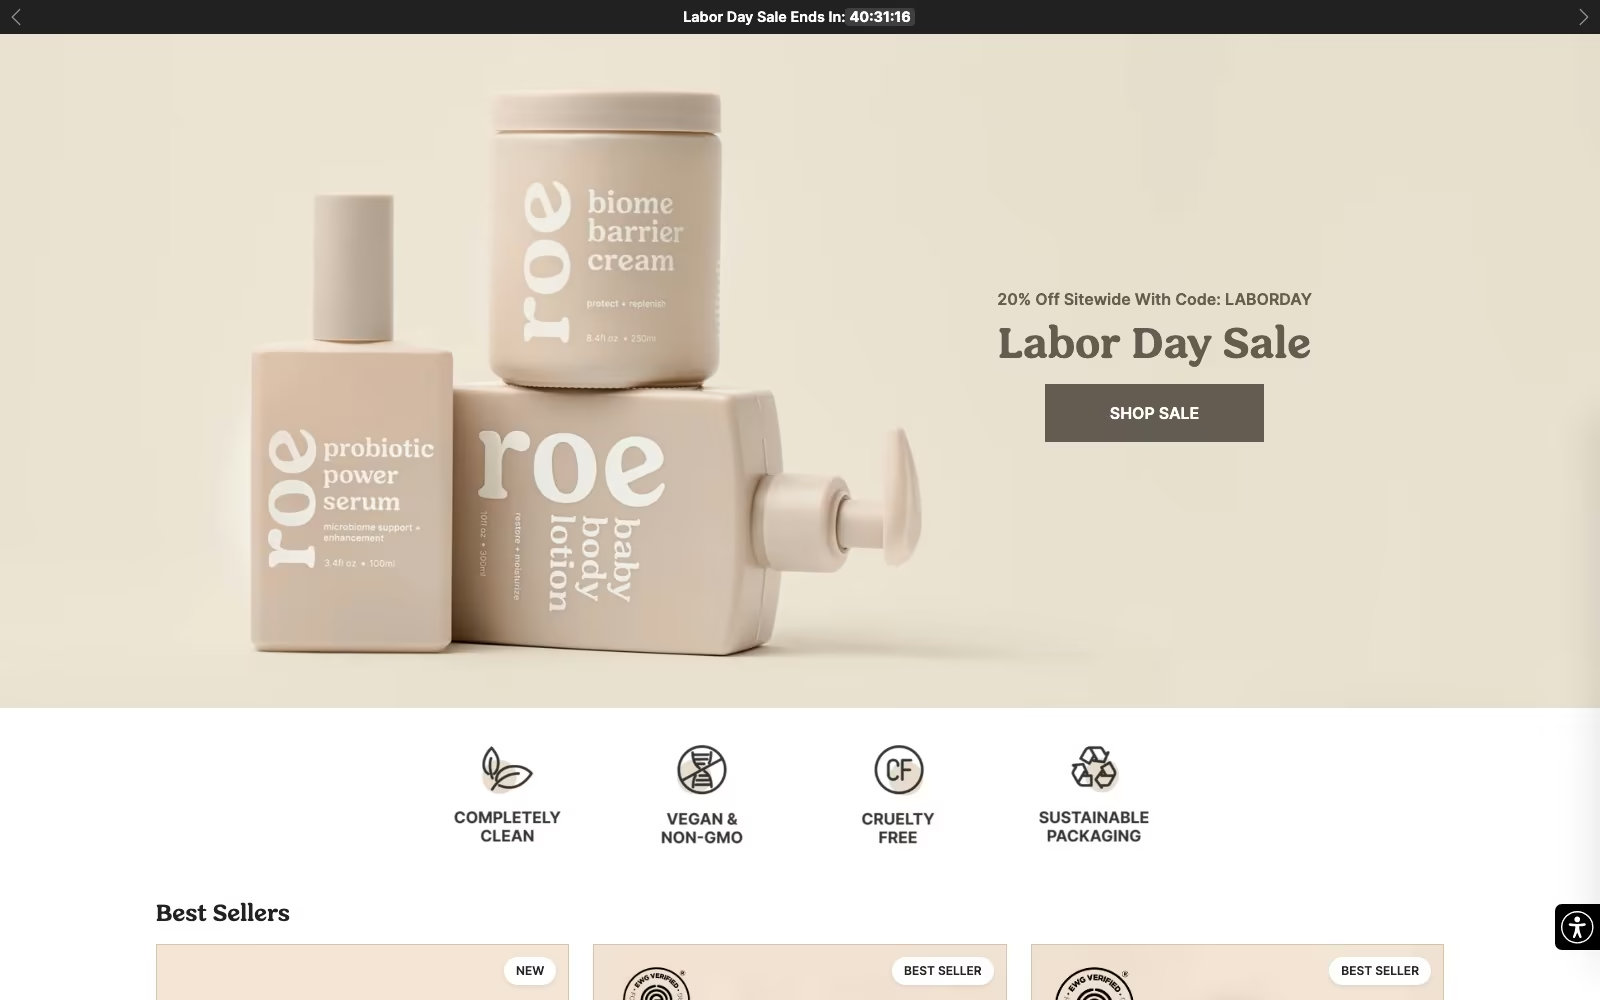



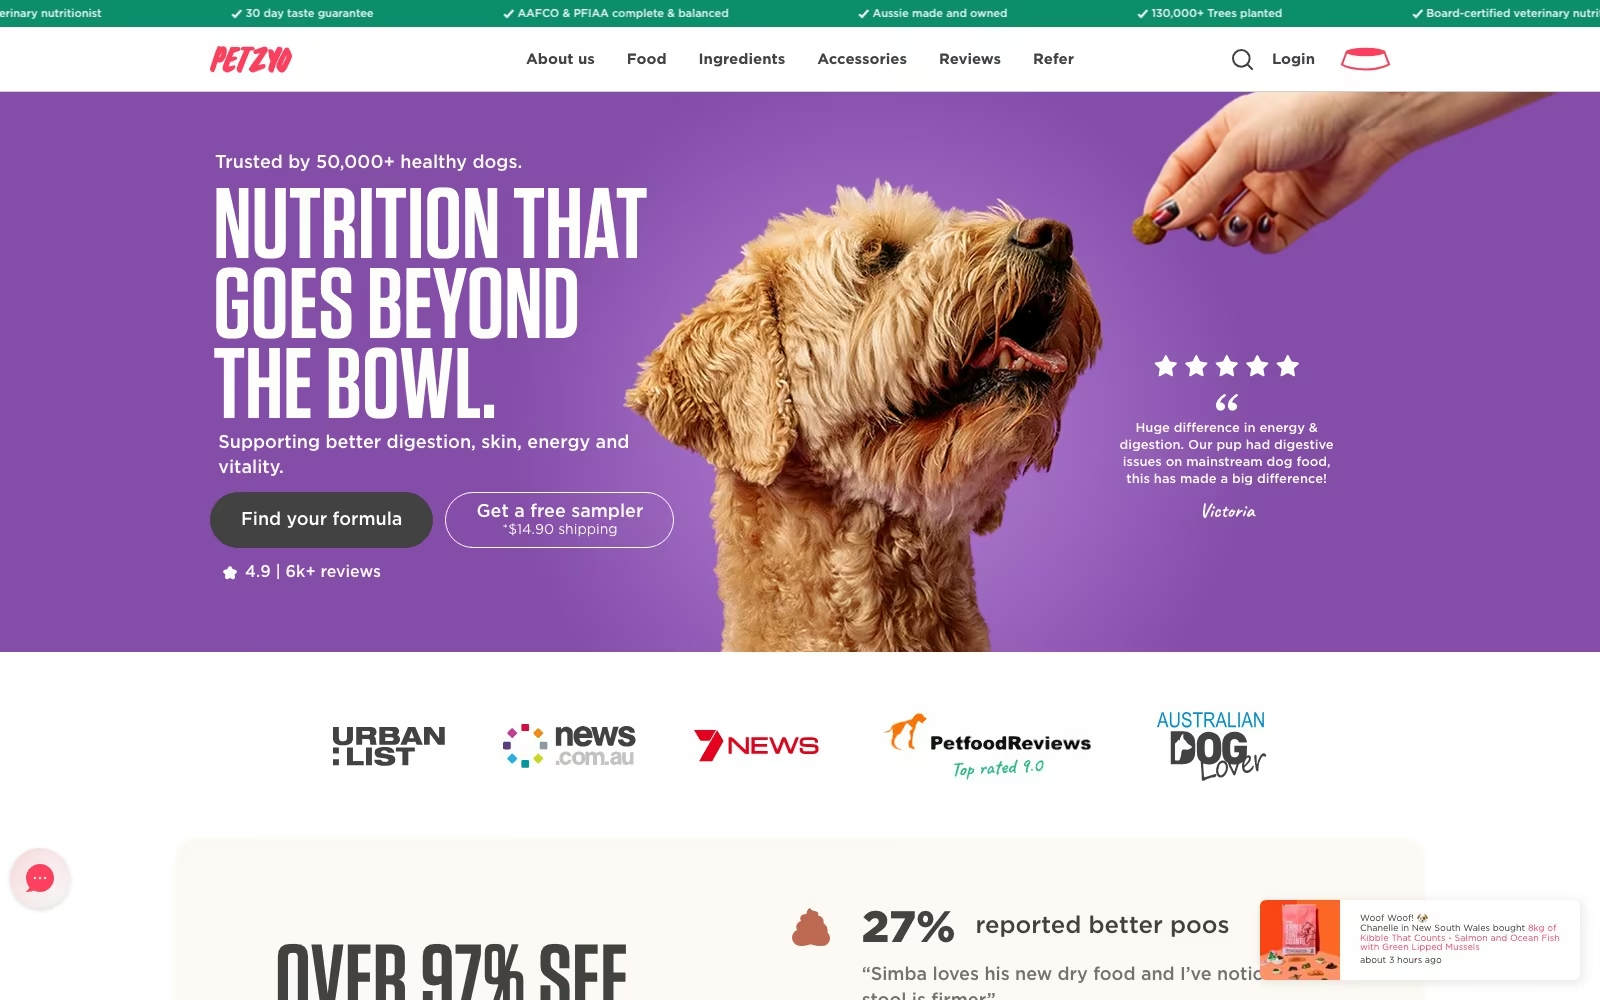



























FAQ
What teams ask us first.
What is marketing mix modeling, in plain terms?
It is a statistical way of explaining what drove your sales. Instead of following individual users, it looks at weekly history — what you spent on each channel, what you charged, what you promoted, what stock you had, what season it was — and estimates how much each factor contributed. Because it works on aggregate data it needs no cookies and no user identity, which is why it survived the privacy changes that broke click-based tracking. It also covers the channels attribution cannot see at all: television, radio, print, sponsorship, retail media and brand campaigns.
How is it different from attribution?
They answer different questions and both are useful. Attribution follows measurable journeys and tells you which touchpoints preceded a conversion, which makes it good for day-to-day optimisation inside a channel. Modelling works top-down on aggregate history and tells you what each channel contributed overall, including the ones with no click at all, which makes it the right tool for setting budgets. Neither is the truth on its own, and experiments are what settle the disagreements between them. Our attribution team builds the bottom-up side.
How much data do we need, and what if we do not have it?
Ideally two to three years of weekly data across every channel, plus price, promotion and stock history. One year can work for a business with strong variation in spend, but a single seasonal cycle makes it hard to separate Christmas from a campaign. If the history is not there we will tell you at the feasibility stage rather than modelling anyway: geo experiments and holdouts give a cleaner answer sooner, cost less, and become the calibration evidence for a model later. Starting to collect a consistent dataset now is the other half of that advice.
Which MMM tools do you use?
Open-source Bayesian frameworks, chiefly Google's Meridian and Meta's Robyn, with custom modelling where a business does not fit either. We prefer them because they are free, documented and fully inspectable: you can re-run the model, hand it to another team, or have a third party audit our assumptions. Paid platforms are a reasonable choice when you want continuous refreshes and no internal data science, and we will help you evaluate them — but a model you cannot see inside is difficult to defend in a budget meeting.
Is the model built by a platform biased toward that platform?
It is a fair question and the reason we insist on inspectable models and independent calibration. The frameworks themselves are open source and the mathematics is public, but any model's answer moves with its priors and its inputs, so we set priors from your own experiments rather than from vendor benchmarks, keep spend definitions consistent across channels, and validate with geo tests that no platform runs for us. We also publish the sensitivity: if a channel's estimated return swings when one assumption changes, you will see it in the readout rather than discover it later.
How accurate is it?
Accurate enough to plan with, and never precise enough to quote to two decimal places. We report credible intervals rather than single numbers, so a channel's return arrives as a range with a most-likely value, and we state which channels the data can and cannot separate — two channels that always moved together are genuinely hard to untangle. Validation against holdout periods and live experiments is what turns a plausible model into a usable one, which is why the calibration calendar is part of the service rather than an upsell.
How often should the model be refreshed?
Quarterly for most businesses, monthly where spend is large or the market moves quickly. That cadence matters more than people expect: a model refreshed once a year arrives after the decisions it should have informed, which is precisely why so many modelling projects are remembered as expensive slides. We automate the data pipeline during the first build specifically so refreshes are cheap, and each refresh folds in the results of any experiments run since, so the model gets better rather than merely newer.
Can it tell us how much to spend next quarter?
It can give you a defensible starting point and the shape of the trade-offs. The model produces response curves per channel showing where extra spend starts delivering less, and the scenario planner lets your team test allocations and see projected outcomes with their uncertainty. What it cannot do is predict a competitor's launch or a price change you have not told it about, so we treat the output as a plan to be tested rather than an instruction. Where the recommendation involves a big move, we usually propose a geo test first.
Does it work for lead generation and long sales cycles?
Yes, with two adjustments. The outcome variable moves from same-week orders to pipeline or closed revenue, and the model has to handle the lag between marketing and money explicitly rather than assuming a weekly response. That needs CRM data joined to the media history, which our CRM analytics team usually helps assemble. The result is often more valuable than for ecommerce, because in long cycles click attribution is at its least reliable and brand investment is at its hardest to defend.
Who needs to be involved from our side?
Less than you might fear, and the right people rather than many. We need someone who can get us spend history and access to the data warehouse, someone commercial who knows the promotions, price changes and stock problems of the last two years, and the budget holder who will act on the result. That last one is the important one: modelling projects that skip the decision-maker produce reports nobody uses. Beyond a kick-off, a mid-point review and the readout, we keep the demands on your team small.
How do you choose between marketing mix modeling agencies?
Ask three questions. Will you own the model, the code and the data pipeline, or rent an output? How will the model be validated against live experiments rather than only against its own history? And what decision-support comes with it — a scenario planner and a quarterly readout, or a PDF? That last one separates the field: the Harvard Business Review Analytic Services research found nearly 40% of marketers struggle to connect model outputs to real decisions. Ask to see a redacted readout, because that shows how an agency thinks.
What does it cost?
The feasibility assessment is a small fixed fee and sometimes ends with us recommending experiments instead of a model, which is a cheaper outcome for you. The first build is fixed-scope and quoted up front, covering the dataset, pipeline, model, validation, scenario planner and readout. After that, refreshes and the experiment programme are a smaller recurring fee, since the expensive part — assembling and automating the data — is already done. As a rule of thumb, modelling earns its cost once media spend is large enough that a few percent of reallocation matters.

.webp)
.webp)


