

CFC & Elevate Health · Healthcare lead generation · Paid social · 2026
How a healthcare lead engine held CA$33 cost per lead at CA$548k of spend
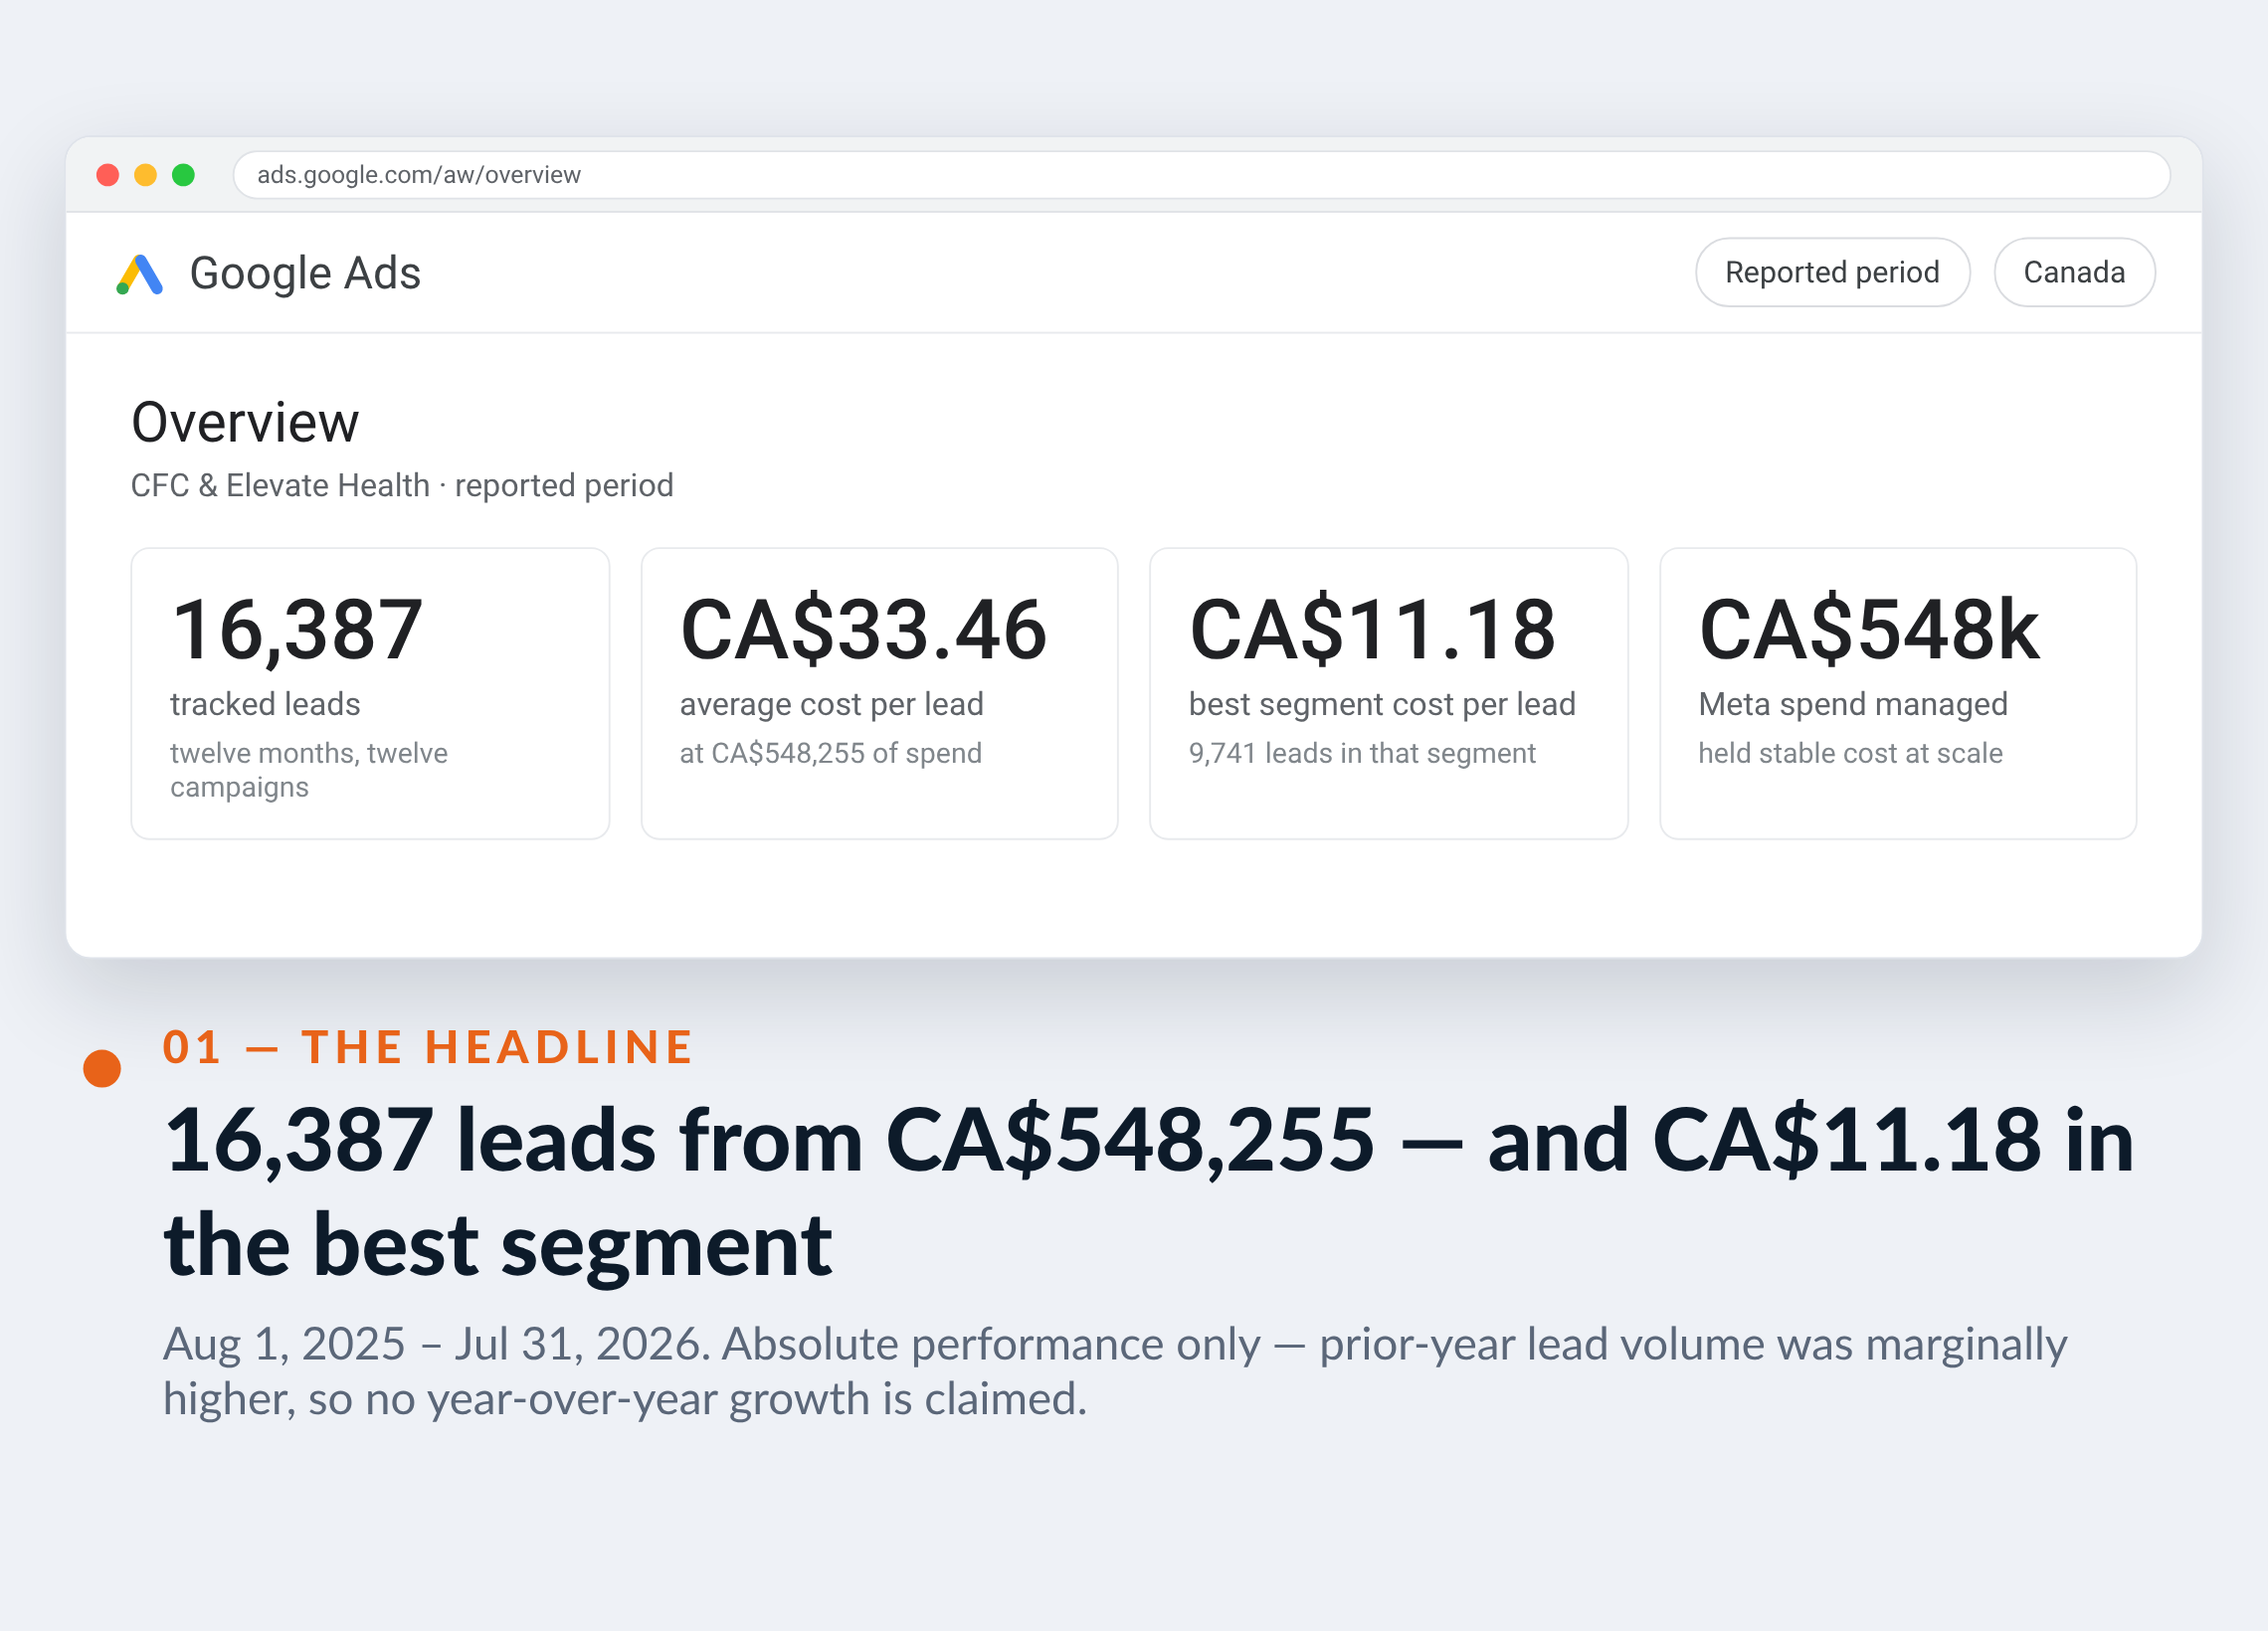
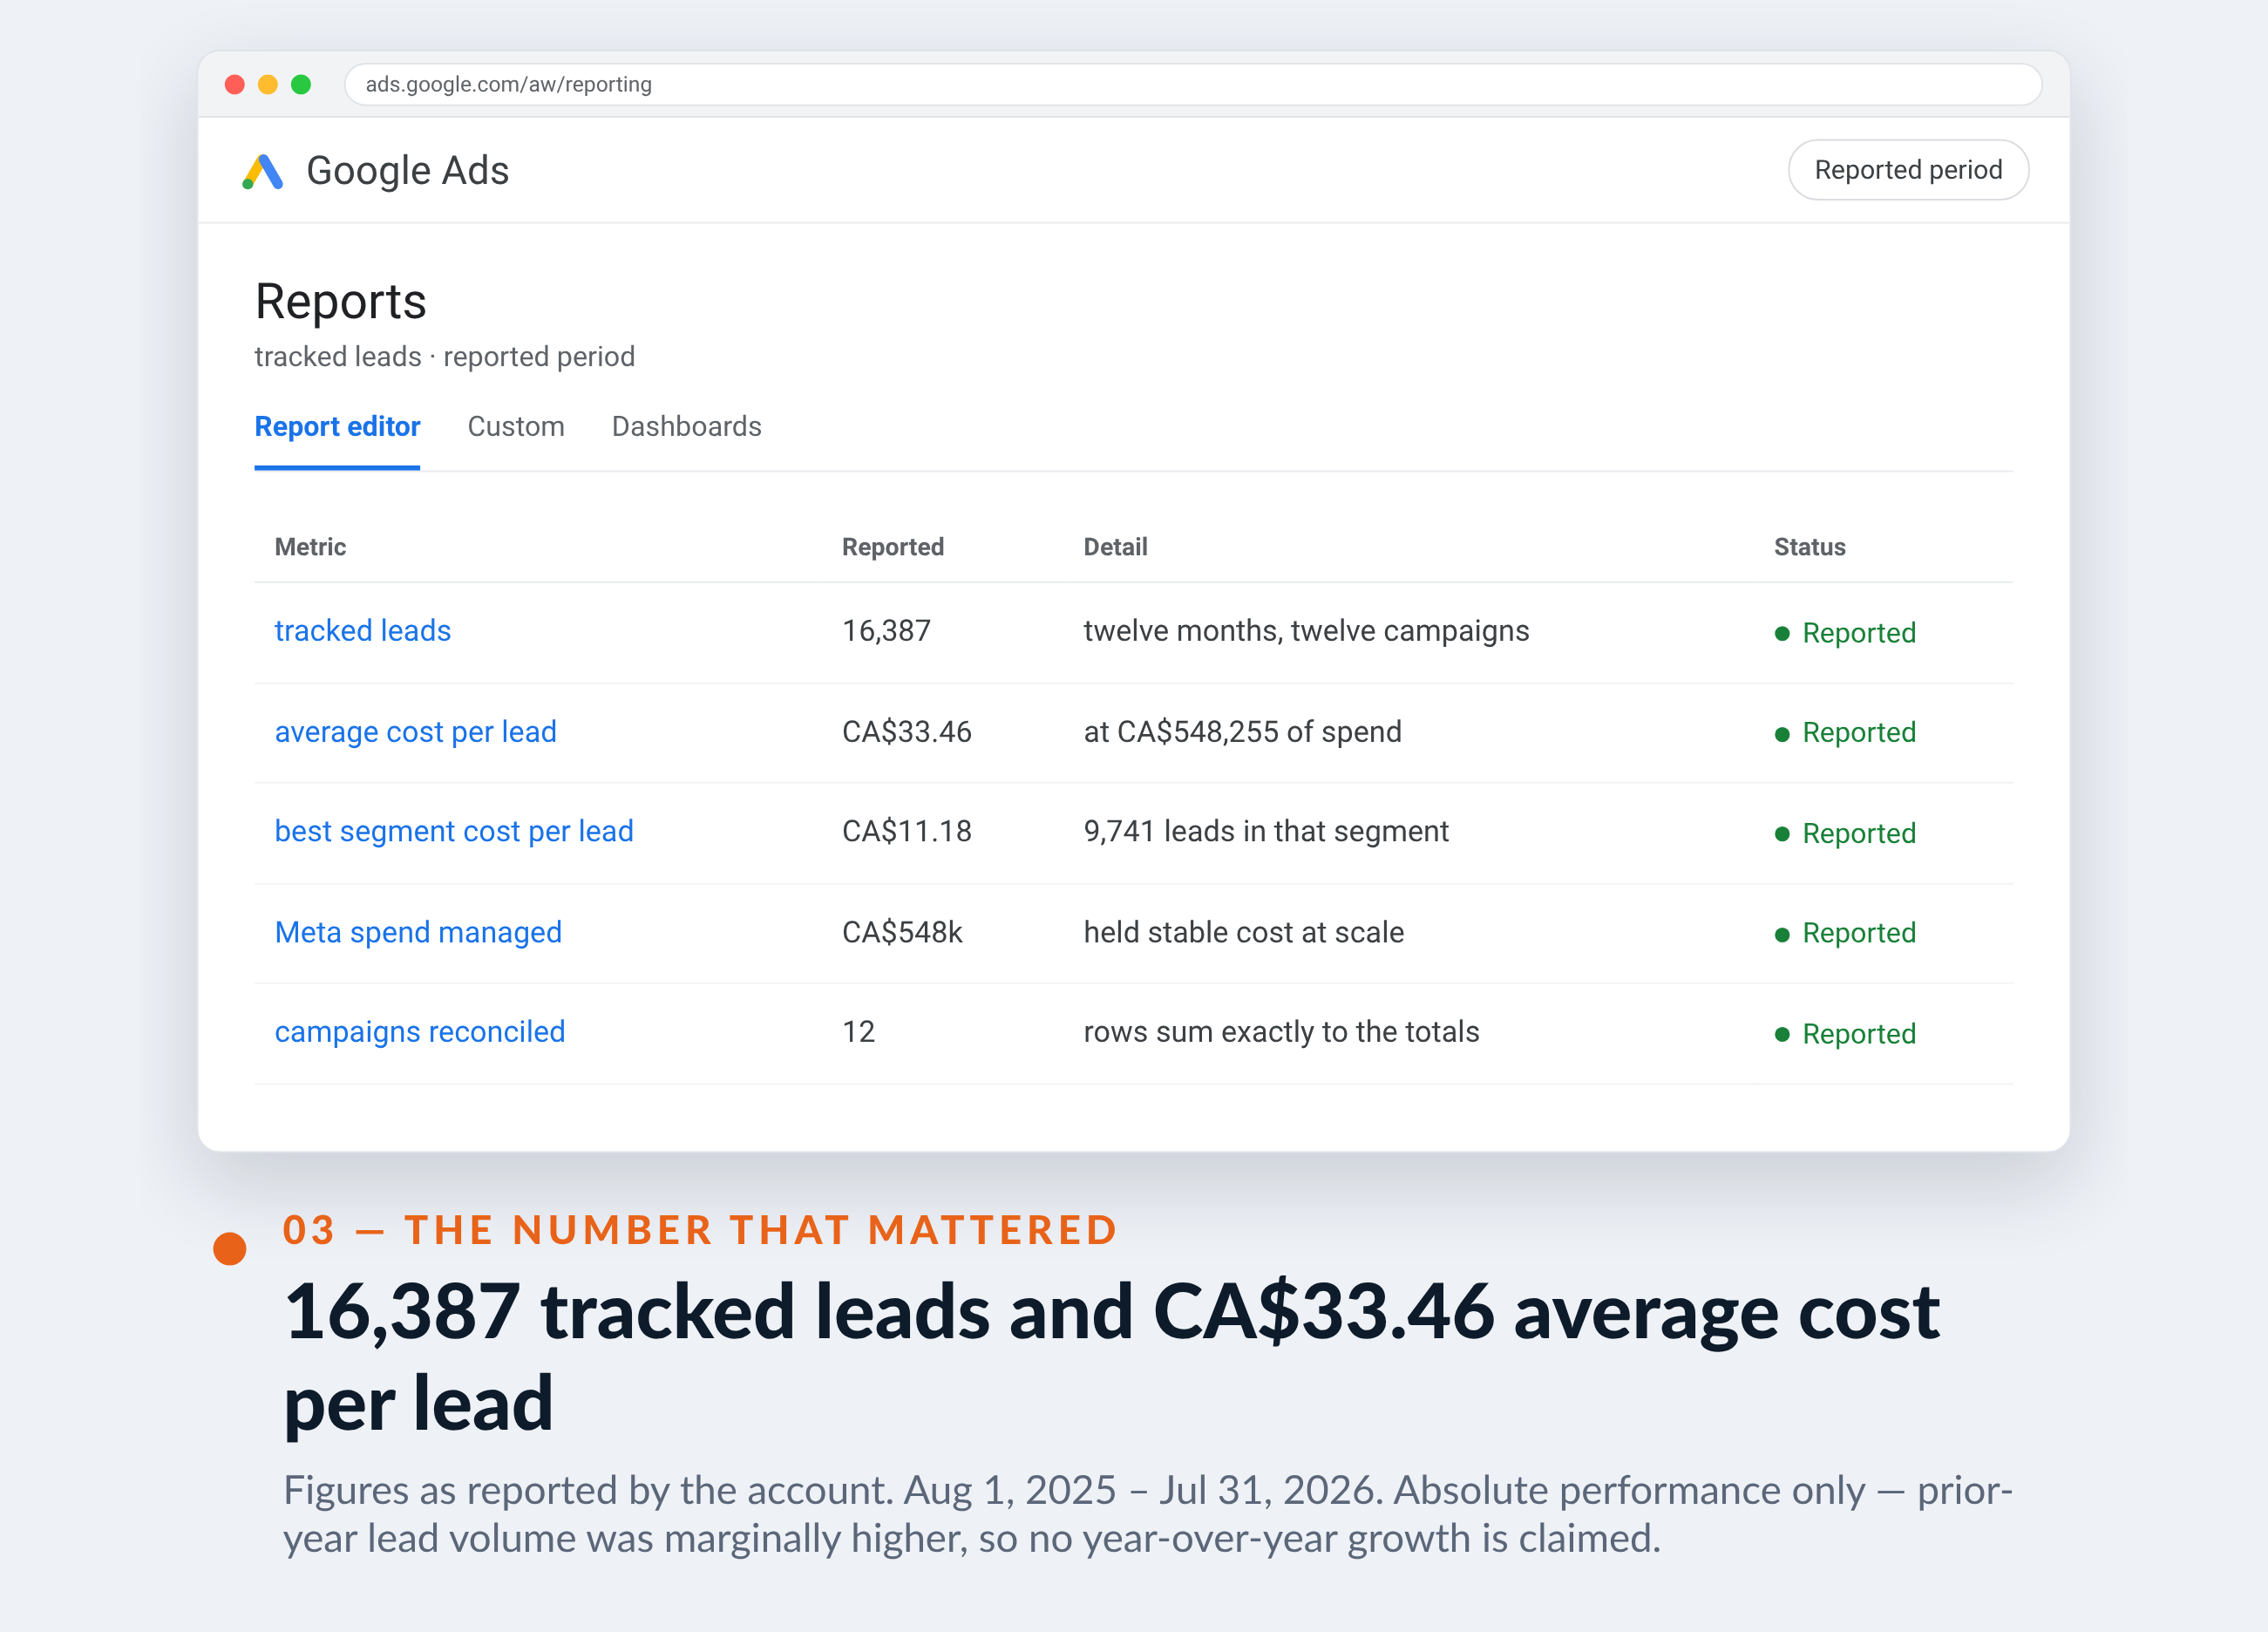
Volume is easy to buy and hard to hold. Across twelve campaigns and CA$548,255 of Meta spend, this program delivered 16,387 tracked leads — and one segment inside it delivered at CA$11.18.


16,387
tracked leads
at CA$33.46 average cost per lead
The results, up top — every number is in the strip below
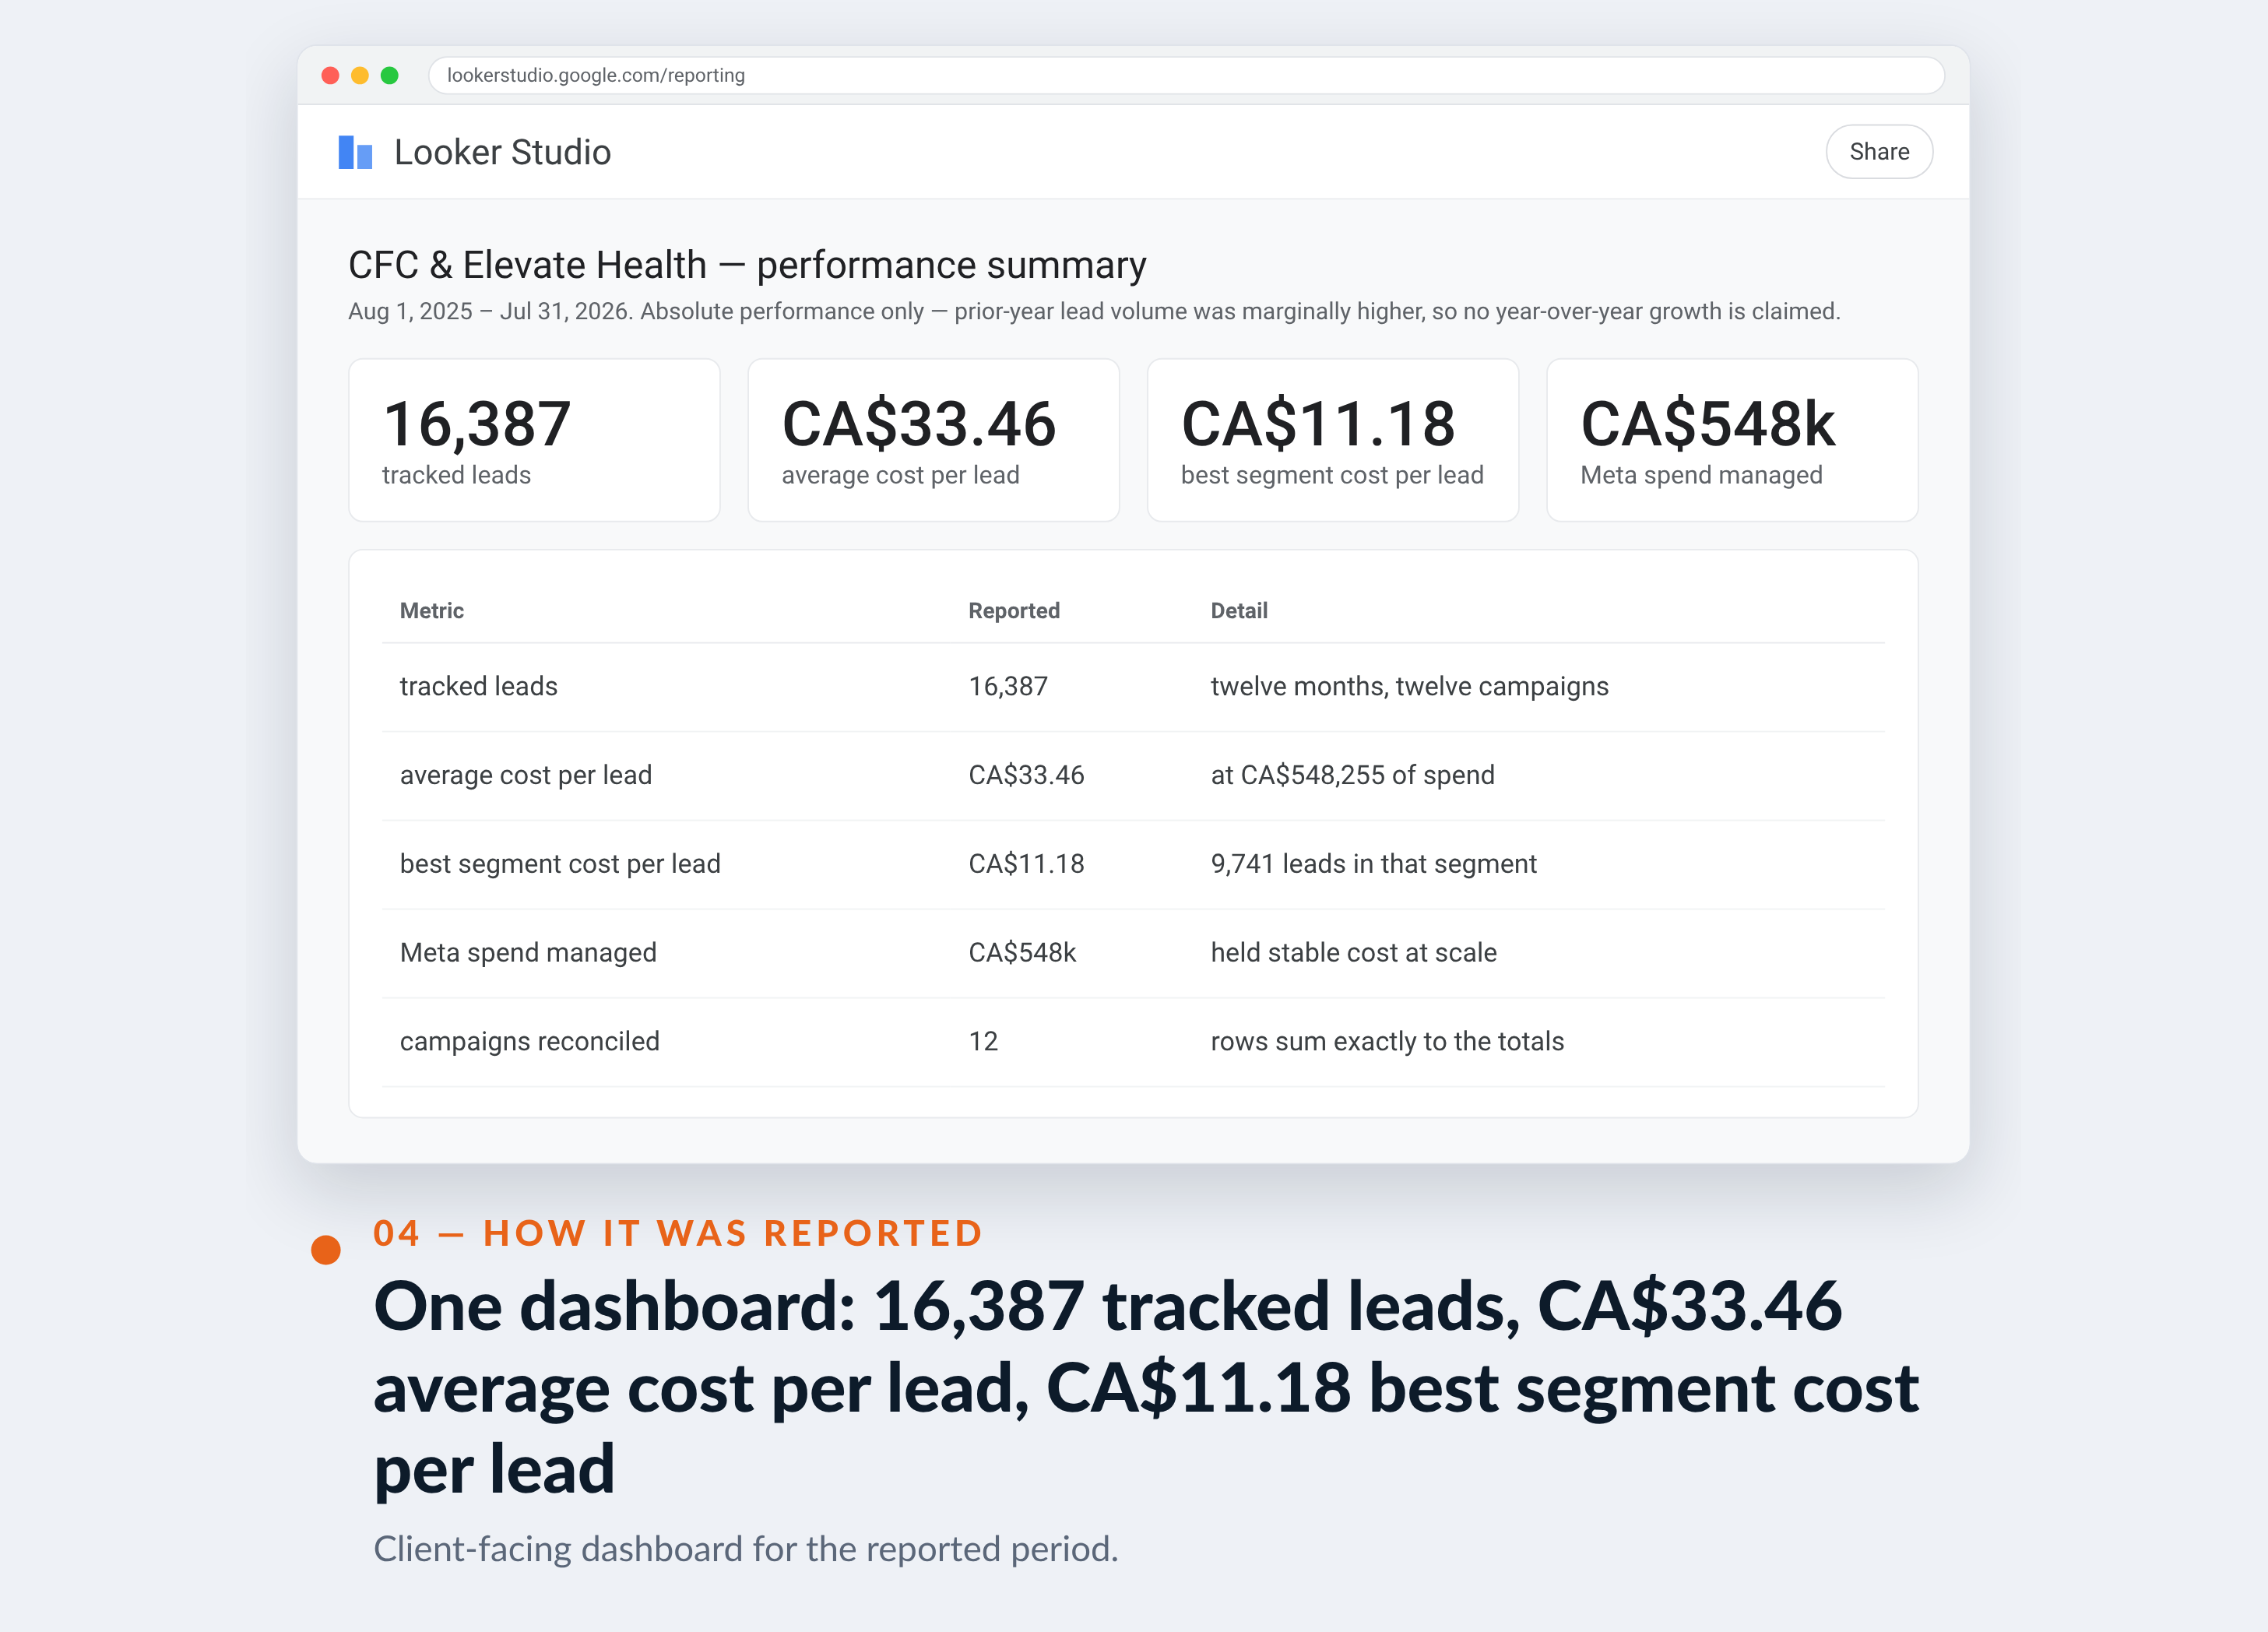
16,387
tracked leads
twelve months, twelve campaigns
CA$33.46
average cost per lead
at CA$548,255 of spend
CA$11.18
best segment cost per lead
9,741 leads in that segment
CA$548k
Meta spend managed
held stable cost at scale
12
campaigns reconciled
rows sum exactly to the totals


01 — The challenge
Holding cost per lead while running at six figures a quarter.
Healthcare lead generation at this volume runs into three walls simultaneously: audience saturation, creative fatigue and rising costs as the easy demand is exhausted. The program was already large, spending over half a million Canadian dollars a year across Meta.
The achievement at this scale is control: cost per lead stayed held at CA$33 across CA$548k of spend, and one brand segment came in at CA$11.18.
“At our volume the only question that matters is whether the cost per lead holds when we push. Anyone can find cheap leads for a week.”
Exactly right, and it is why this page reports absolute performance at scale rather than a year-over-year percentage. The story here is stability and cost control at high spend — holding efficiency while volume stays flat is the hard part at this budget level.
02 — Our approach
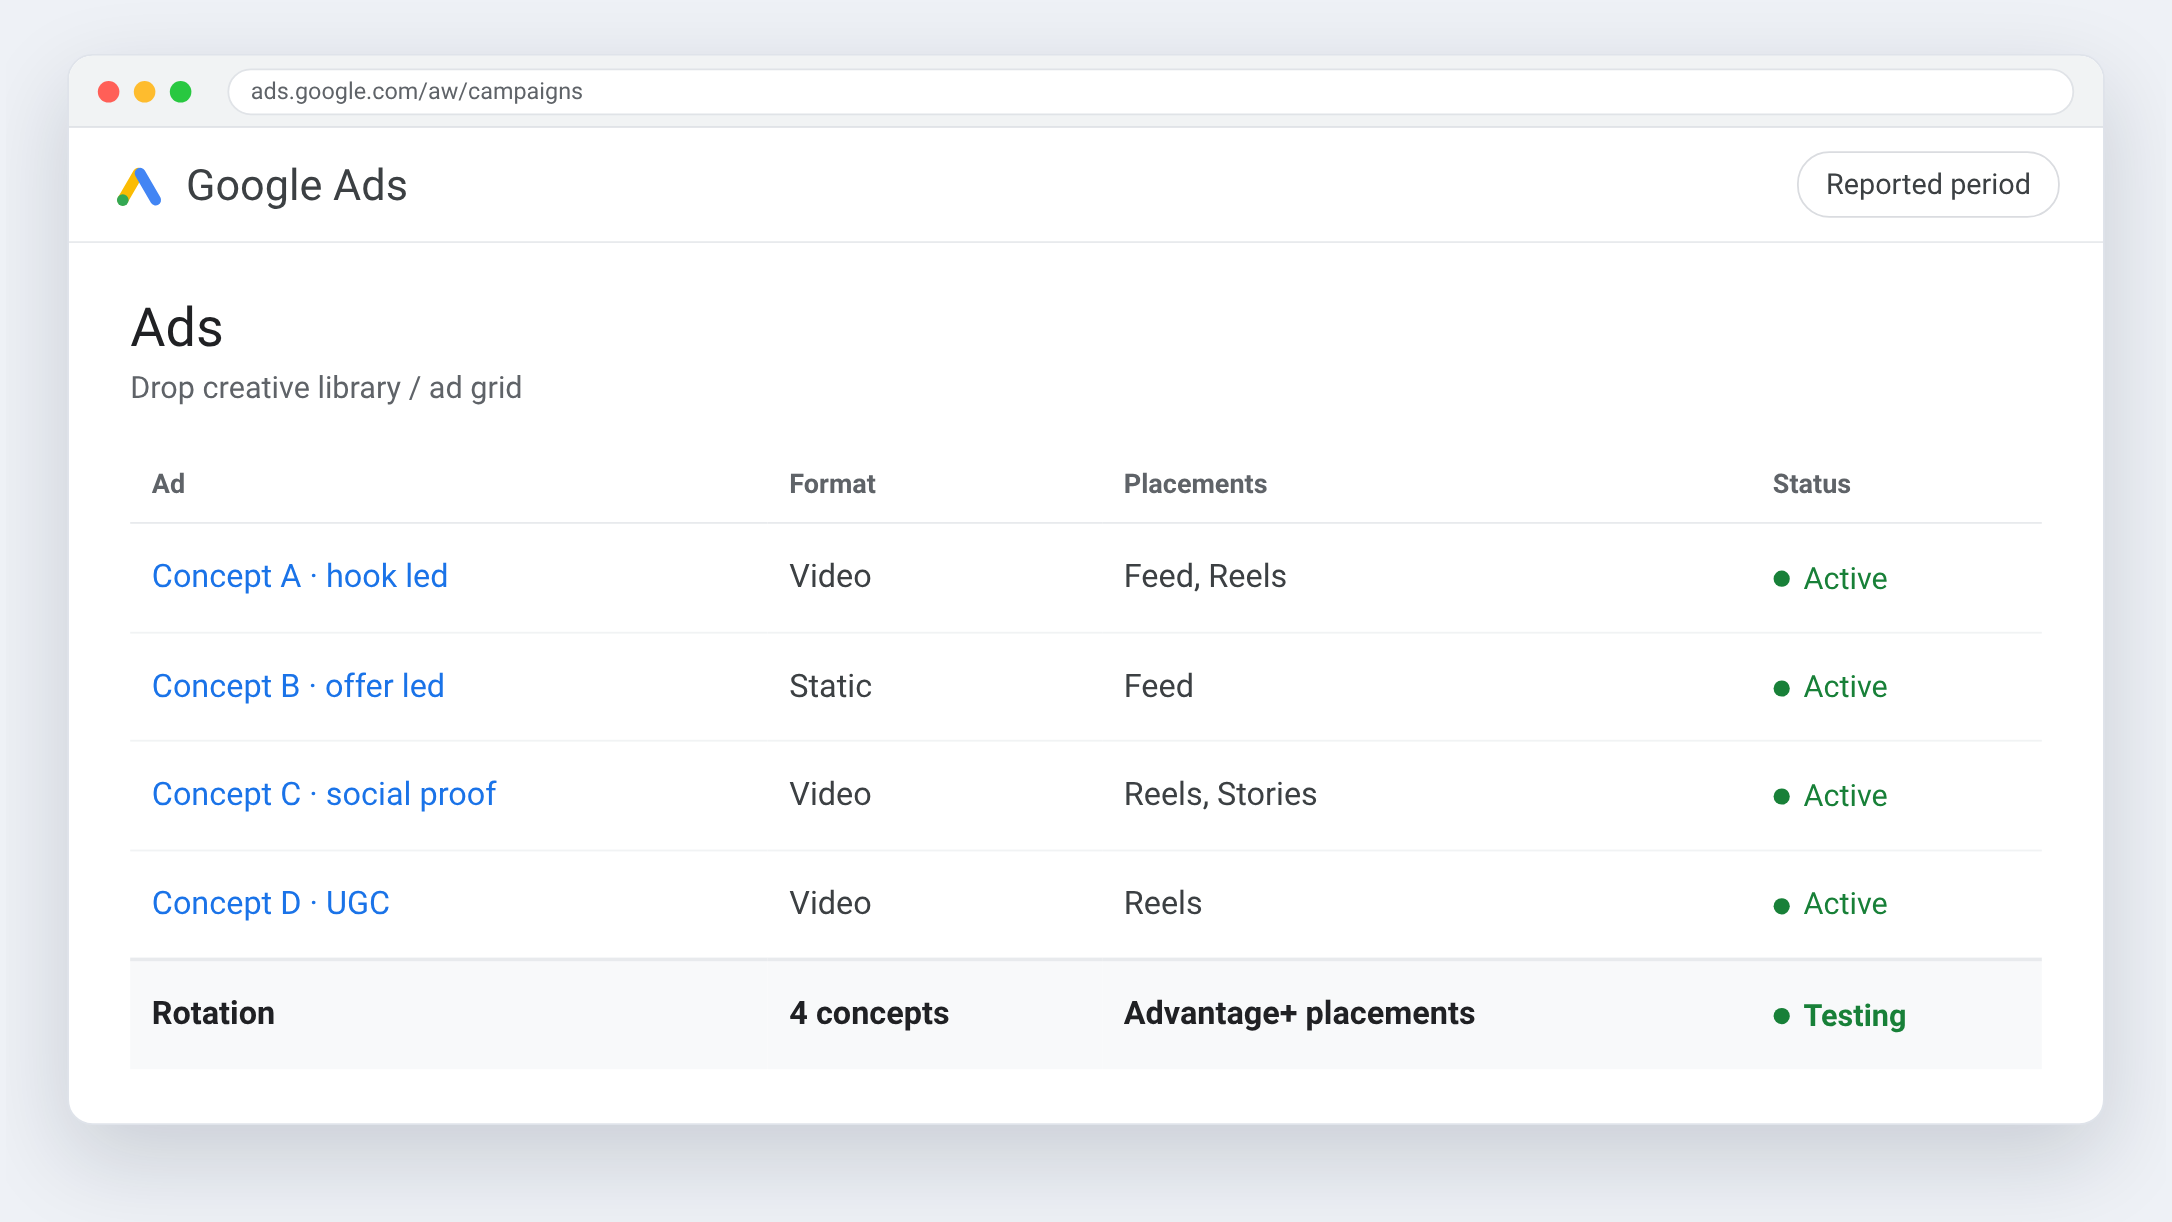
Treat creative volume as the media buy.
At this spend level, the binding constraint is not targeting, it is fresh creative. Audiences saturate in weeks, so the program ran on a continuous concept pipeline — new angles entering against named controls every cycle, retired on fatigue signals rather than on a schedule.
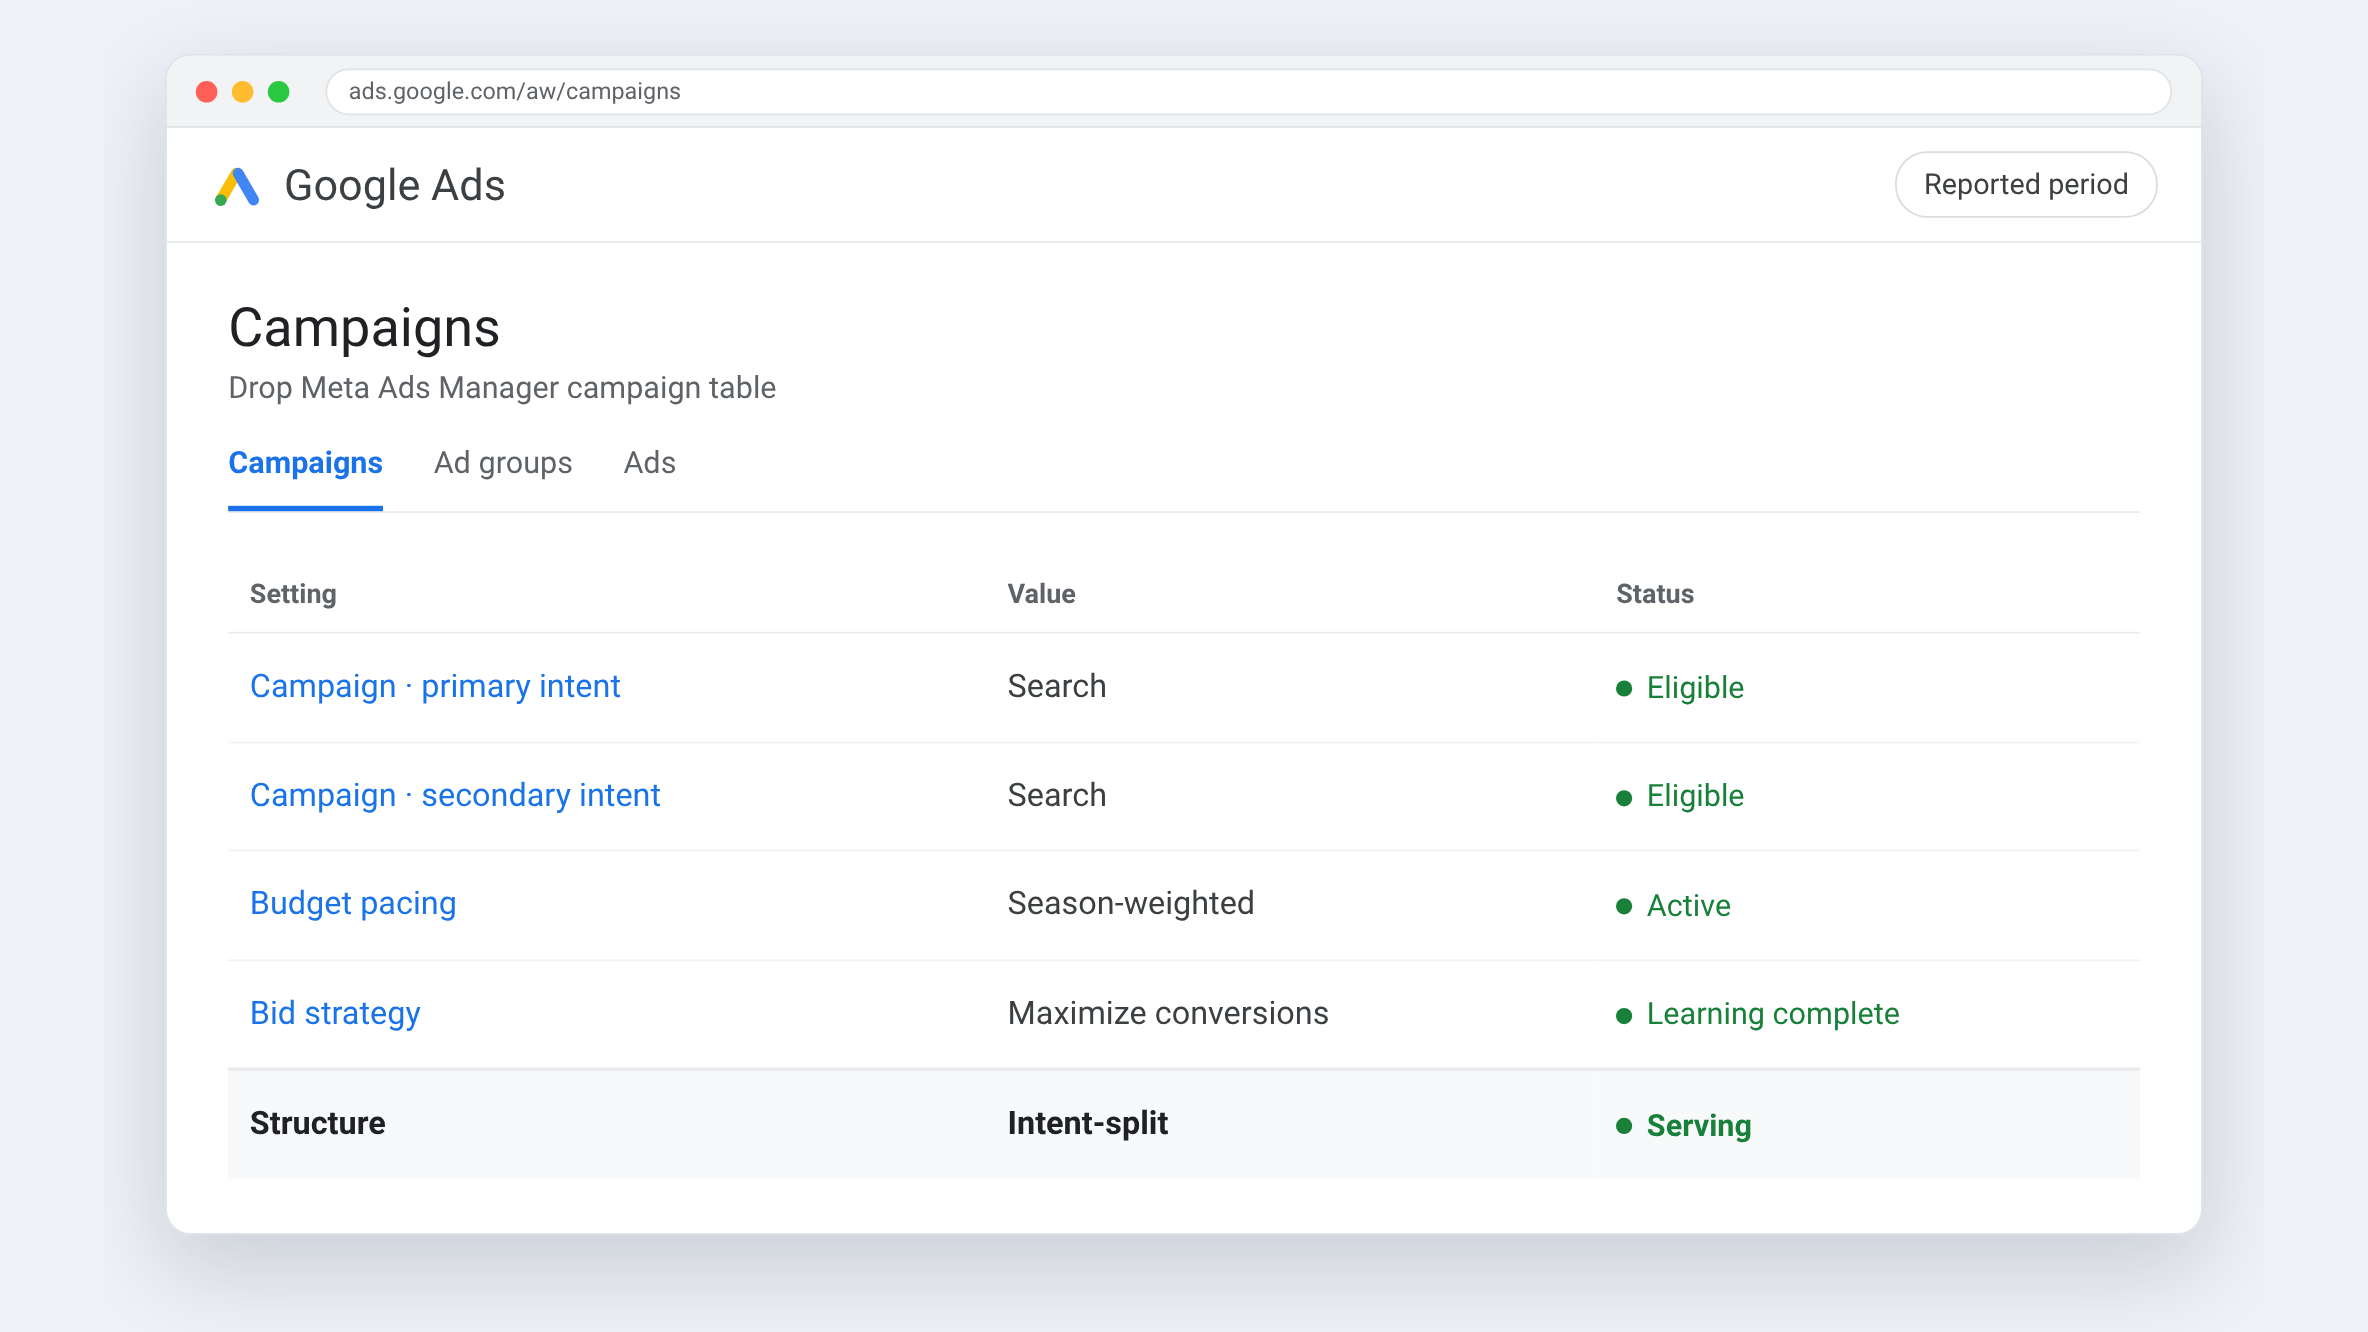
Second, segments were held to their own economics. Two brands run inside this program with genuinely different funnels and cost structures, and blending them into one average cost per lead would have hidden that one of them delivers at a third of the other's cost. Each is reported and optimised separately.
Third, lead quality was measured downstream, not at the form. A cheap lead that never books is more expensive than a costly one that does, so budget followed the segments producing qualified downstream activity rather than the ones producing the lowest headline cost per lead.
03 — What we did
Creative pipeline, separated economics, downstream quality.
Twelve campaigns, two brands, one discipline: never optimise on a blended average.
Creative as the media buy
Continuous concept pipeline, not monthly drops
At half a million a year, audiences saturate in weeks. New angles entered against named controls every cycle and were retired on fatigue signals rather than on a calendar. Creative volume is the actual scaling lever.
Separated economics
Two brands, two sets of numbers
The program runs two brands with different funnels. Blending them into one cost per lead would hide that one delivers at a third of the other's cost, so each is optimised and reported on its own.
Downstream quality
Judged leads on what happened after the form
A cheap lead that never books costs more than an expensive one that does. Budget followed segments producing qualified downstream activity rather than the lowest headline cost per lead.
Reported at true scale
Cost held steady at high spend
Volume is reported in absolute terms at a spend level where holding cost per lead steady is the real achievement — and it held, month after month, across both brands.

04 — The results
16,387 leads from CA$548,255 — and CA$11.18 in the best segment.
The stack we ran it on

Meta Ads Manager
Paid social
Meta Conversions API
Tracking

GA4
Analytics

Google Ads
Paid search

CRM lead sync
Tracking

Google Tag Manager
Tracking

AgencyAnalytics
Reporting

Looker Studio
Dashboards
CASE STUDIES
Video Ads
Static Ads
























































































































































Farrukh Ahmed CPA — Local SEO launch
position 50 → 17 · +166% desktop map impressions




Food Allergy Institute — Paid media and booked consultations
243 → 1,012 consultations/mo · cost per landing page view −30%






























































National Consumer Panel — UGC-driven acquisition & paid media
CPI −30% · CPA −20%


National Debt Relief — UGC, performance creative & influencer strategy
CVR +25% · CAC −30%





New Balance — Casting, post-production & influencer marketing
7 athletes · 750k audience
















































"Their transparency, attention to detail, and collaborative approach made them feel like an extension of our own team."


.webp)
.webp)


