

Texas JDM Motors · Automotive parts · Paid search · 2026
How Texas JDM Motors tripled revenue and doubled its return at the same time
An importer of Japanese engines and parts, competing nationally on high-ticket items with long consideration windows. In twelve months: revenue from $508k to $1.48M, and return from 6.97× to 13.61×.


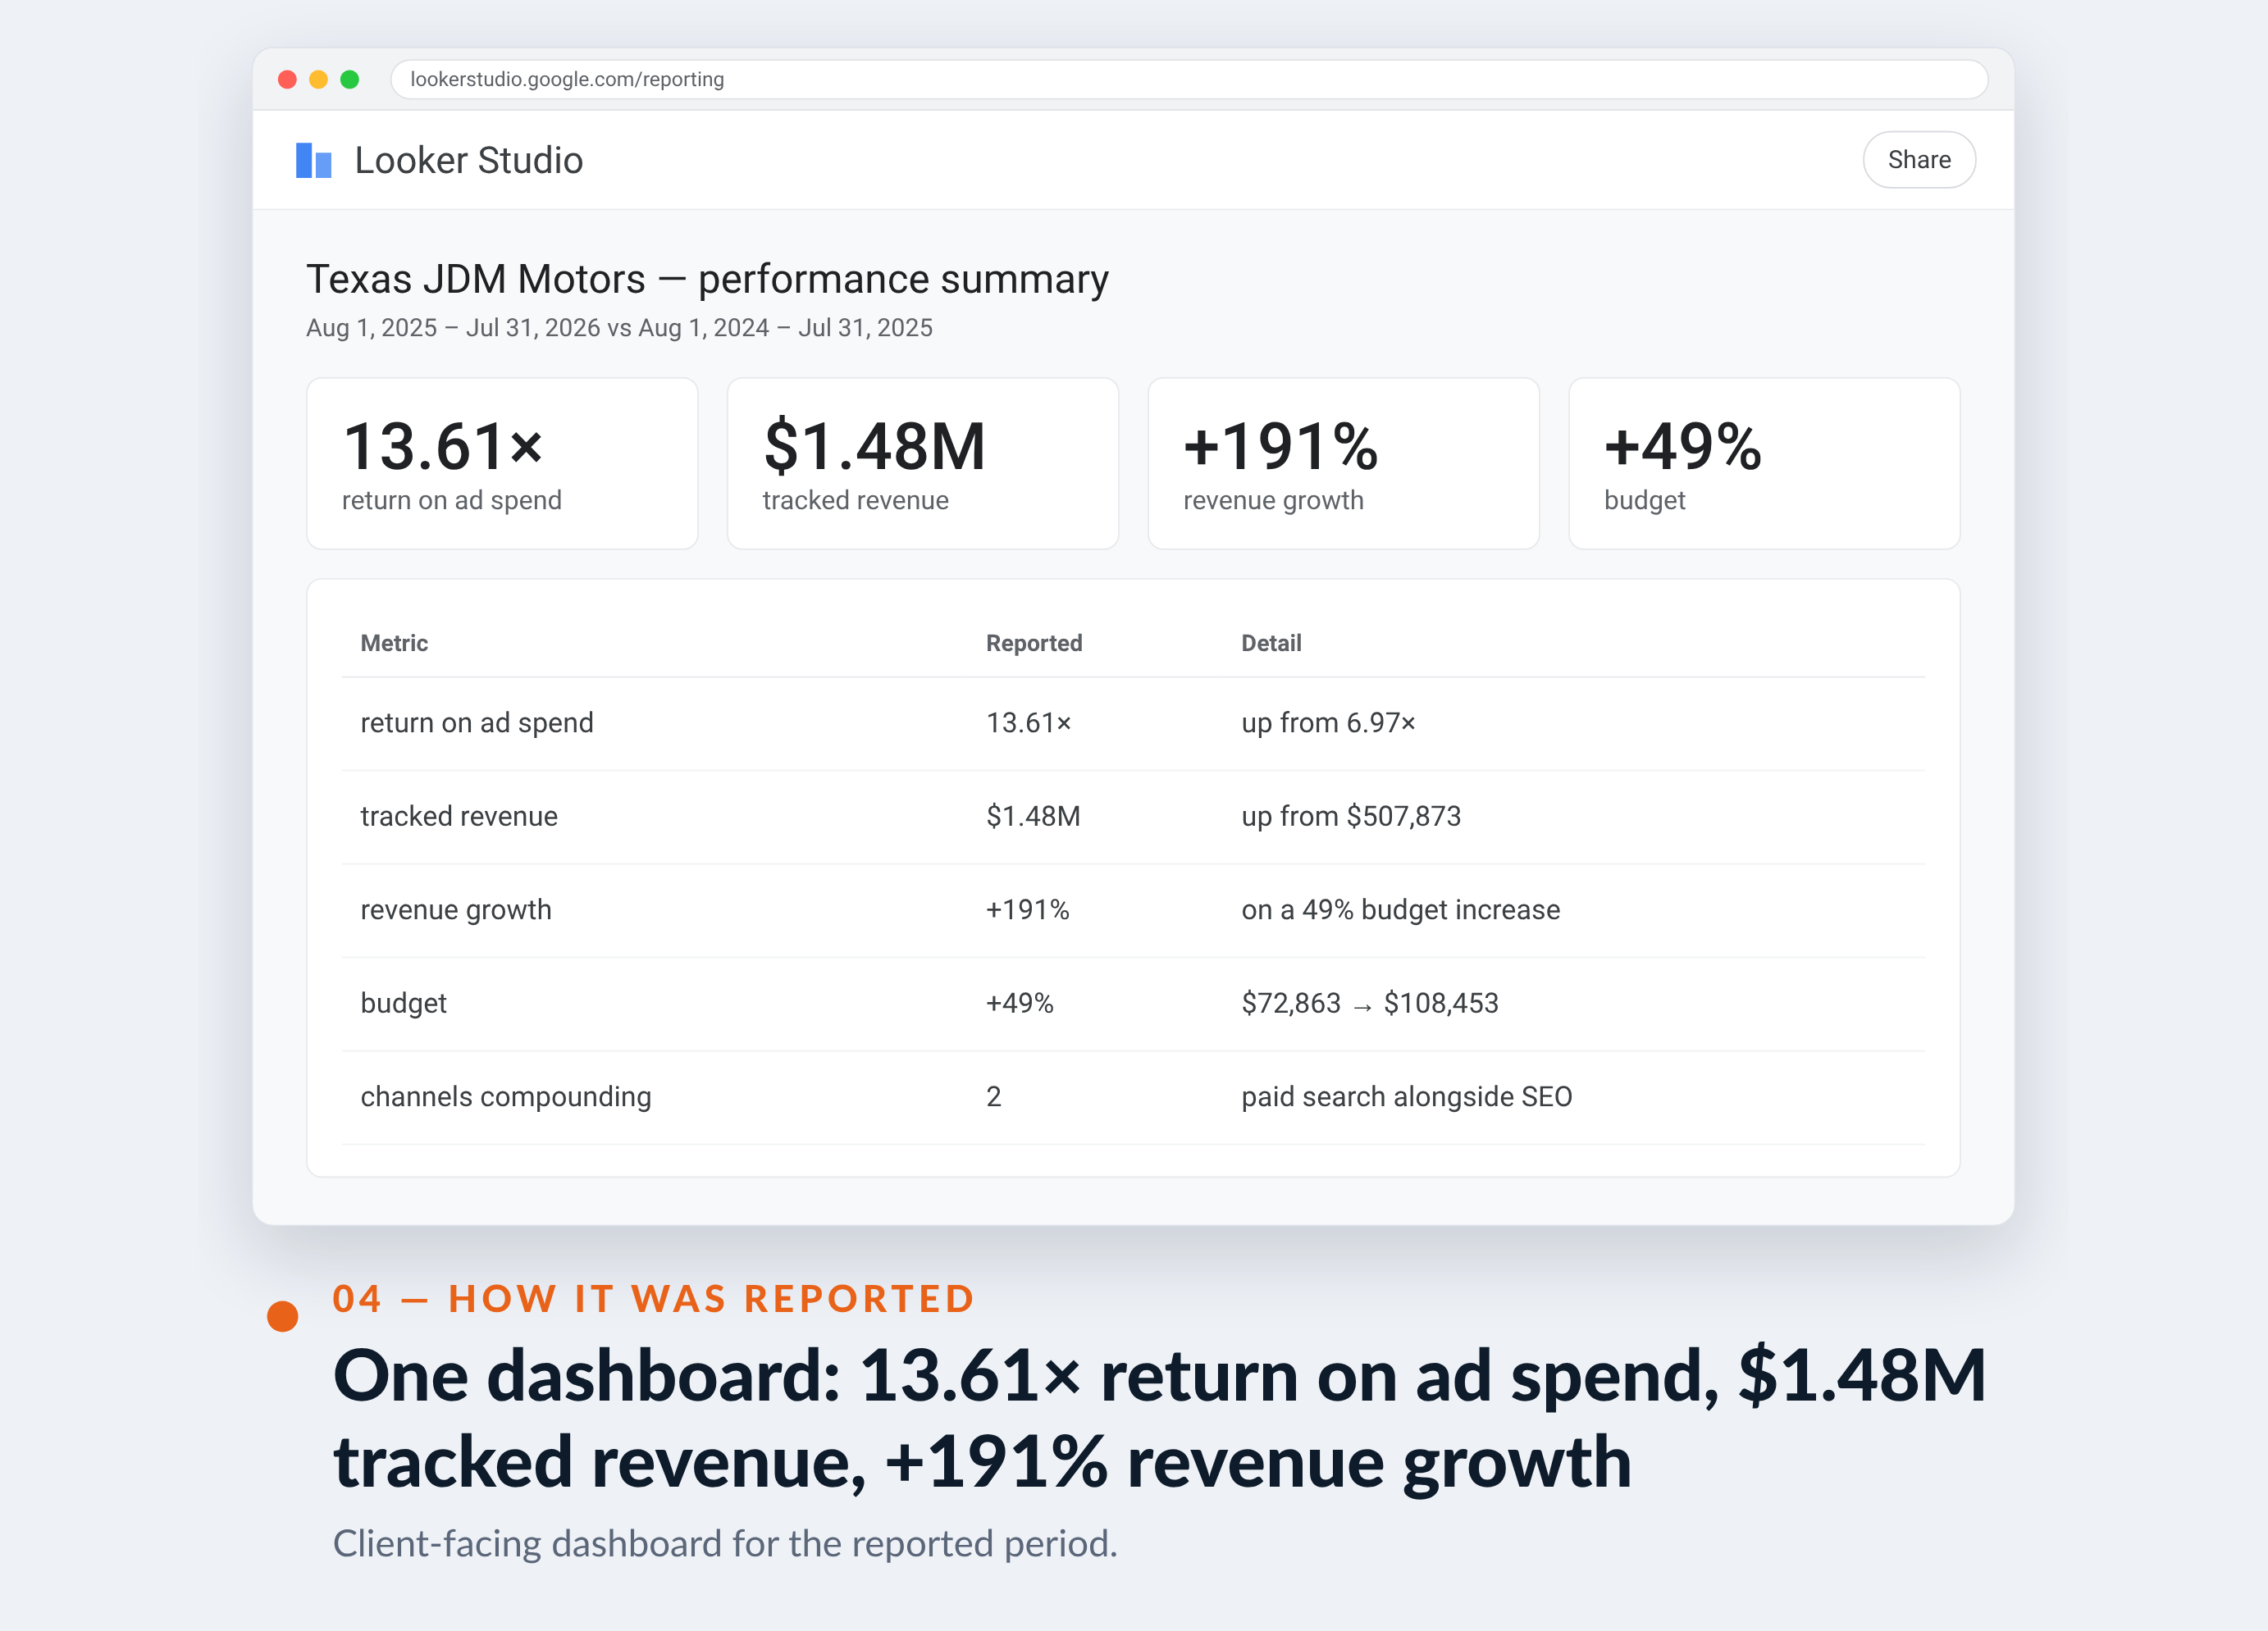
13.61×
return on ad spend
up from 6.97× year over year
The results, up top — every number is in the strip below
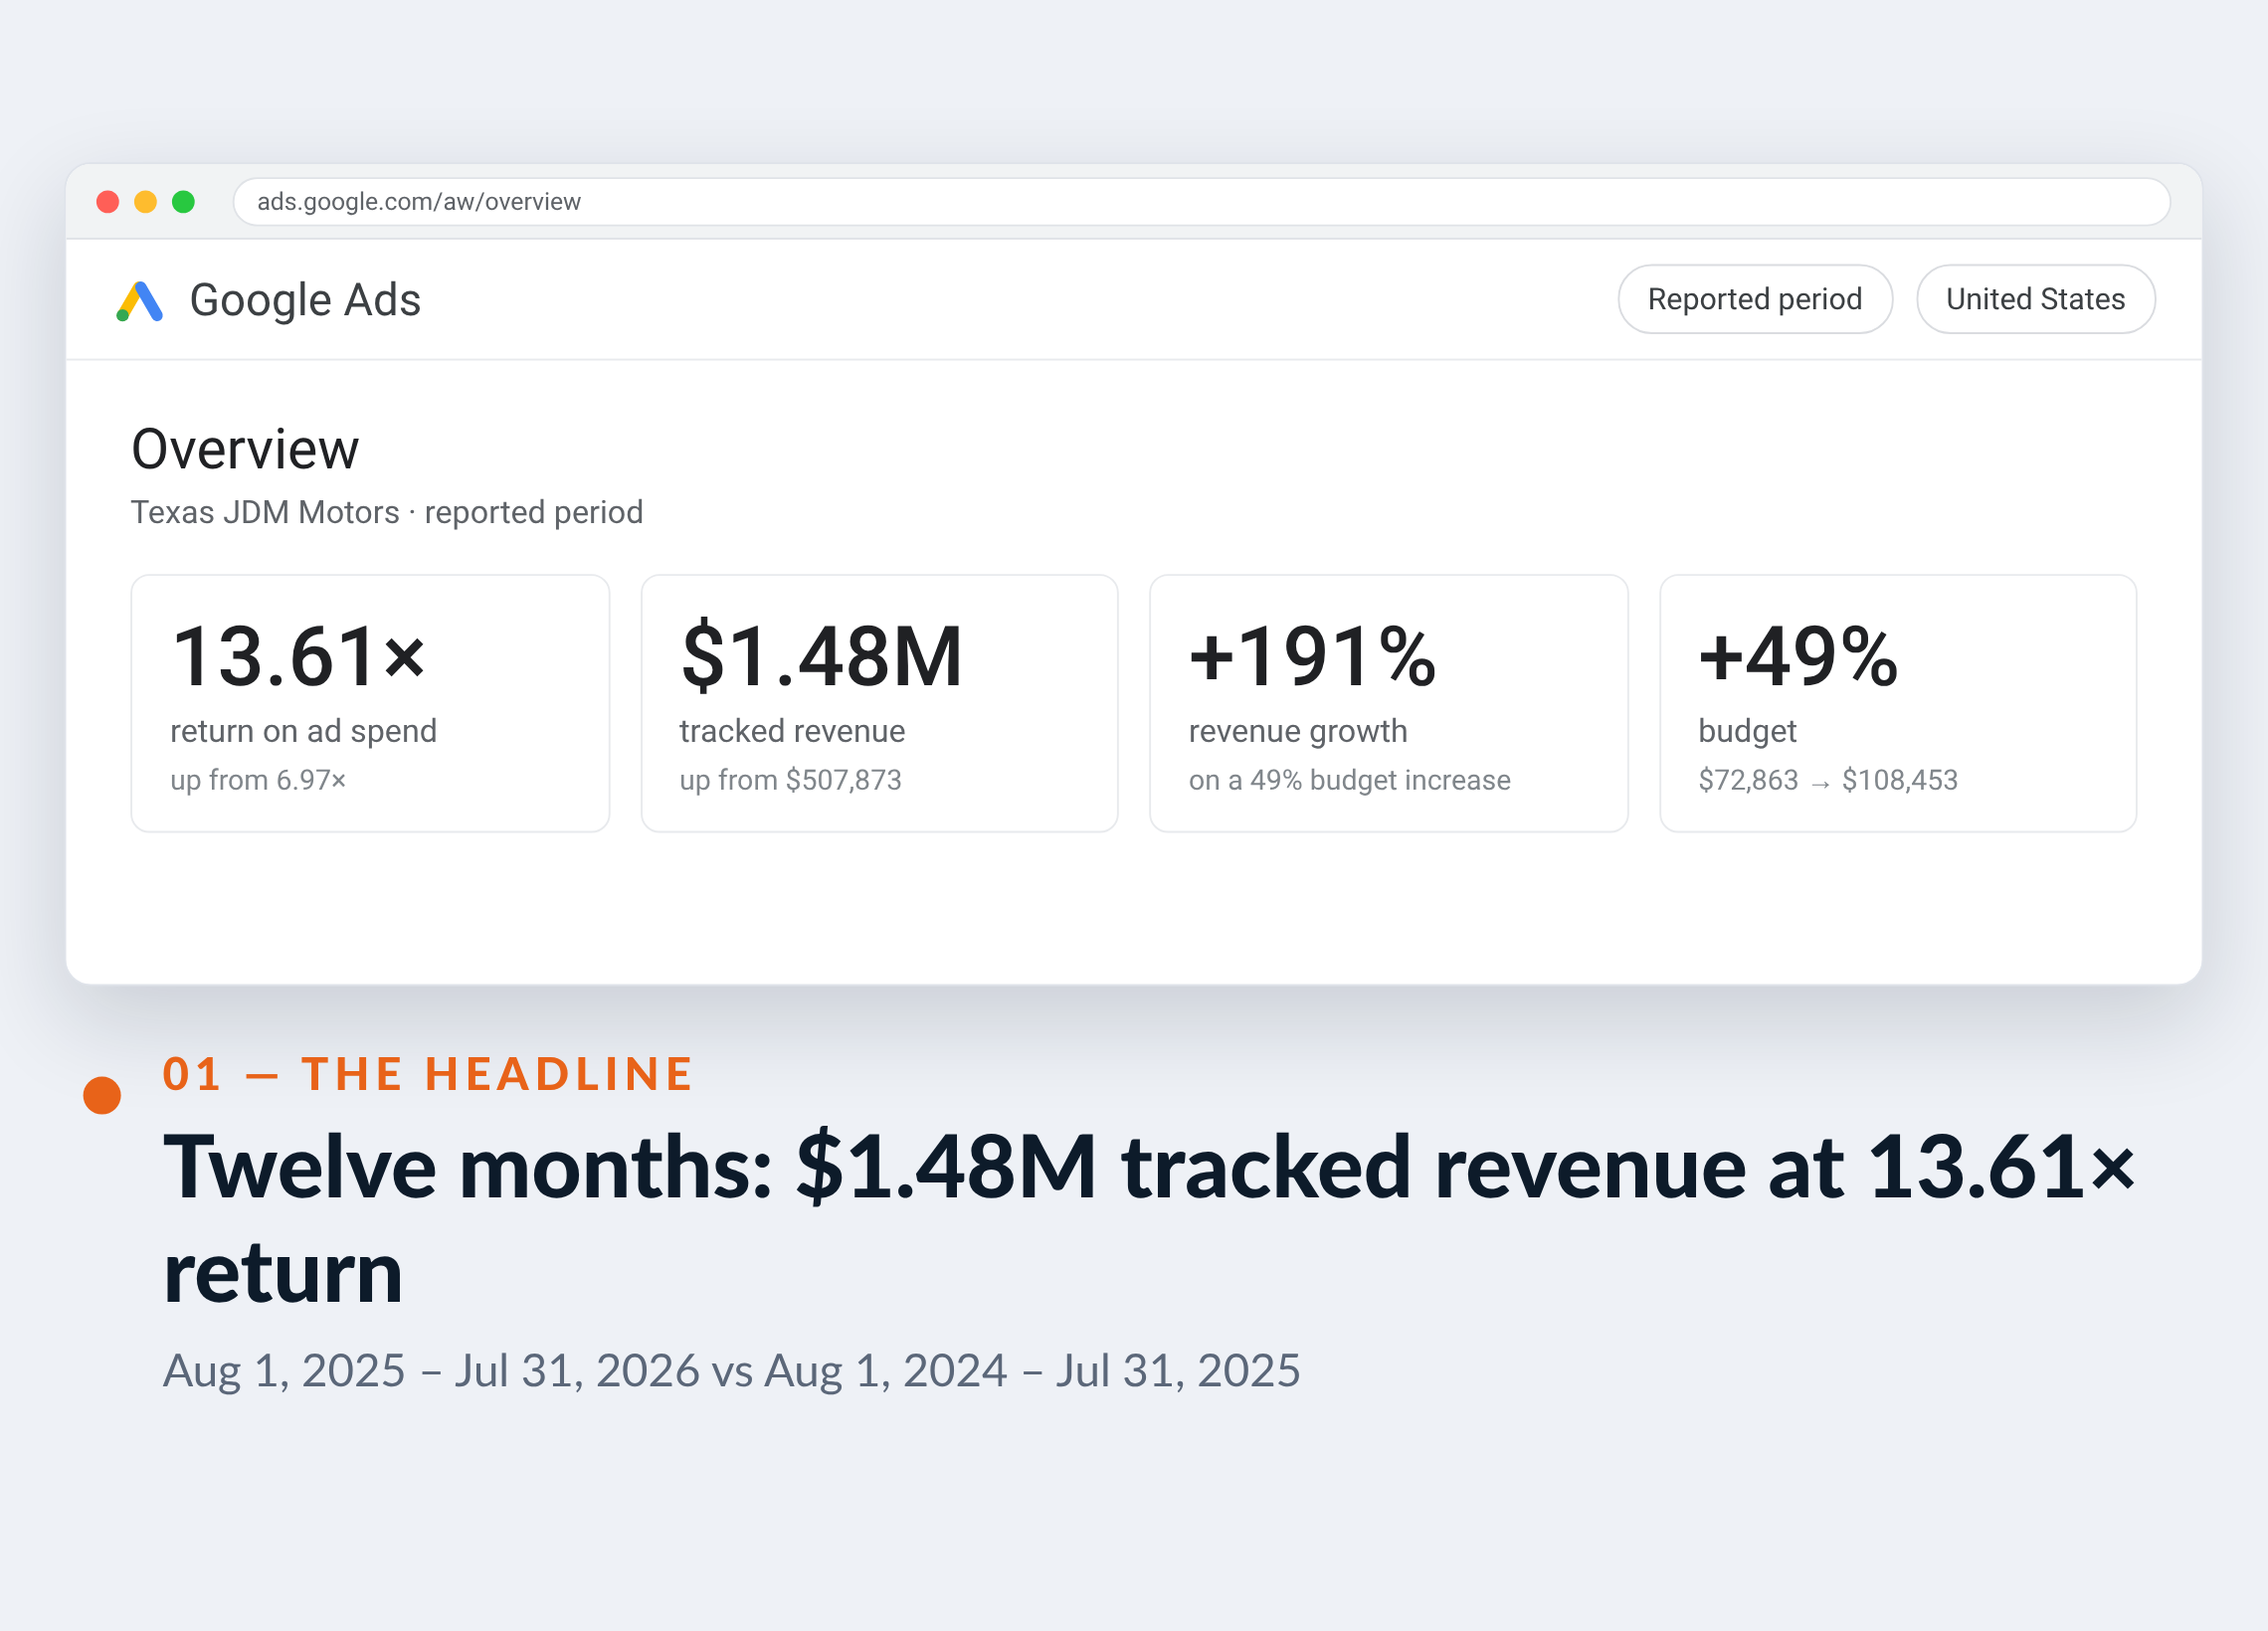
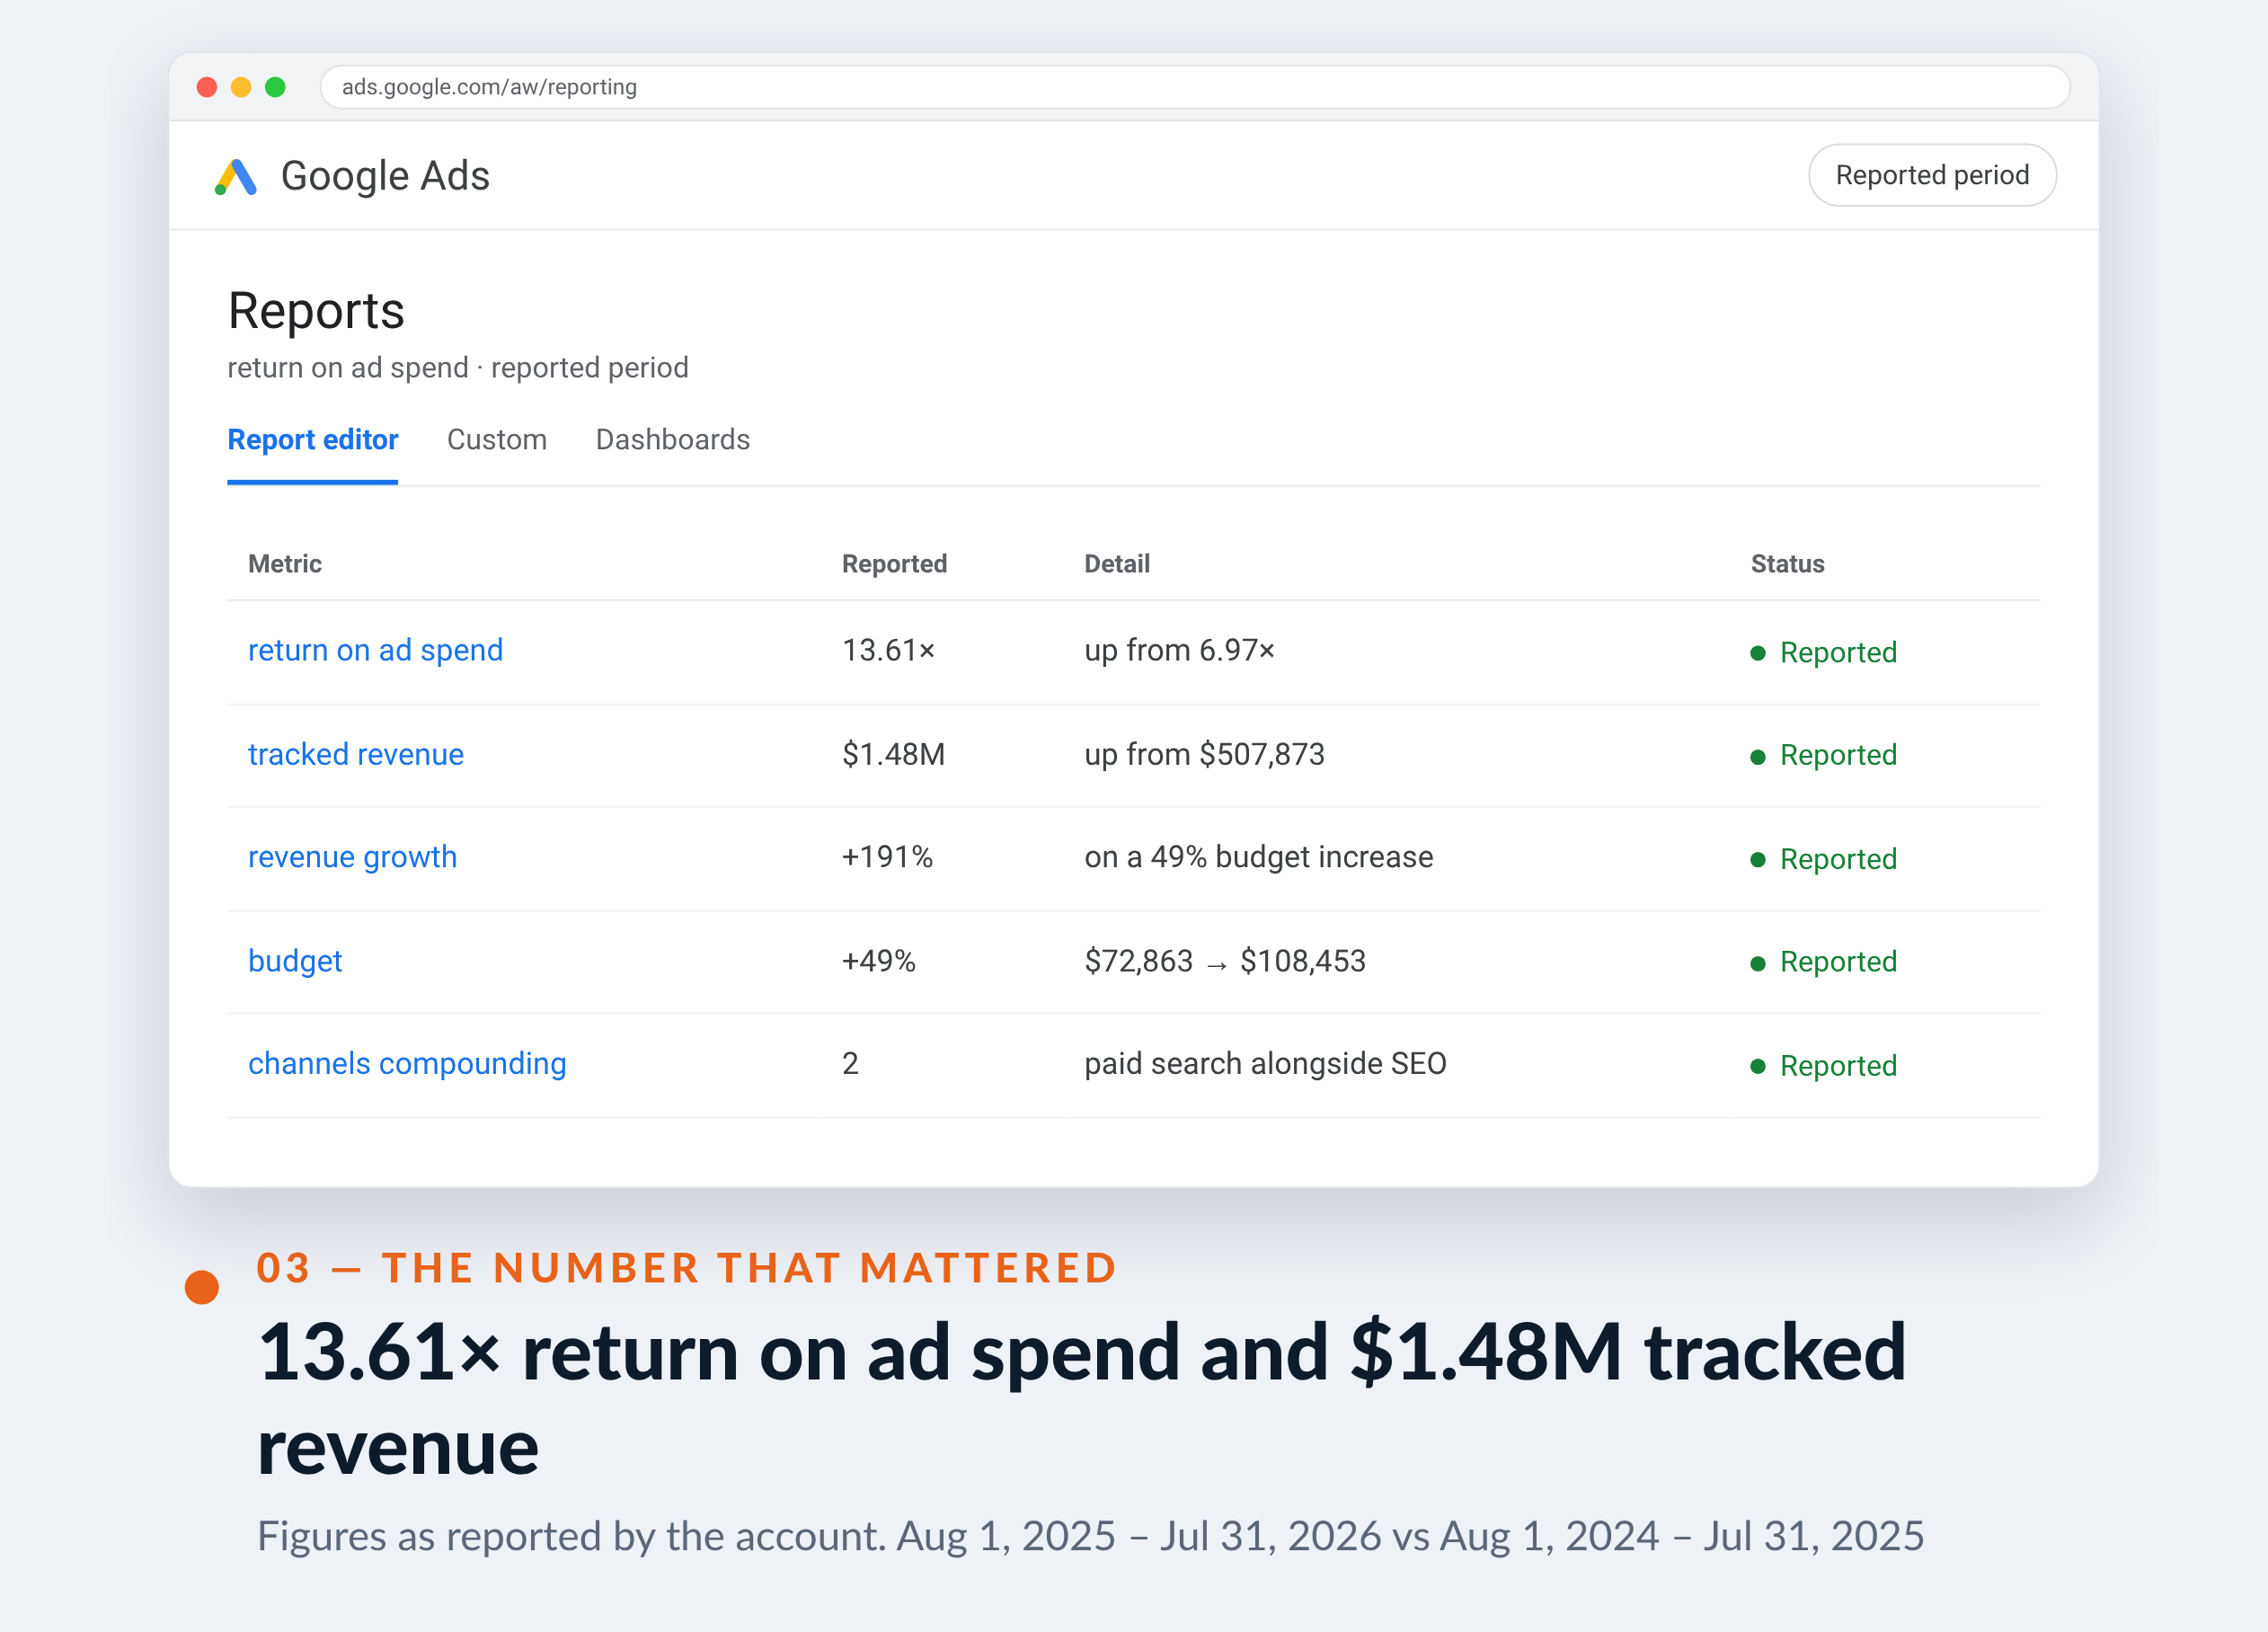
13.61×
return on ad spend
up from 6.97×
$1.48M
tracked revenue
up from $507,873
+191%
revenue growth
on a 49% budget increase
+49%
budget
$72,863 → $108,453
2
channels compounding
paid search alongside SEO


01 — The challenge
High-ticket parts, long research cycles, national competition.
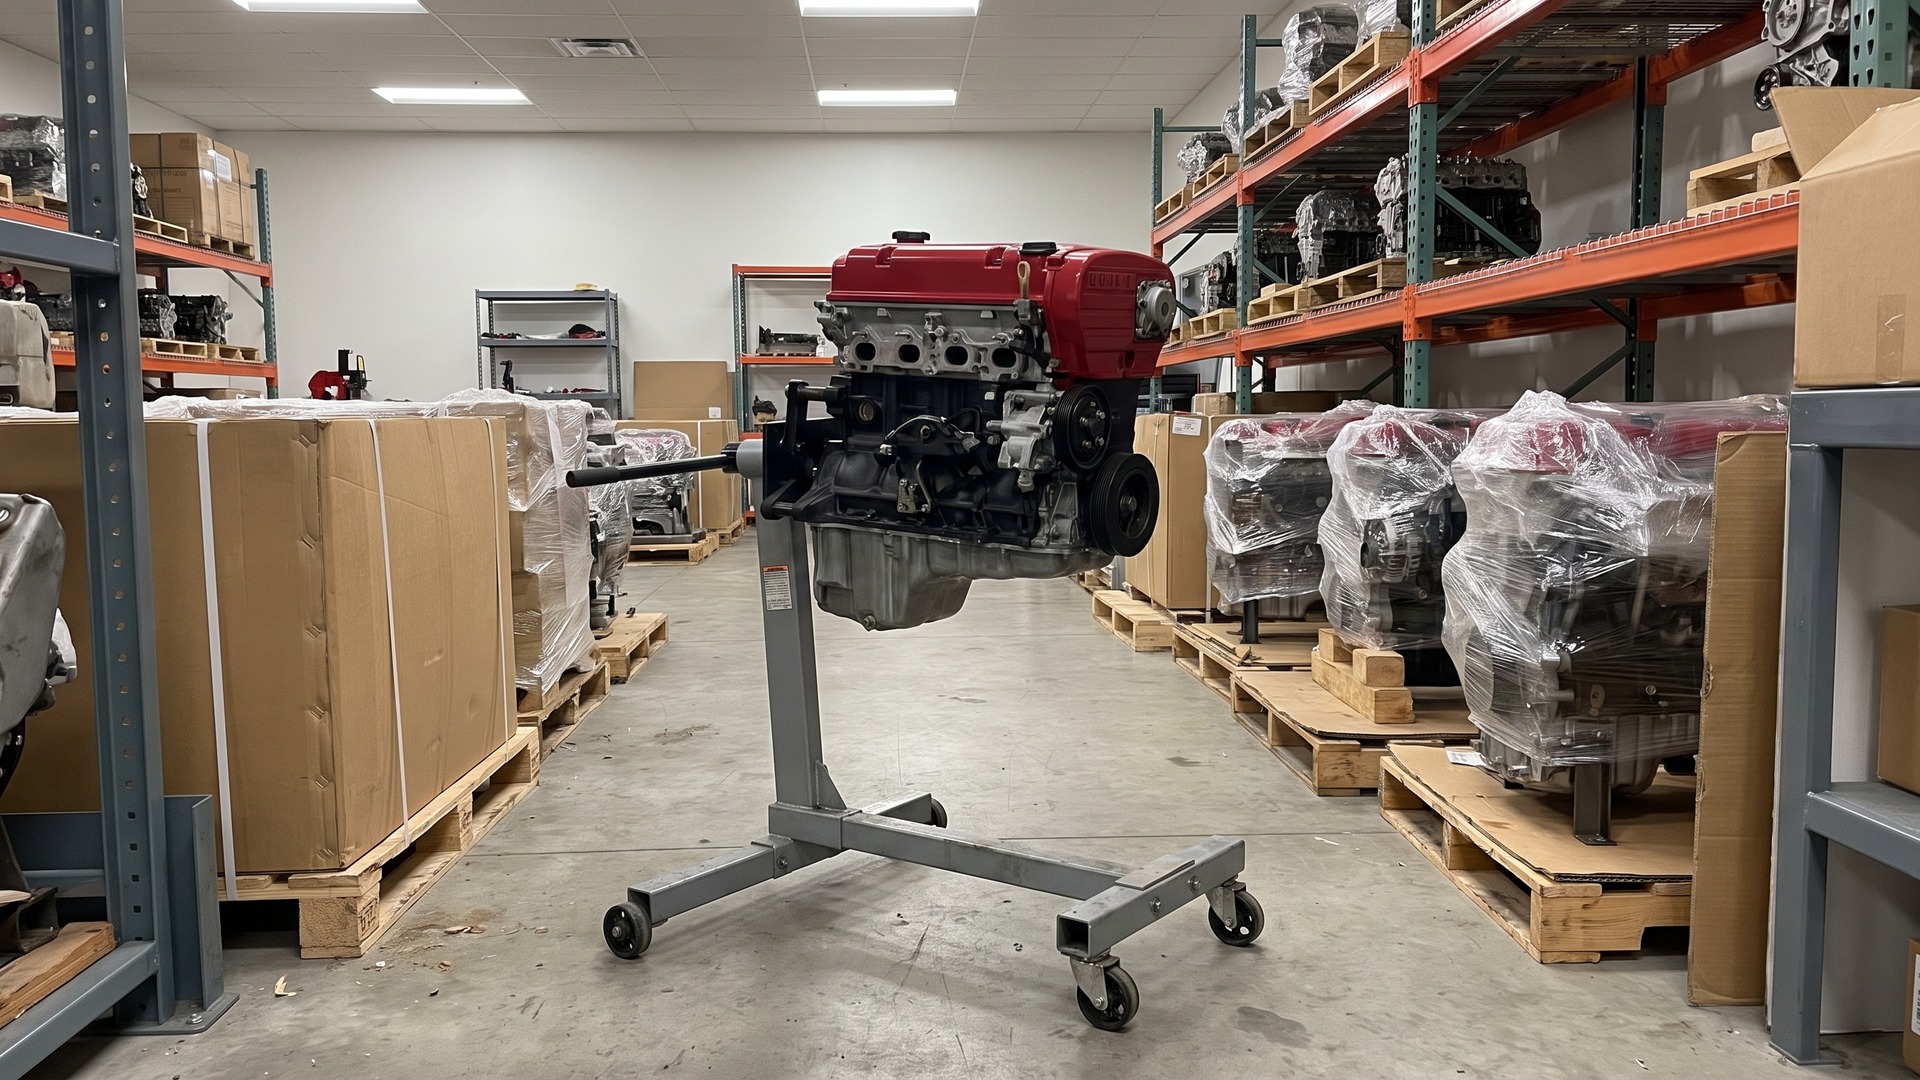
Texas JDM Motors imports and sells Japanese engines and drivetrain parts across the United States. Average order values run into the thousands, buyers research for weeks across forums and marketplaces, and the auction includes national retailers with far bigger budgets.
The account was already returning 6.97×, which sounds like a finished job. What it actually reflected was a narrow slice of demand being harvested well while the broader catalogue went unsold and the reporting could not distinguish between the two.
“We sell engines, not t-shirts. Somebody researches for three weeks and then spends four thousand dollars in one click, and for years I could not tell which of my ads deserved the credit for that.”
High ticket plus long consideration is the hardest combination to attribute, and it is exactly where most accounts quietly overspend on the last click and underfund everything that made the sale possible.
02 — Our approach
Sell the catalogue, not just the bestsellers.
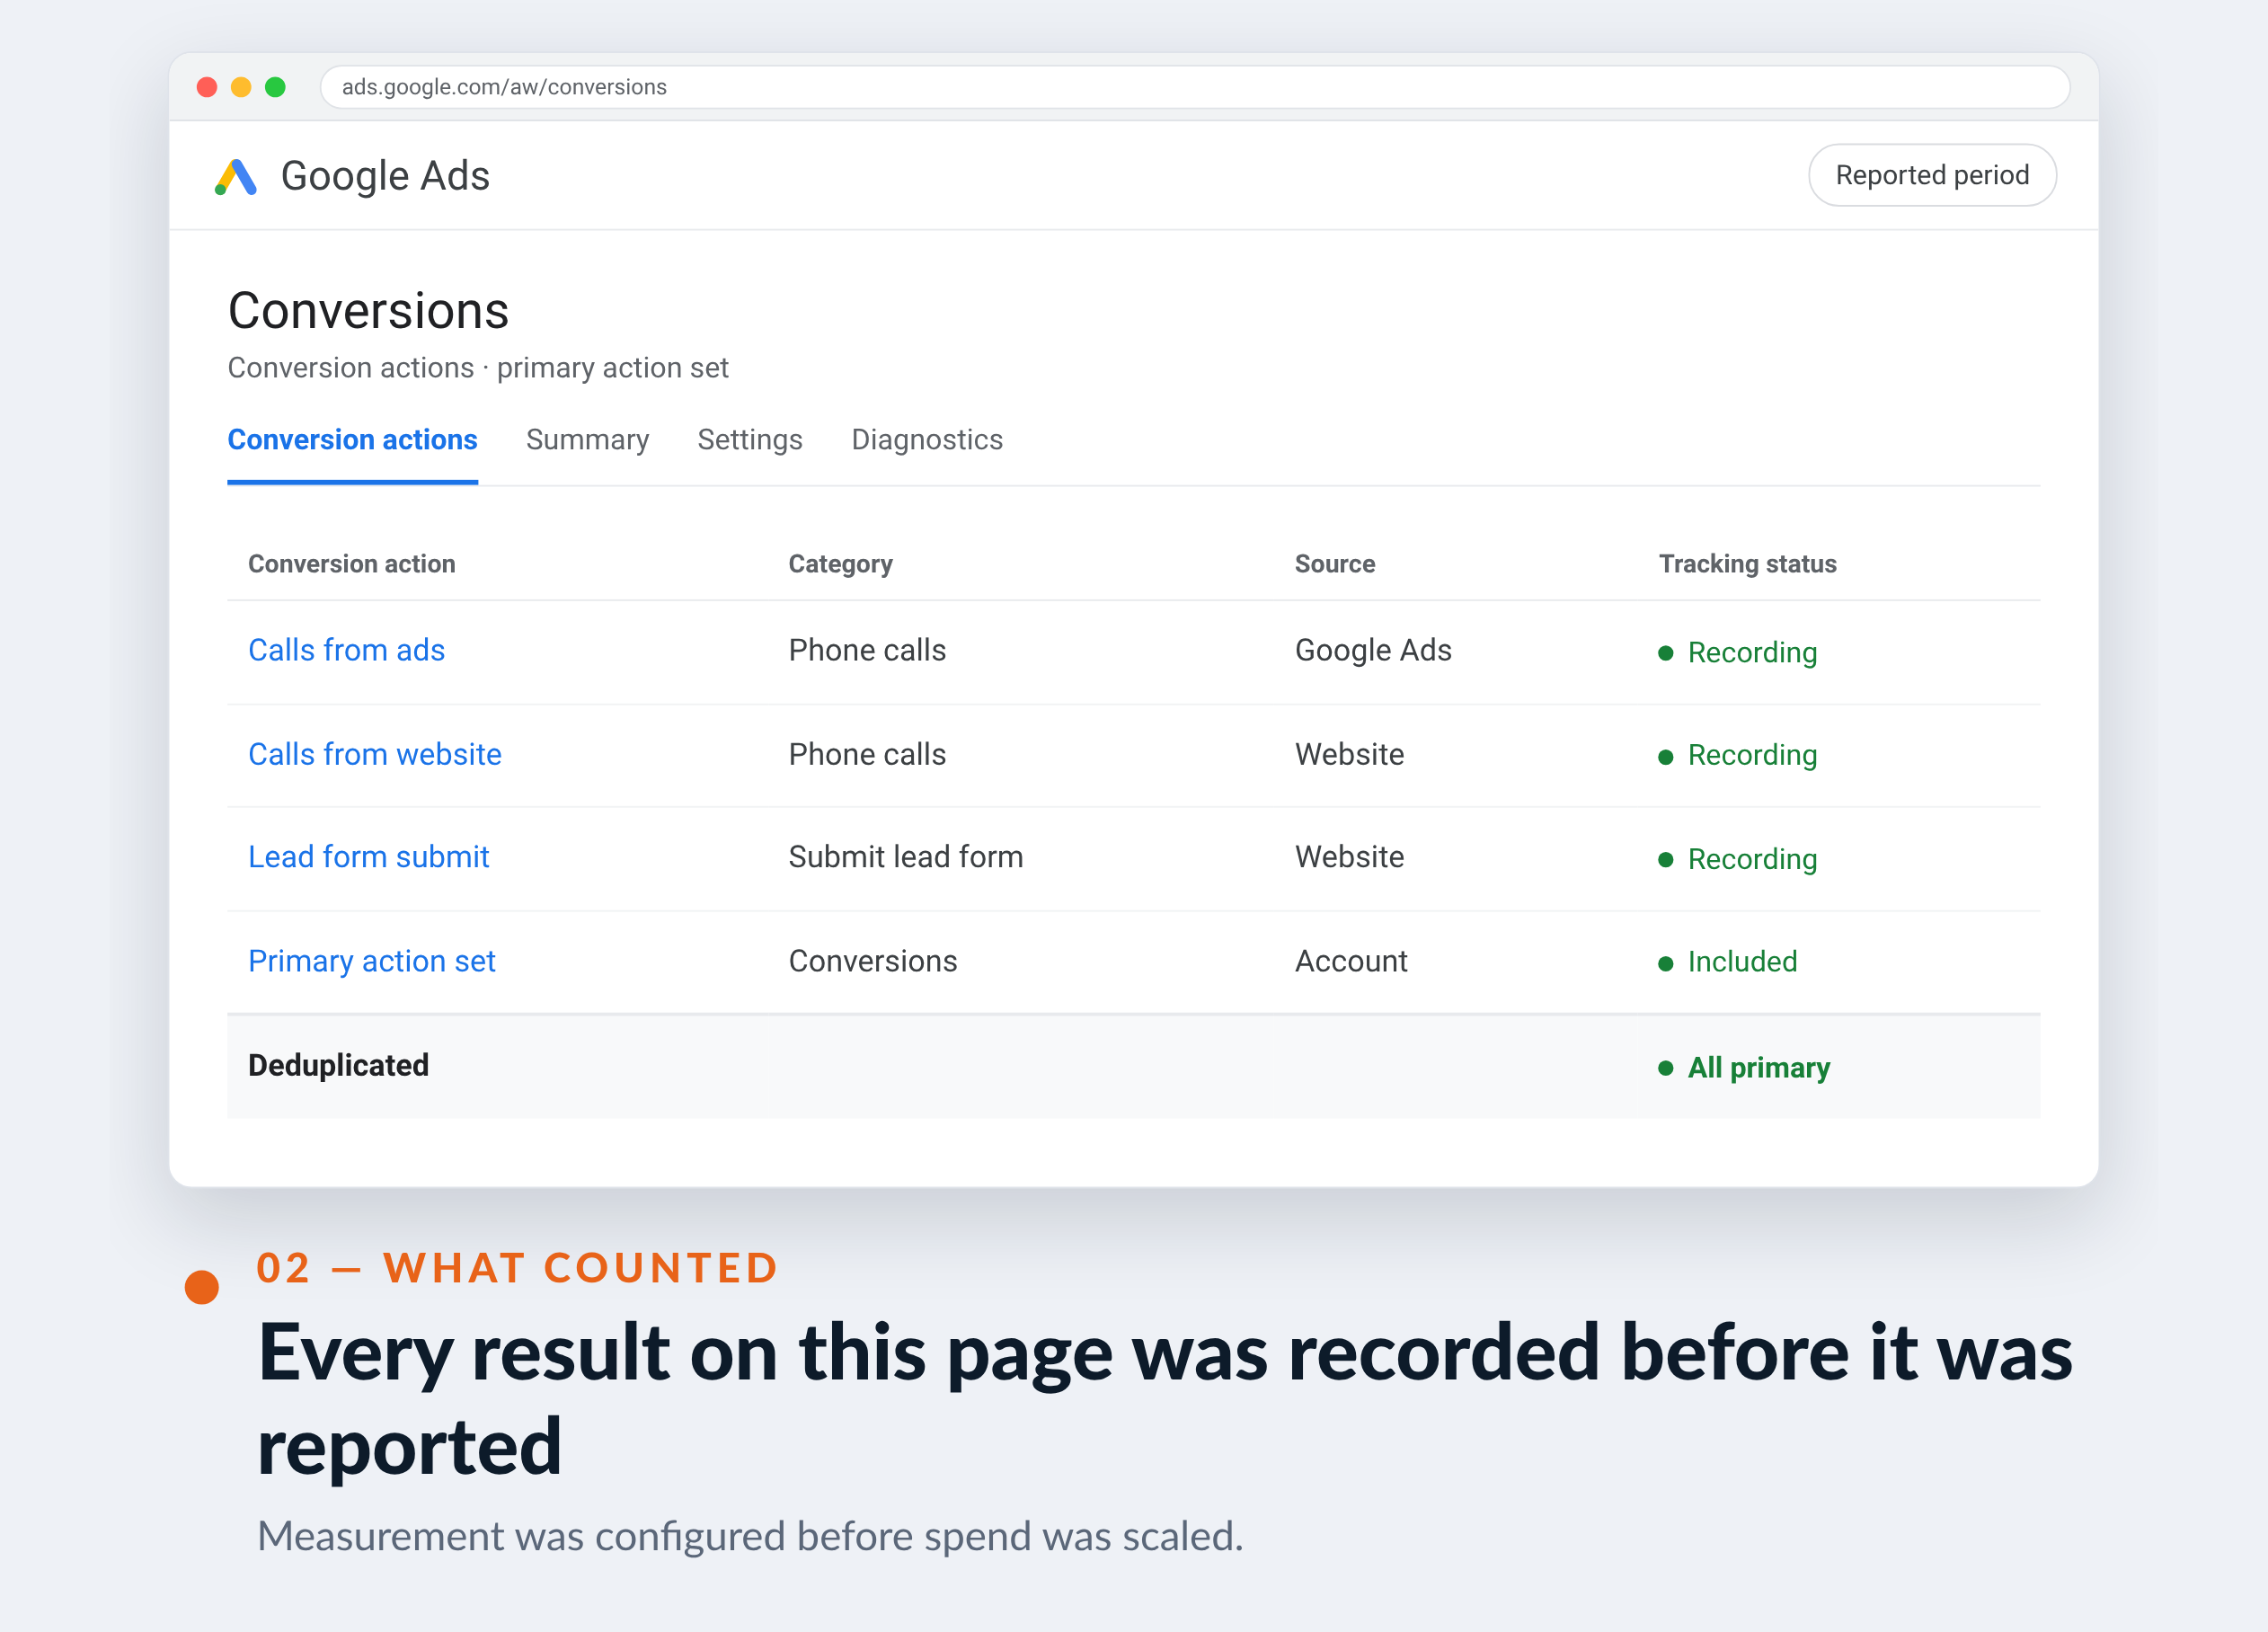
The work started by making revenue — not conversion count — the operating metric, because in a catalogue with this much price variance a conversion count is close to meaningless. Every claim on this page is revenue and return for exactly that reason.
Coverage then expanded past the handful of engine models that were carrying the account. Search-term mining turned real buyer language — specific engine codes, chassis fitments, part numbers — into structured coverage, so demand that existed but was never bid on started converting.
Alongside that, feed and page quality were treated as performance levers: correct fitment data, availability and pricing, so the products with margin were the ones earning impressions. Budget then followed proven revenue by product family rather than being spread evenly.

03 — What we did
Measure revenue, widen coverage, fix the feed, follow the margin.
Growth here came from selling more of the catalogue, not from bidding harder on the same ten searches.
Metric discipline
Judged the account on revenue, not conversion count
With order values ranging from small parts to complete engines, a conversion count tells you almost nothing. Revenue and return became the only operating metrics — which is also why this page makes no claim about order counts.
Coverage expansion
Bid the language buyers actually use
Engine codes, chassis fitments and part numbers mined from search terms and built into structured coverage. Demand that already existed but was never bid on became the largest single source of new revenue.
Feed & fitment quality
Impressions to the products that carry margin
Fitment data, availability and pricing corrected so high-margin inventory earned the impressions. In a parts catalogue, feed quality is a bidding lever disguised as a data-entry job.
Budget allocation
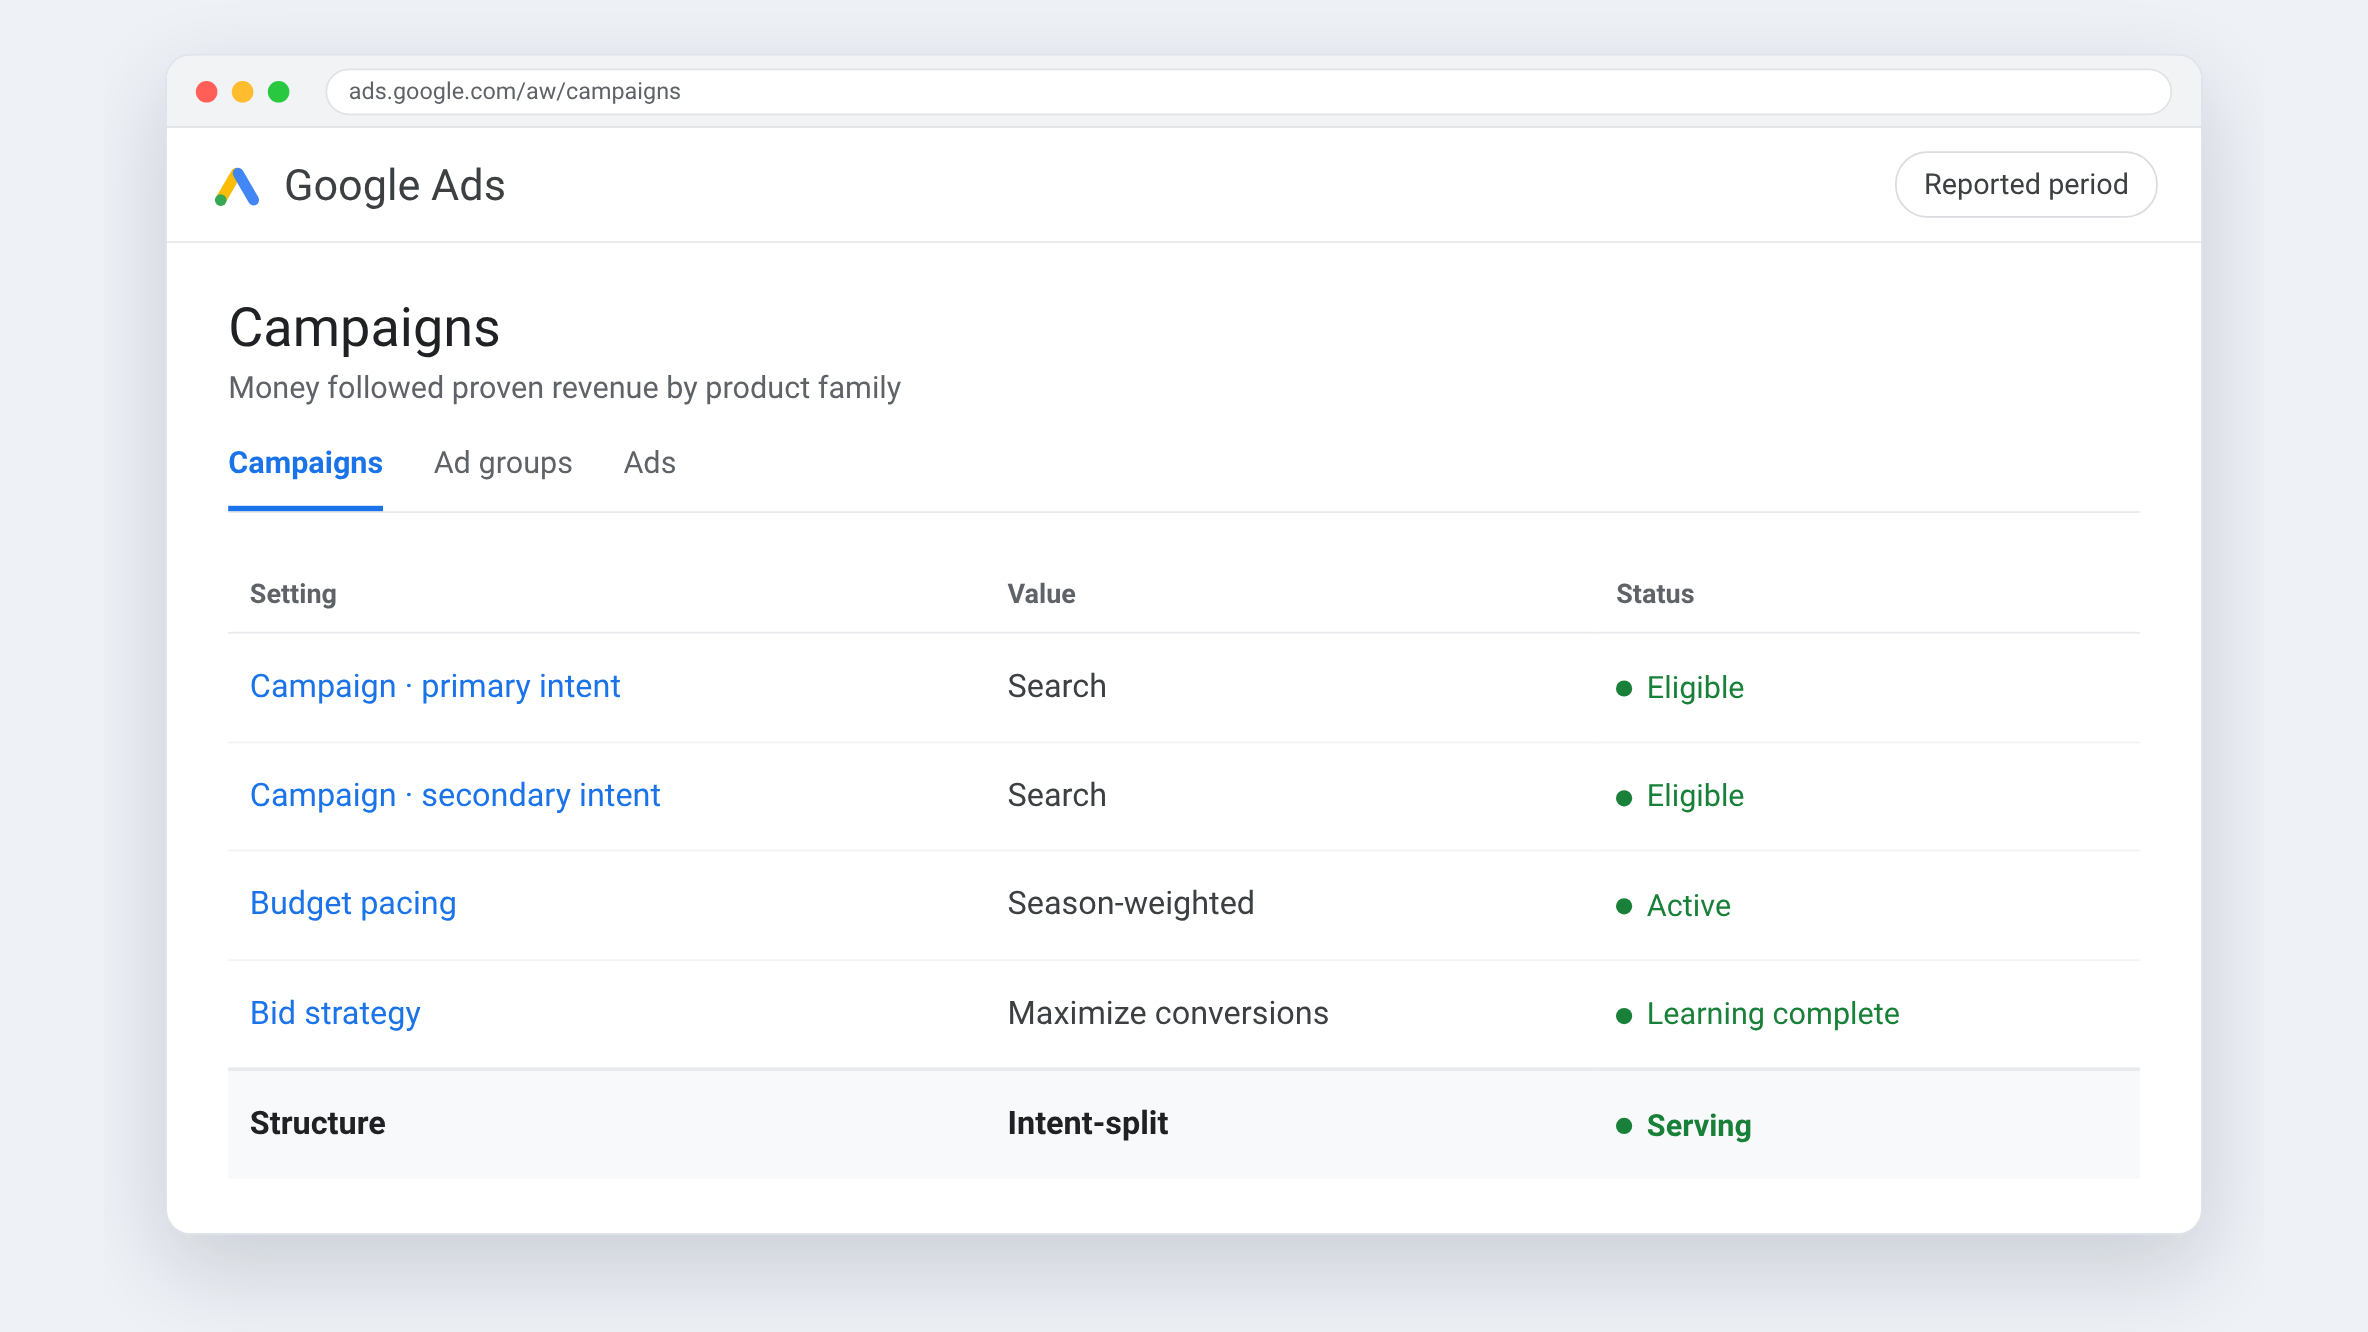
Money followed proven revenue by product family
Instead of spreading budget evenly, allocation was rebalanced monthly toward the product families demonstrating return, in increments that did not disturb learning.

04 — The results
Twelve months: $1.48M tracked revenue at 13.61× return.
The stack we ran it on

Google Ads
Paid search

Google Merchant Center
Feed

GA4
Analytics

Google Tag Manager
Tracking

Google Search Console
SEO

Ahrefs
SEO

AgencyAnalytics
Reporting

Looker Studio
Dashboards

















































Farrukh Ahmed CPA — Local SEO launch
position 50 → 17 · +166% desktop map impressions




Food Allergy Institute — Paid media and booked consultations
243 → 1,012 consultations/mo · cost per landing page view −30%

























































National Consumer Panel — UGC-driven acquisition & paid media
CPI −30% · CPA −20%


National Debt Relief — UGC, performance creative & influencer strategy
CVR +25% · CAC −30%





New Balance — Casting, post-production & influencer marketing
7 athletes · 750k audience













































"Their transparency, attention to detail, and collaborative approach made them feel like an extension of our own team."


.webp)
.webp)


