

Urgence Toiture Montréal · Emergency roofing · Google Ads — Search · 2026
How a 24/7 roofing service turned storm weeks into 328 enquiries
Emergency roofing demand does not arrive evenly. It arrives with weather. The account's job is to be there in the hours after a leak starts, and to not burn the budget in the weeks when nothing is dripping.

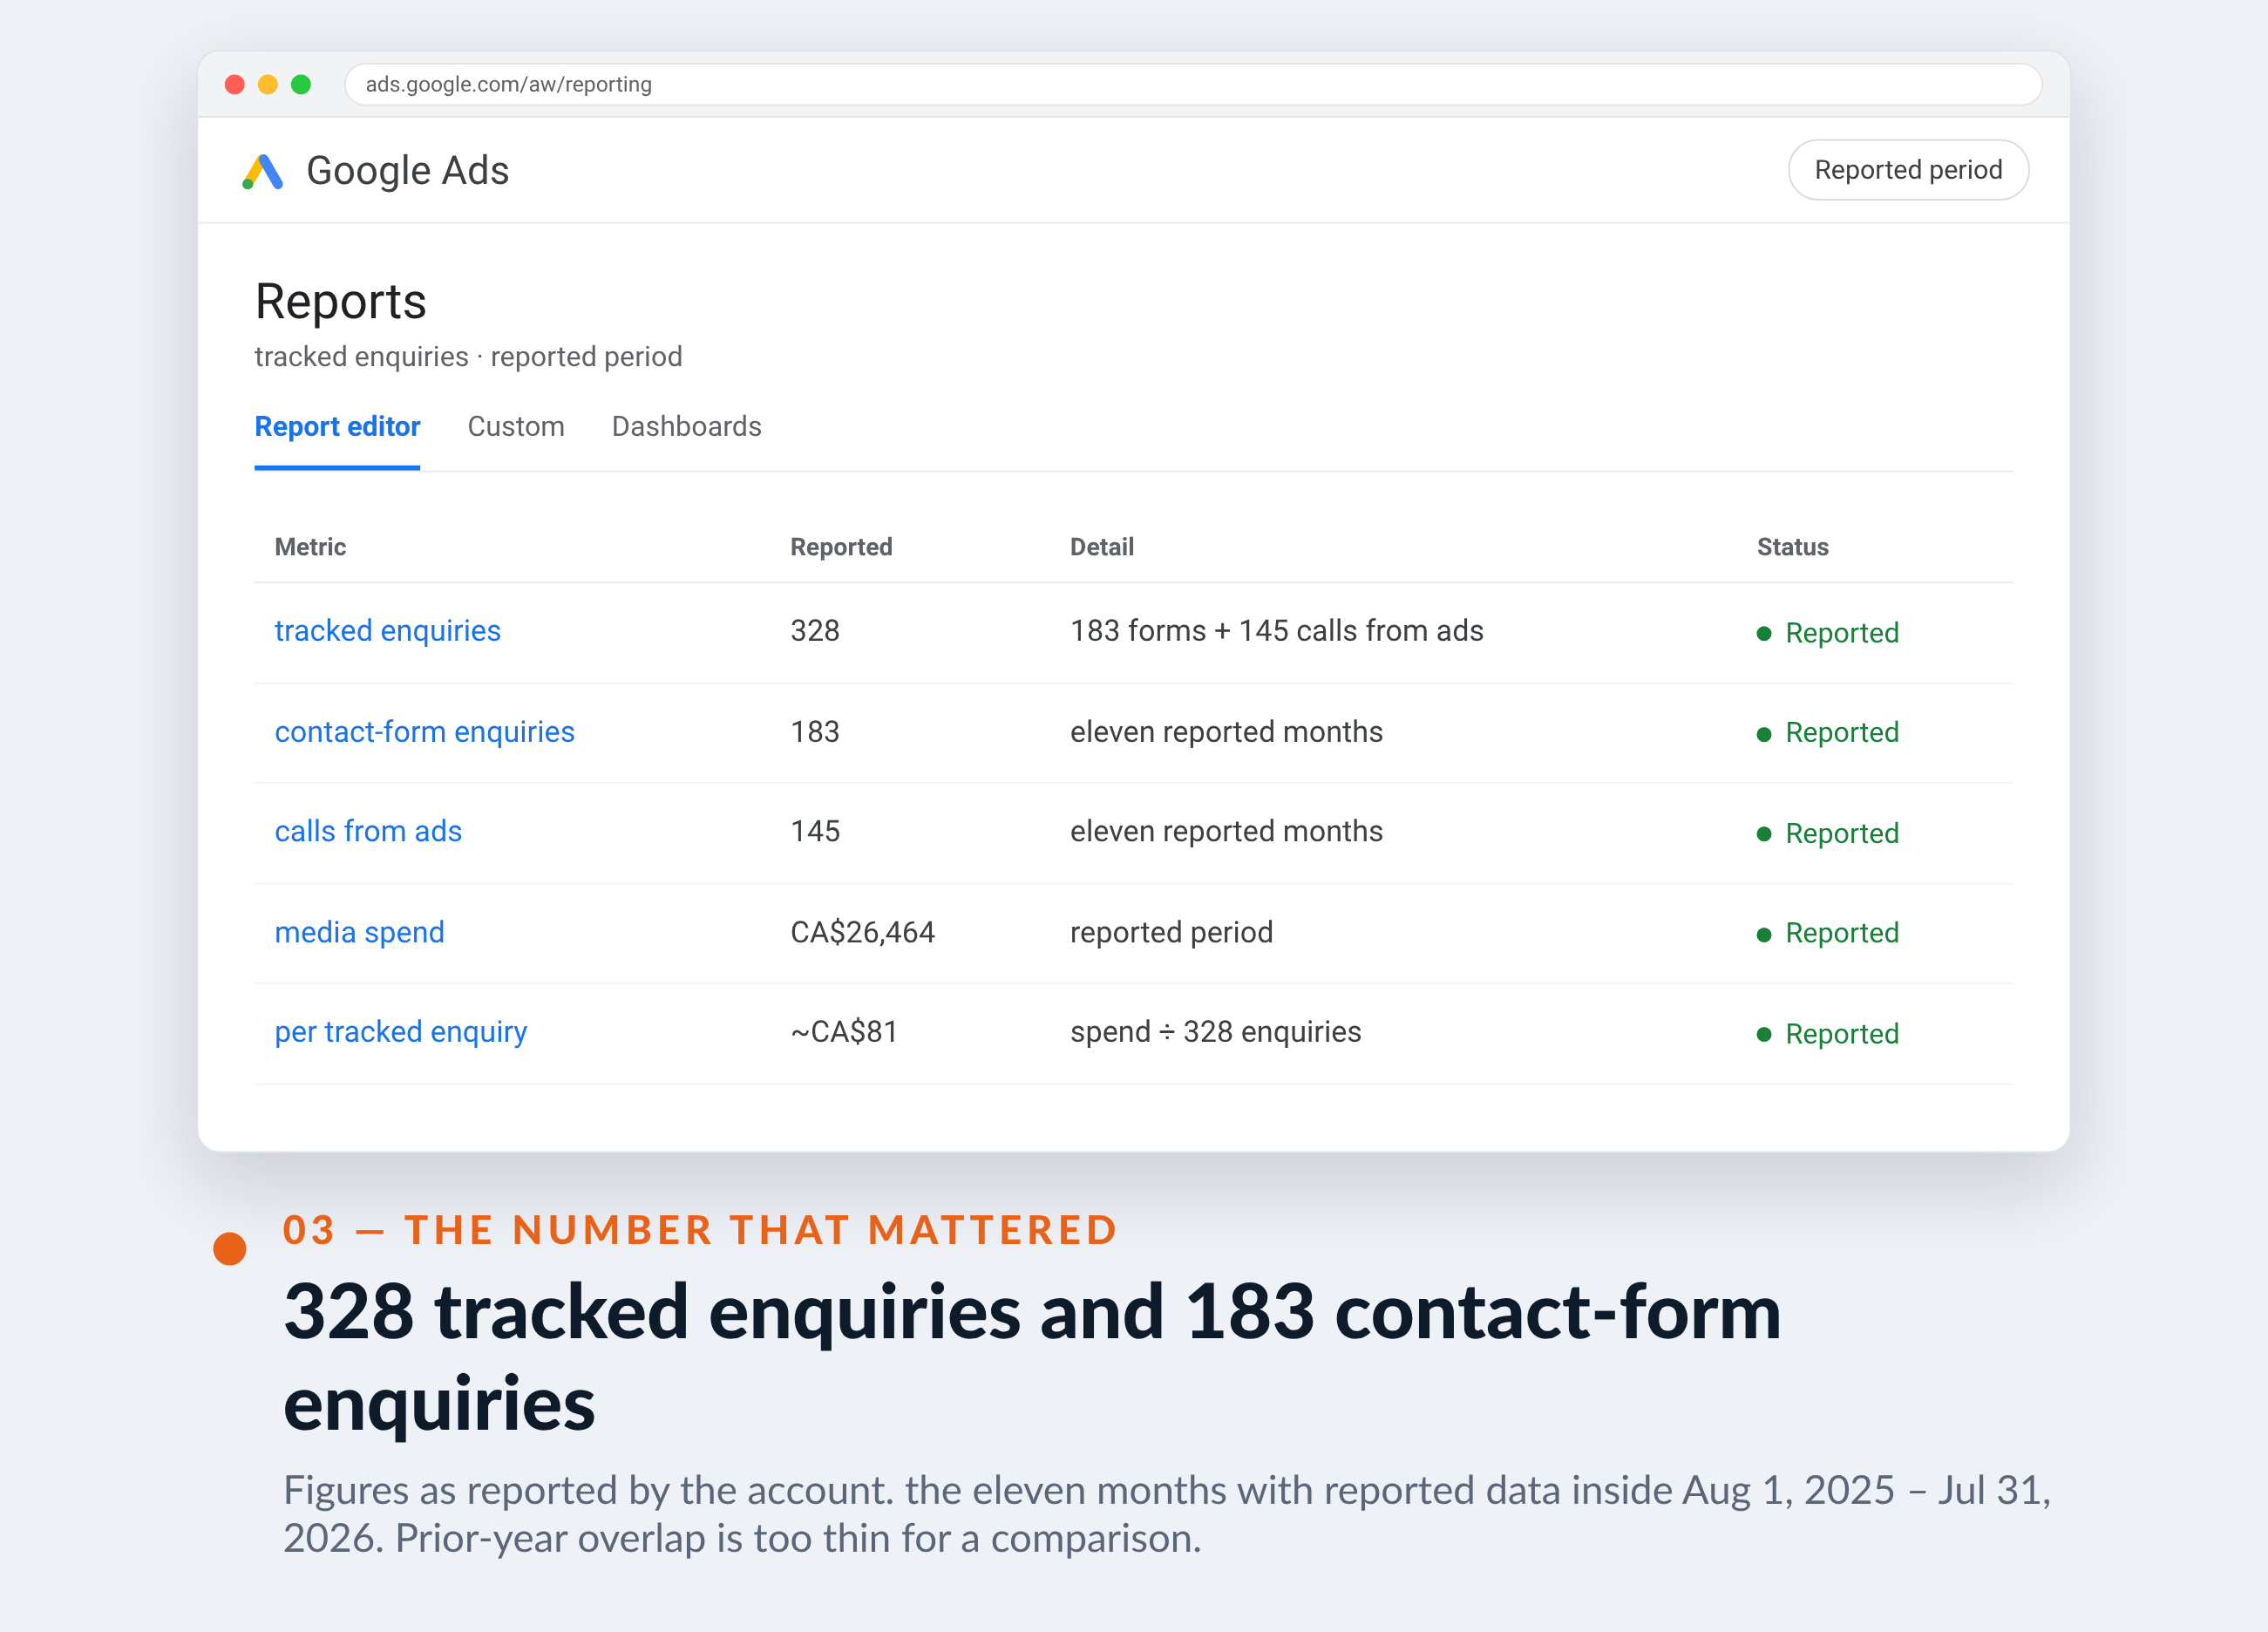
328
tracked enquiries
183 forms + 145 calls from ads
The results, up top — every number is in the strip below
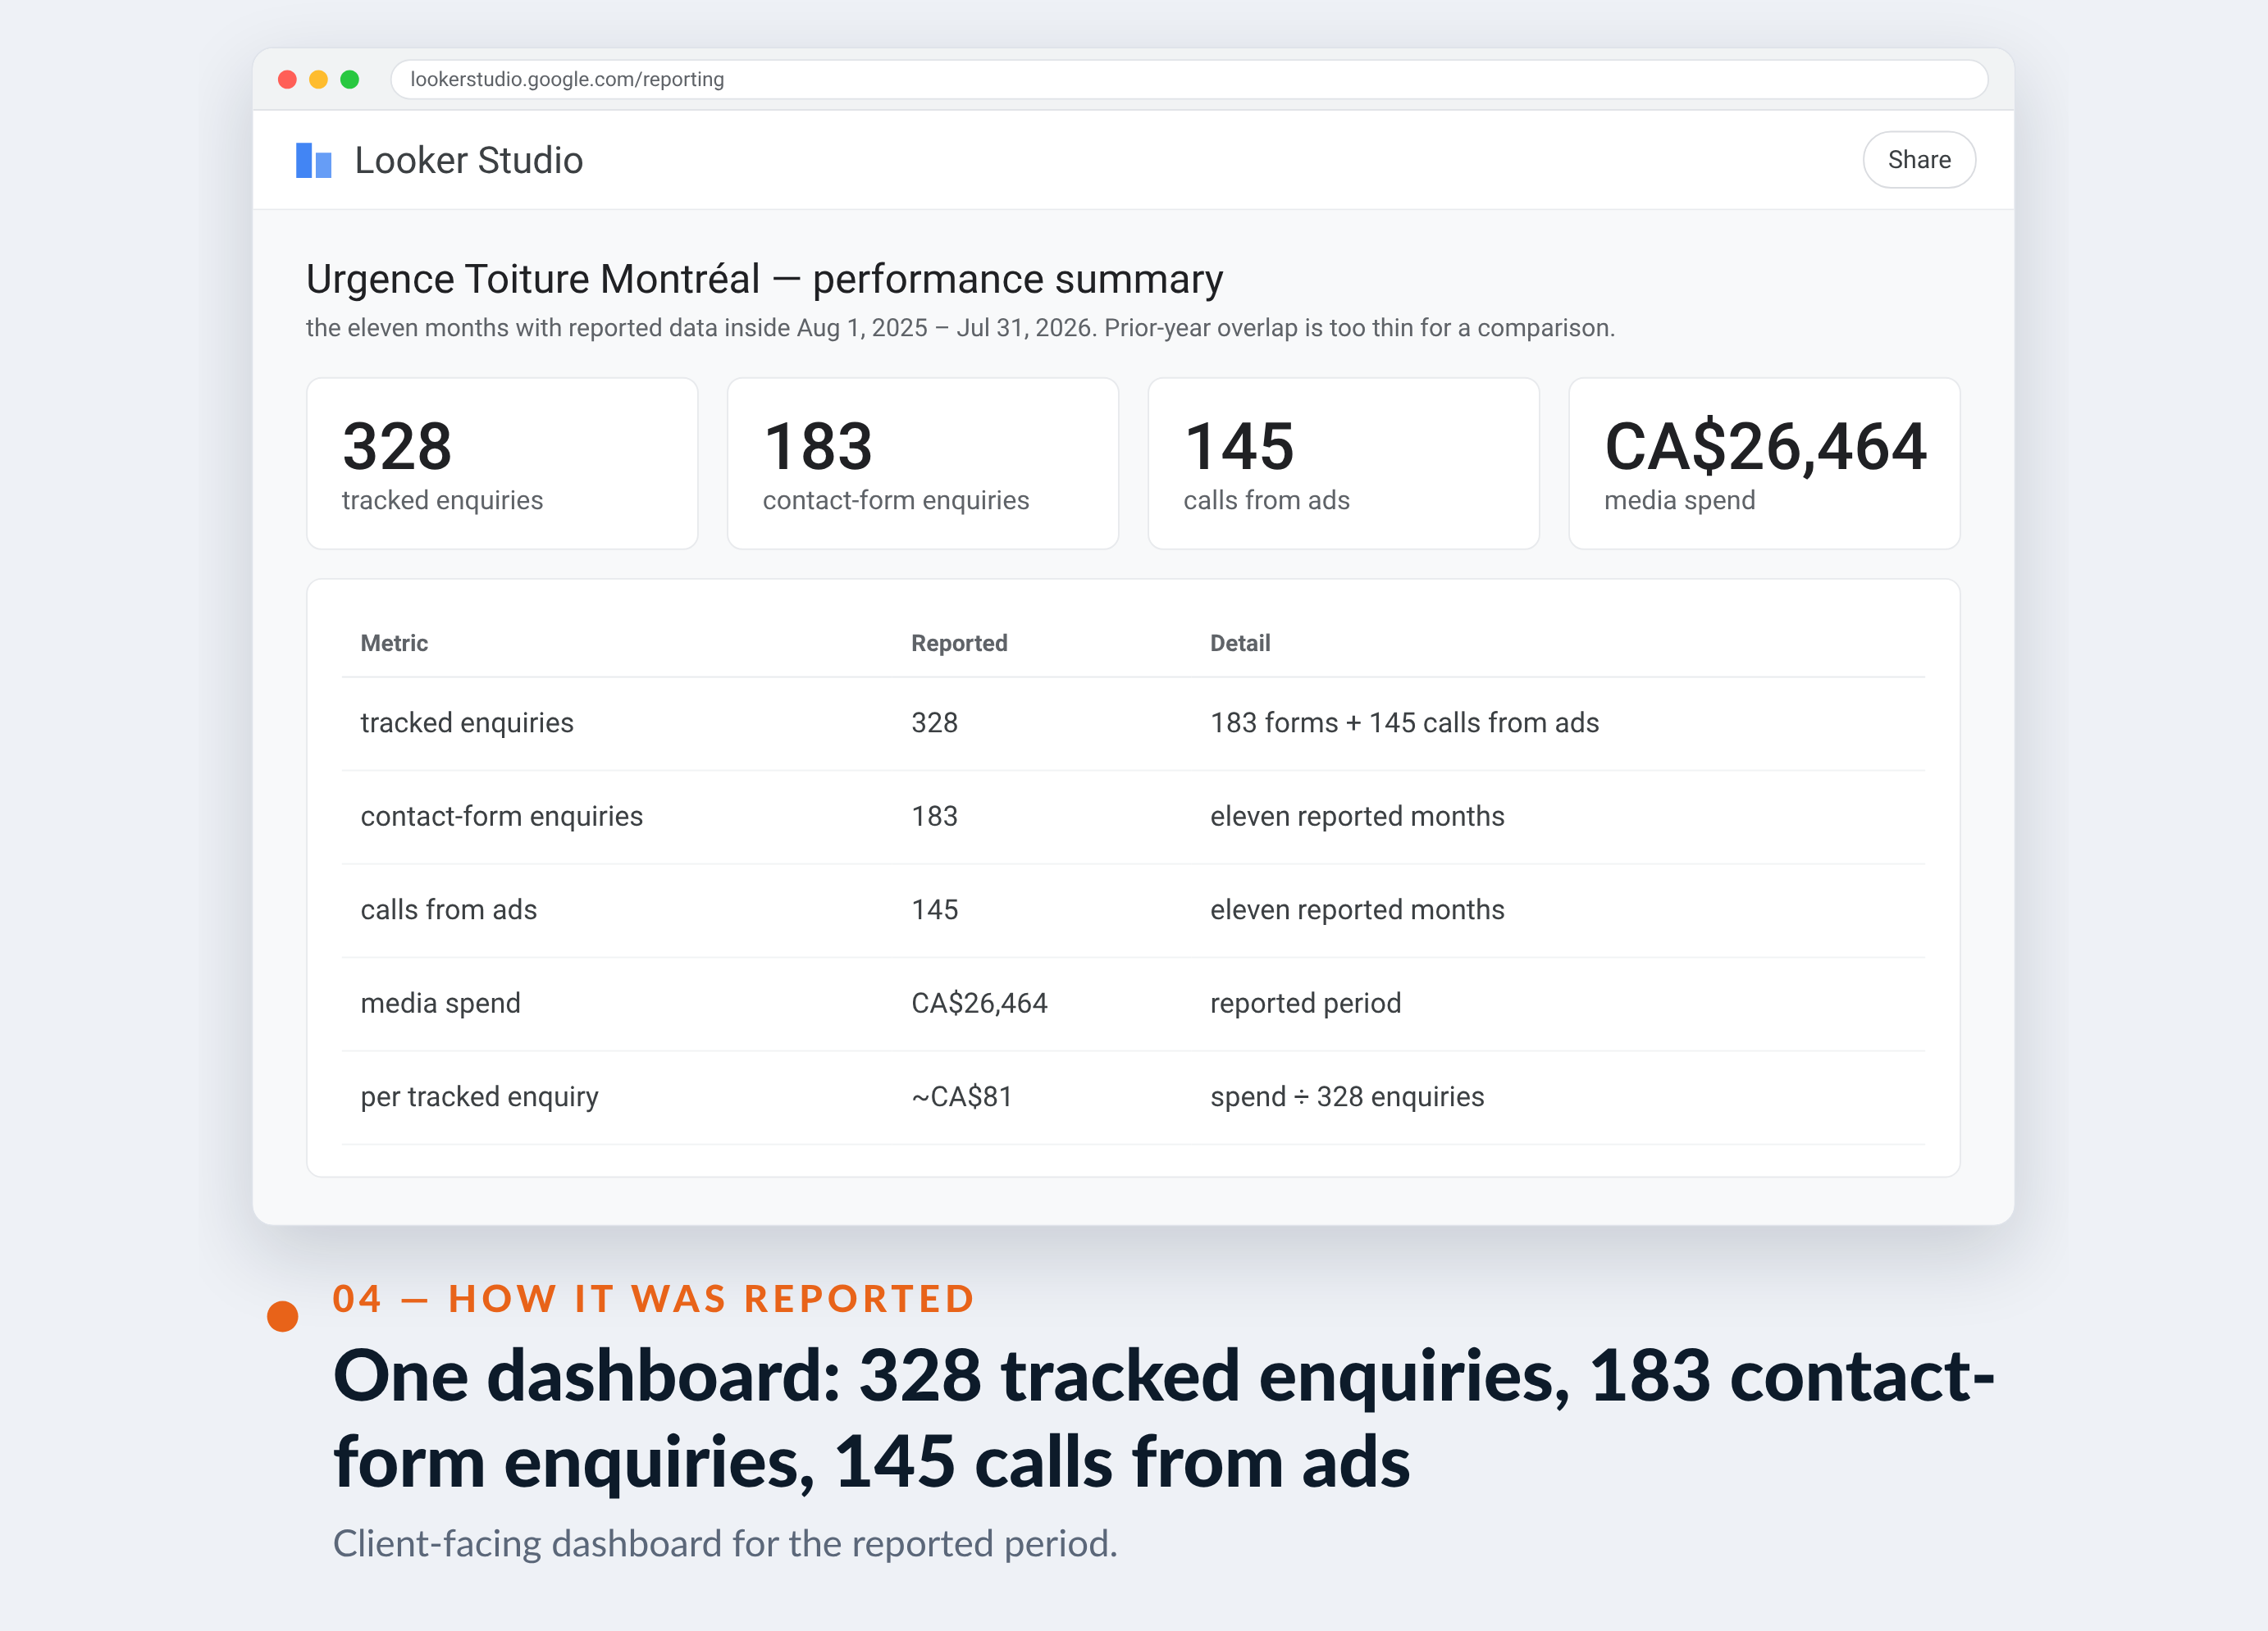
328
tracked enquiries
183 forms + 145 calls from ads
183
contact-form enquiries
eleven reported months
145
calls from ads
eleven reported months
CA$26,464
media spend
reported period
~CA$81
per tracked enquiry
spend ÷ 328 enquiries


01 — The challenge
Demand that spikes with the weather, and a budget that does not.
Urgence Toiture Montréal handles roof emergencies across Montreal and Laval — leaks, storm damage, snow and ice removal, flat-roof and membrane repair, inspection and thermography — with a 24/7 promise and a quote inside 24 hours.
Emergency search volume is spiky by nature: a spring thaw or a summer downpour can produce more qualified demand in four days than the preceding month. A flat, evenly paced account misses the spike and then overpays through the quiet stretch — the pattern visible in this account's own monthly data, where enquiries peaked sharply mid-season.
“When a roof is leaking, nobody comparison-shops. They call whoever answers. The whole game is being in front of that person in the first hour, not the first week.”
So the account was built to lean into the spikes and coast through the lulls.
02 — Our approach
Be unmissable during the spike. Be cheap during the lull.
Urgency-intent language was separated from planned-work language. "Roof leak now", "emergency roofer" and storm-related queries were given their own structure, ad copy and call assets; replacement and inspection queries were kept in a slower, cheaper lane.
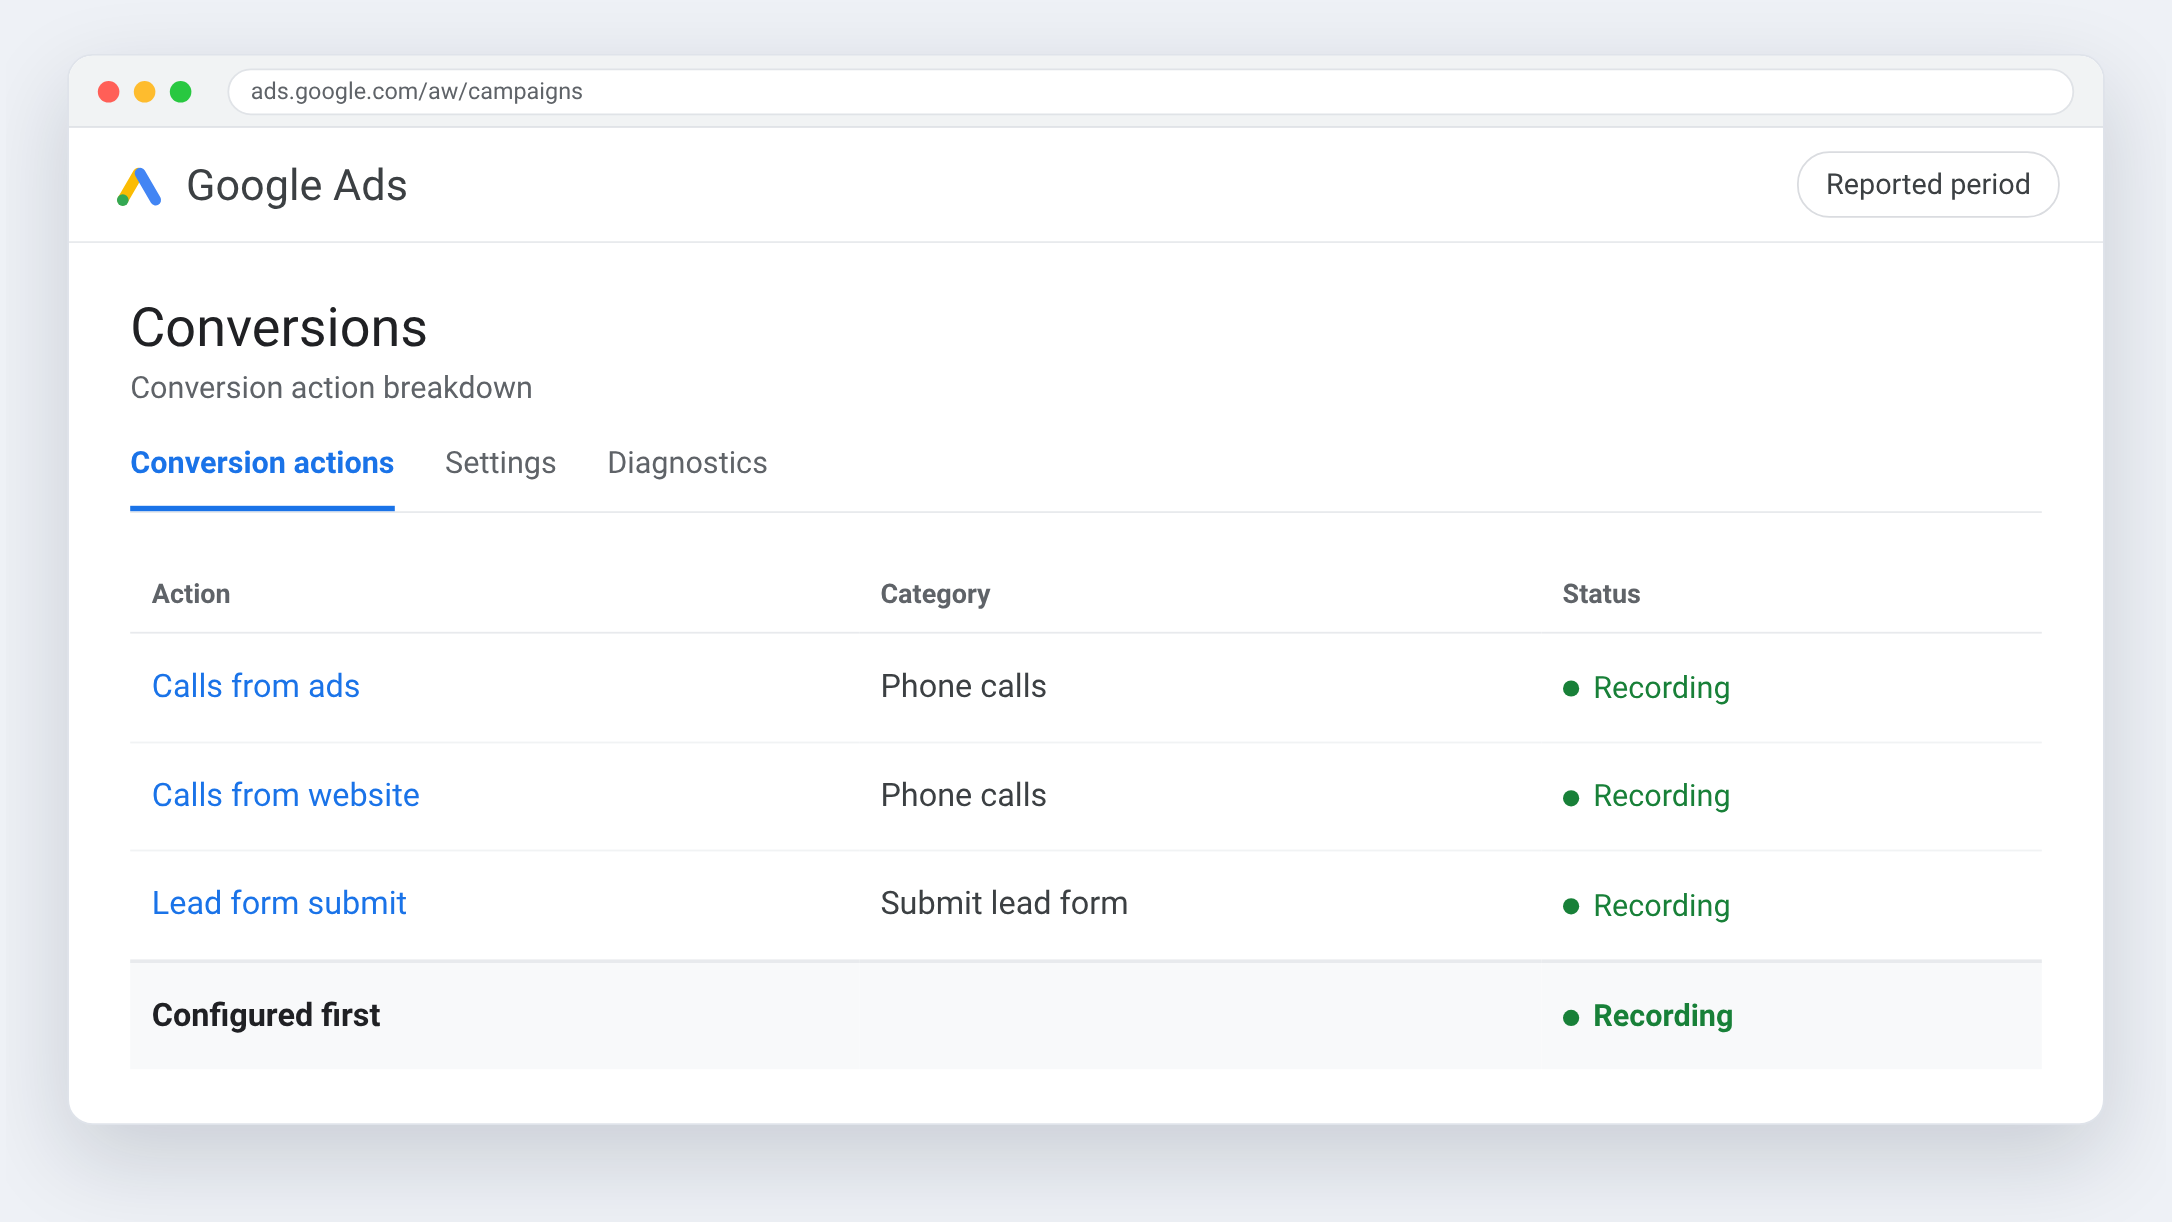
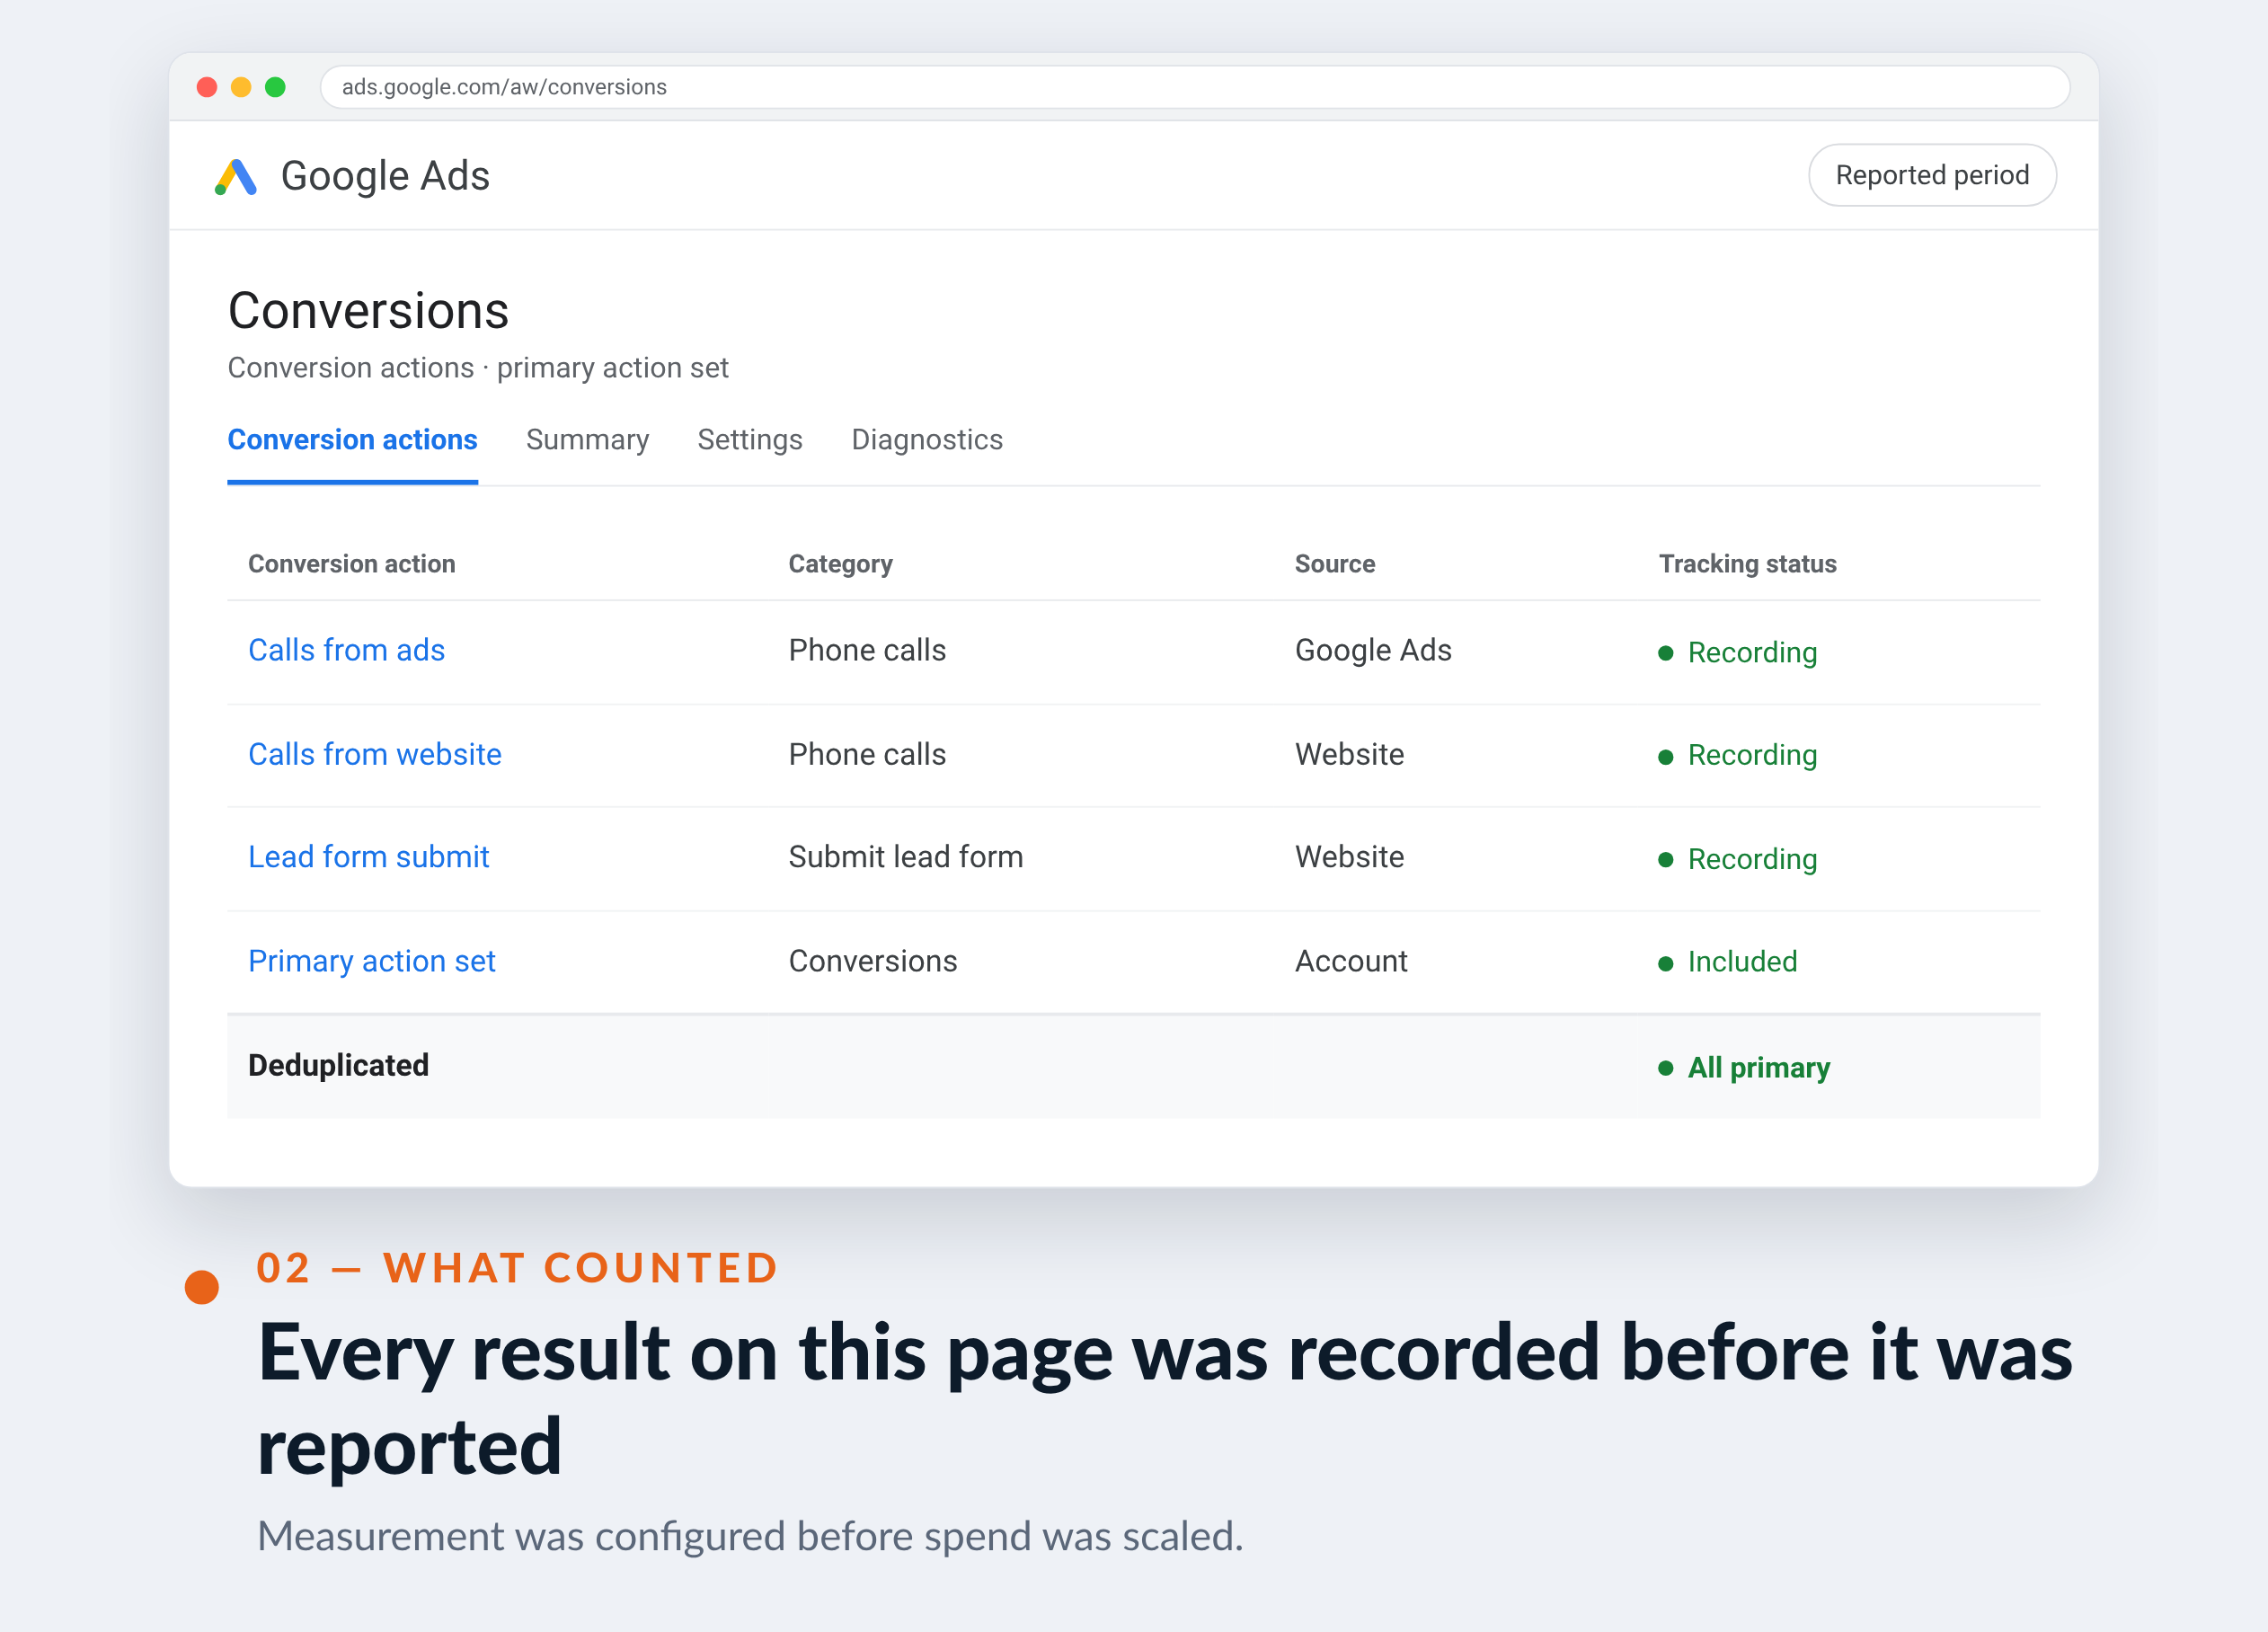
Two conversion routes were tracked in parallel: the contact form for planned work and quotes, and the call from the ad for genuine emergencies. They are reported separately on this page — 183 and 145 — rather than summed into one flattering number.
Site-tracked calls and form fills in this account only overlap the prior year on two months, which is far too thin to build a year-over-year claim on. This page therefore reports absolute performance for the eleven reported months.

03 — What we did
Urgency split from planned work, two routes tracked, absolutes reported.
Eleven months of reported data, counted honestly.
Urgency segmentation
Separated "leaking now" from "planning a replacement"
Different structure, different copy, different bids. Emergency queries get call assets; planned work gets the quote form.
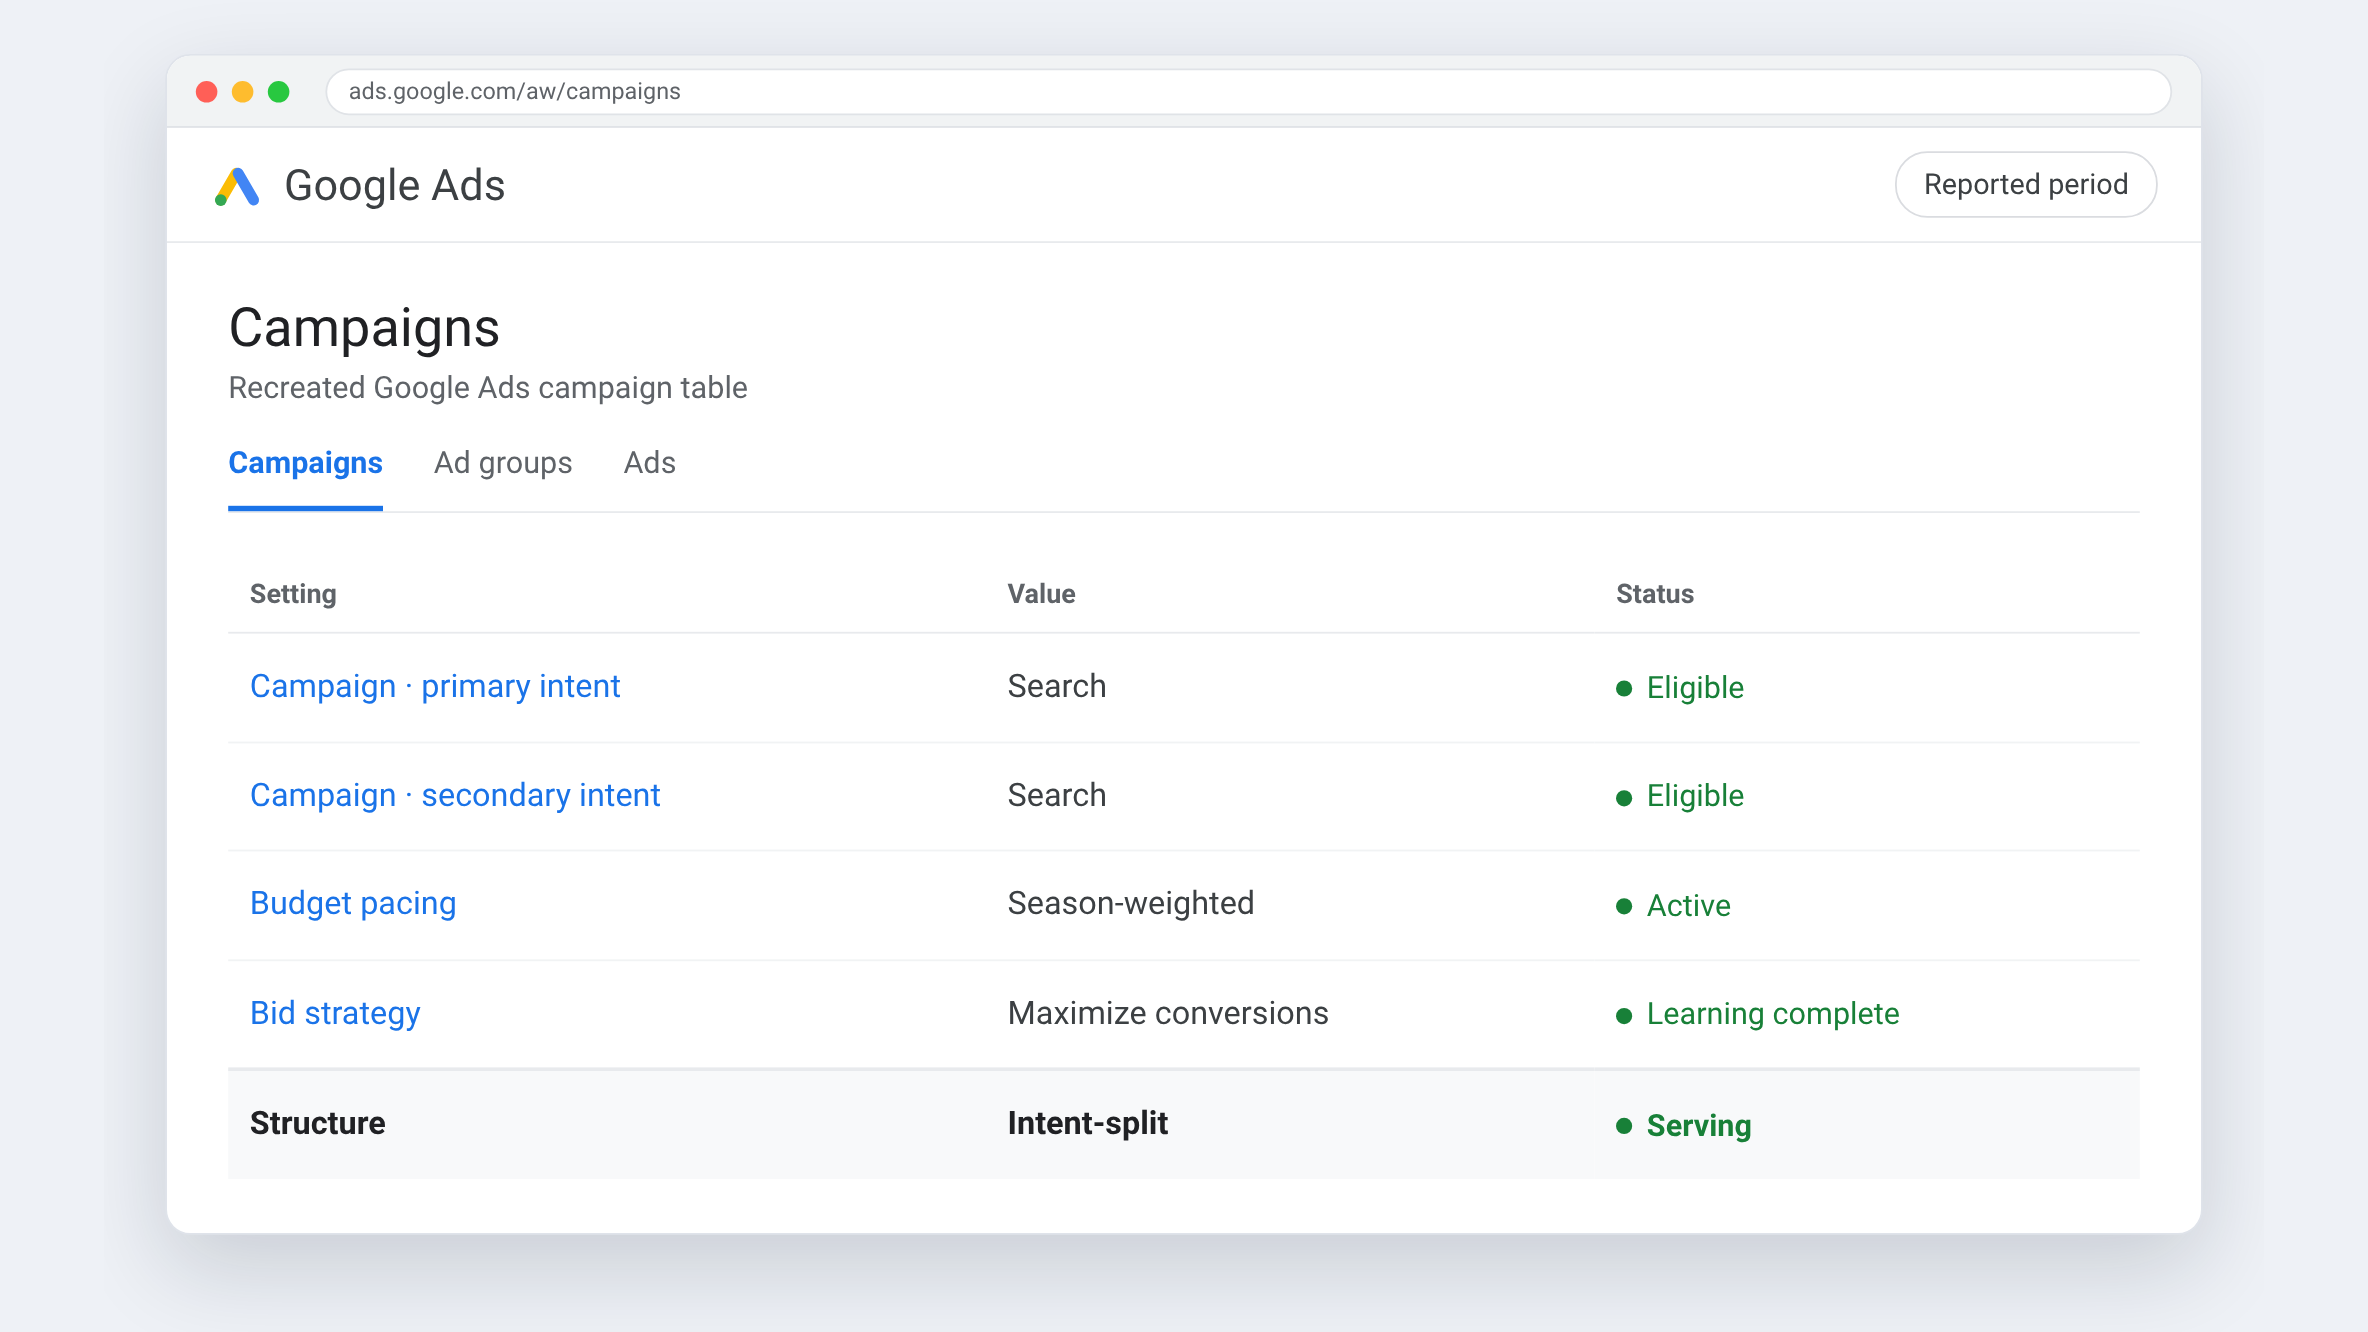
Weather-responsive pacing
Leaned into the spike weeks
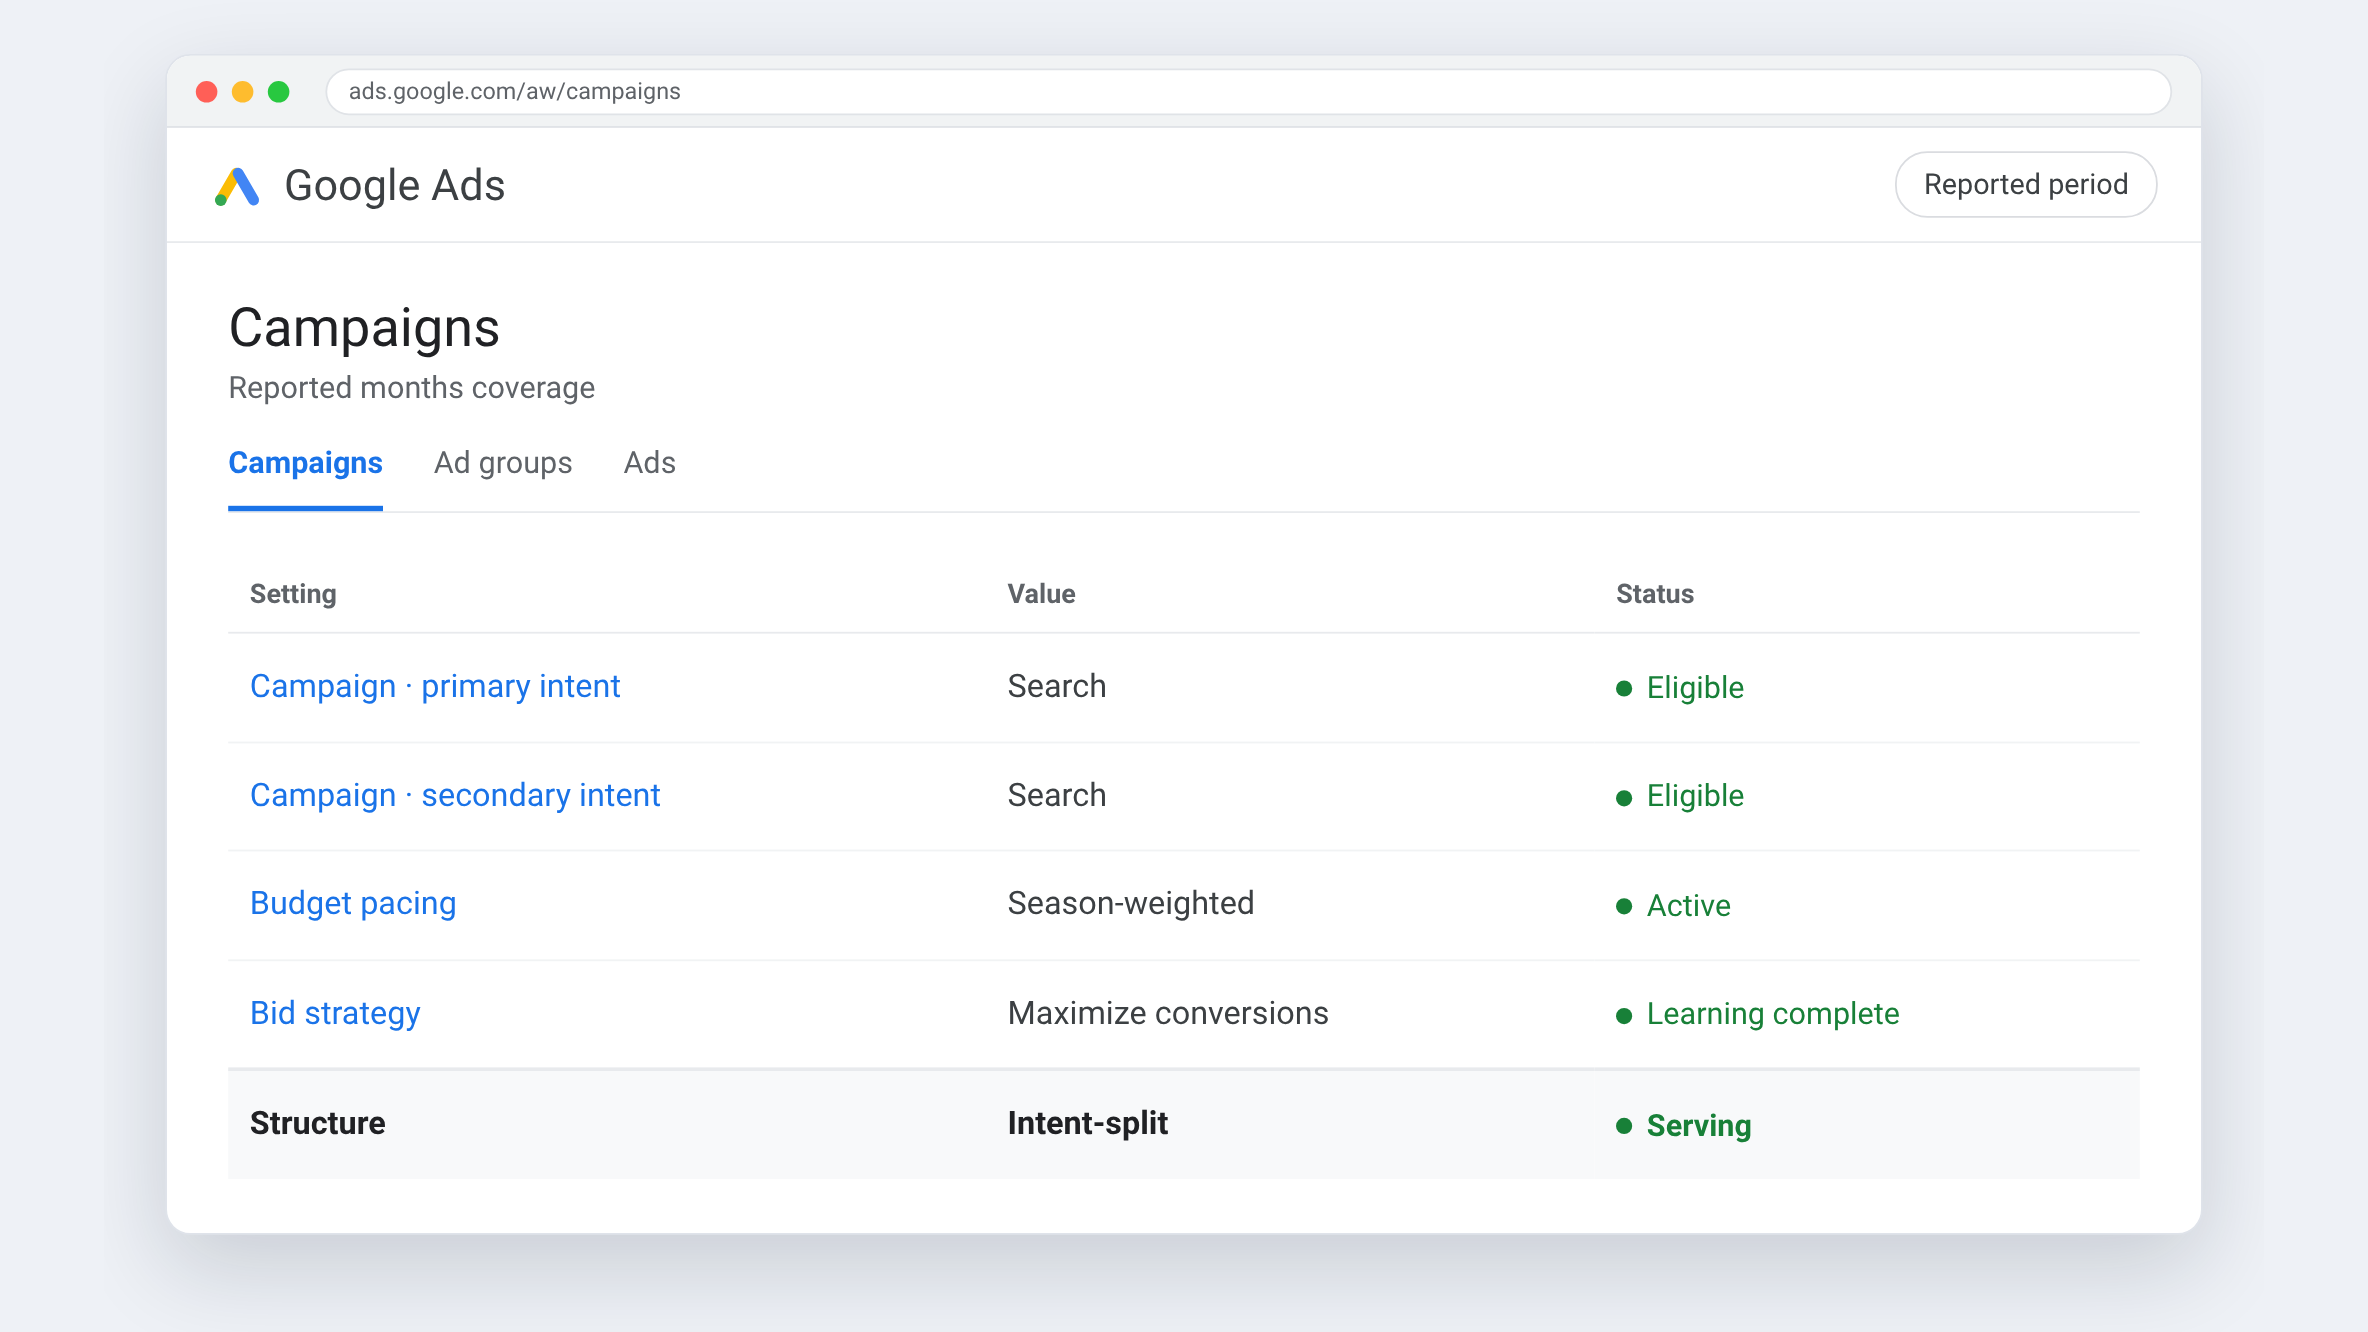
The account's own monthly series shows enquiry volume peaking sharply mid-season. Budget was pushed towards those windows rather than spread evenly.
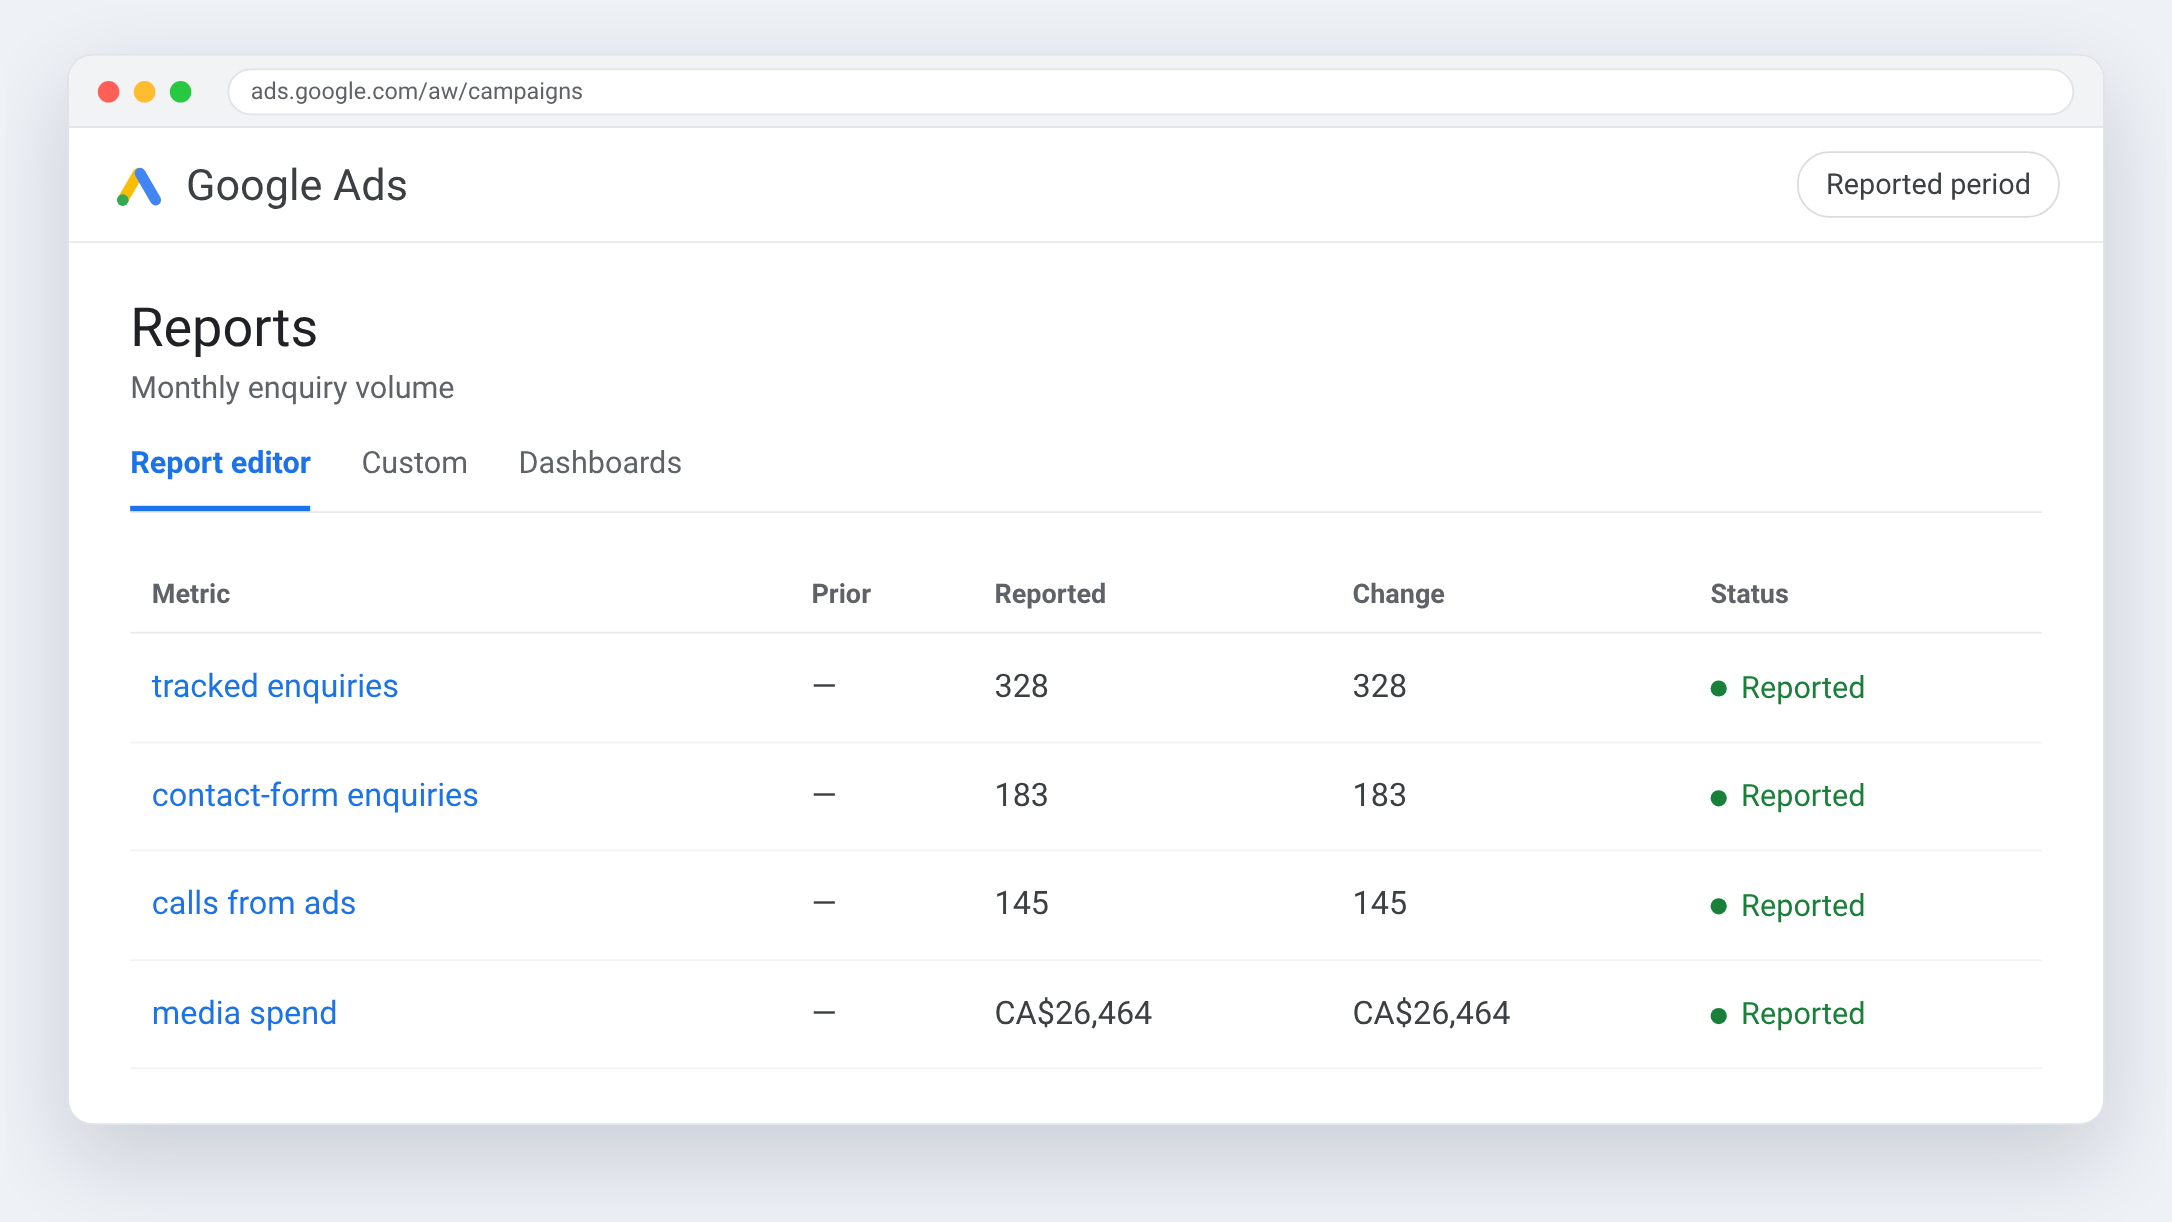
Two routes tracked
Forms and ad calls reported separately
183 contact-form enquiries and 145 calls from ads. Summing them would look better and mean less.
No thin comparisons
Refused a two-month year-over-year claim
Two months overlap the prior year for the site actions, so the page reports absolute figures rather than a percentage built on a short window.
04 — The results
Eleven reported months: 183 form enquiries, 145 calls from ads.

The stack we ran it on

Google Ads
Paid search
Google Ads Editor
Paid search

GA4
Analytics

Google Tag Manager
Tracking

CallRail
Call tracking

Google Search Console
Search

AgencyAnalytics
Reporting

Looker Studio
Dashboards
















































Farrukh Ahmed CPA — Local SEO launch
position 50 → 17 · +166% desktop map impressions



Food Allergy Institute — Paid media and booked consultations
243 → 1,012 consultations/mo · cost per landing page view −30%




























































National Consumer Panel — UGC-driven acquisition & paid media
CPI −30% · CPA −20%


National Debt Relief — UGC, performance creative & influencer strategy
CVR +25% · CAC −30%





New Balance — Casting, post-production & influencer marketing
7 athletes · 750k audience








































"Their transparency, attention to detail, and collaborative approach made them feel like an extension of our own team."


.webp)
.webp)


