



Water work is the most profitable service in restoration. That does not make every job profitable.
every job profitable
This is not a page selling water damage restoration services. It is the commercial diagnosis behind the company that provides them: which jobs earn, how quickly the phone is answered, what drying discipline costs and returns, and how long the money takes to arrive. We measure it, then hand over a written plan your leadership team owns and runs. Advisory only, with no campaign management and no claims handling inside the engagement. Book a meeting and bring twelve months of job and receivable data.






Tell us a little about your brand and we'll be in touch within 24 hours to lock in a time.



WHAT WE EXAMINE
Four places a water damage business quietly loses margin.
quietly loses margin
Demand for water mitigation is steady and largely weather independent: ISO data published by the Insurance Information Institute puts water damage and freezing claims at about 1.61 per 100 insured homes a year, roughly one home in sixty, at an average severity of $13,954. The commercial question is never whether the losses happen. It is which of them reach you, and what you keep when they do.
Job economics and drying discipline
Intake, response and conversion
Referral and demand sources
Documentation, billing and the cash cycle
What a mitigation job earns after equipment, labour and paperwork.
We rebuild margin per job from your own records: technician hours, drying days, equipment on site against equipment needed, moisture documentation, subcontracted work, mold remediation attached to the same loss, and the administrative time between the final reading and a clean invoice. Drying discipline is a margin lever before it is a technical standard: equipment left on site an extra two days is cost, and equipment pulled early is rework.
The category earns its reputation. Water damage restoration is the most profitable service for 52% of contractors, up from 47% the year before. The spread inside that average is what this engagement is for: 19% of contractors report gross margins under 20% while 22% report margins above 50%.
- Gross margin per mitigation and repair job, measured
- Drying days and equipment utilisation against job type
- Mold and reconstruction attachment quantified
- Administrative hours per file counted, not estimated
52%
of contractors call water damage their most profitable service
The first ten minutes decide most of the revenue.
A water loss is bought in a hurry, usually by a homeowner standing in it or by a plumber, adjuster or property manager on their behalf. We measure call answer rate by hour, after-hours handling, the share of calls that become scheduled inspections, time to first crew on site, and how many opportunities are lost at the point of contact rather than at the point of price.
Then the same for every referral pathway, because the intake standard a property manager experiences is the reason they call again. This is measured as a commercial system with recorded findings, not as a call-scripting workshop.
- Answer rate, after-hours cover and abandoned calls measured
- Call to inspection and inspection to job conversion
- Time to first crew on site by branch and hour
- Lost opportunities traced to a cause, not a guess
1 in 60
insured homes files a water damage or freezing claim each year
Who sends you work, and what that dependence is worth.
We map plumbers, property managers and building owners, insurance agents and adjusters, third party administrator and program volume, past customers, and the direct demand the company generates itself. Each is measured on volume, margin, payment behaviour and concentration risk.
The industry's dependence is shifting. Referrals remain the dominant lead source at 93%, while adjuster and insurance agent relationships have fallen to 55% from 68%, and 64% of restorers use TPAs while 61% of TPA users would not recommend them. The plan sets what each source is for, and what has to be built before anything is reduced.
- Volume and margin by referral source and program
- Concentration risk stated per counterparty
- Plumber and property manager pipeline mapped by account
- Direct demand built before program work is cut
93%
of restoration contractors name referrals as a lead source
Finished work is not revenue until the file survives review.
We measure days to payment by carrier, program and job type, approval and reduction rates against documentation quality, receivable ageing, write-offs, and the internal process between the last moisture reading and the invoice. Companies that document consistently are paid faster, and the difference is visible in your own data.
The context is unforgiving. A little over 3% of contractors receive insurance payment within one to two weeks and more than 18% wait longer than eight weeks, while getting paid has overtaken hiring as the industry's number one problem. Growth plans that ignore this fund themselves out of working capital.
- Days to payment by carrier, program and job type
- Approval and reduction rates against documentation quality
- Receivable ageing and write-offs quantified by branch
- Working capital the growth plan requires, stated up front
18%+
of restoration contractors wait more than eight weeks to be paid
Fixed scope with a defined end date, agreed in writing
We review real intake calls, including after hours, not scripts
Advisory only, so the plan can recommend spending less
Twelve months of job, equipment and receivable records
We made the difference for those brands

Beauty, personal care & wellness

B2B software, fintech, insurance

Healthcare & regulated services

B2B software, fintech, insurance

B2B software, fintech, insurance

Retail & commerce

Apparel and lifestyle

Home essentials, appliances, kitchen & pet

Consumer tech and platforms

Healthcare & regulated services

B2B software, fintech, insurance

Beauty, personal care & wellness

B2B software, fintech, insurance
B2B software, fintech, insurance

Beauty, personal care & wellness

Food & beverage

B2B software, fintech, insurance

B2B software, fintech, insurance

Retail & commerce

Healthcare & regulated services

B2B software, fintech, insurance

Healthcare & regulated services

Retail & commerce

Beauty, personal care & wellness
Consumer tech and platforms

Beauty, personal care & wellness

Home essentials, appliances, kitchen & pet

Travel & mobility

Healthcare & regulated services

Beauty, personal care & wellness
01 — The challenge
The trucks are moving, the crews are tired, and the margin is thinner than last year.
A familiar picture in a water damage business that has grown past its founder. Jobs are being booked but nobody can say which ones earn. Two technicians dry a house in three days and two others take five, on similar losses. After-hours calls go to a service that takes a message. Program work fills the gaps at a margin no one has measured against direct work. Mold remediation and repair are attached inconsistently to the same losses. Invoices leave late because the documentation is chased after the equipment comes out.
“We have never had more jobs on the board and never had less cash in the bank.”
The market shifted underneath all of it. Verisk data cited in the 2026 State of the Industry report shows overall claim volume down roughly 20% in 2025, water damage returning to 64% as the top service category, and 67.31% of companies now doing 75% or more residential work, the highest share in the survey's history. More companies are competing for residential water losses than at any point in the last four years, and over 80% of them still expect to grow next year.
02 — Our approach
Measure the jobs, fix the intake, then a plan your operators own. Four to six weeks.
Fixed scope, one senior advisor in every session, no execution work inside the engagement. Week one is measurement. We take twelve months of job, equipment, revenue and receivable records out of your job management platform and accounting system, listen to how calls are handled including after hours, and interview the owner, each branch or operations lead, the person who dispatches crews and the person who chases payment. Week two is economics: gross margin per job by type and branch, drying days and equipment utilisation, mold and repair attachment rates, call answer and conversion by hour, referral volume and margin by source, and days to payment by carrier and program. Week three is the decision session with your leadership team, covering which work to pursue, which referral relationships to invest in, what the intake standard has to be, where documentation must tighten, and what pricing discipline the company will hold. The final weeks produce the written plan: a growth model by branch and job type, a referral and demand plan with named owners, an intake and response standard, the cash changes that have to land first, a marketing brief any vendor can be held to, and a monthly scorecard your team maintains. We do not run your campaigns, we do not write your estimates and we do not perform restoration work. Everything is handed over in editable files that stay yours.
03 — What we did
How the engagement actually runs.
Job economics before opinions, intake before targets, then one written plan your operations leaders have already argued through.
Week 1 / Measurement
Calls, jobs and receivables read as one commercial system
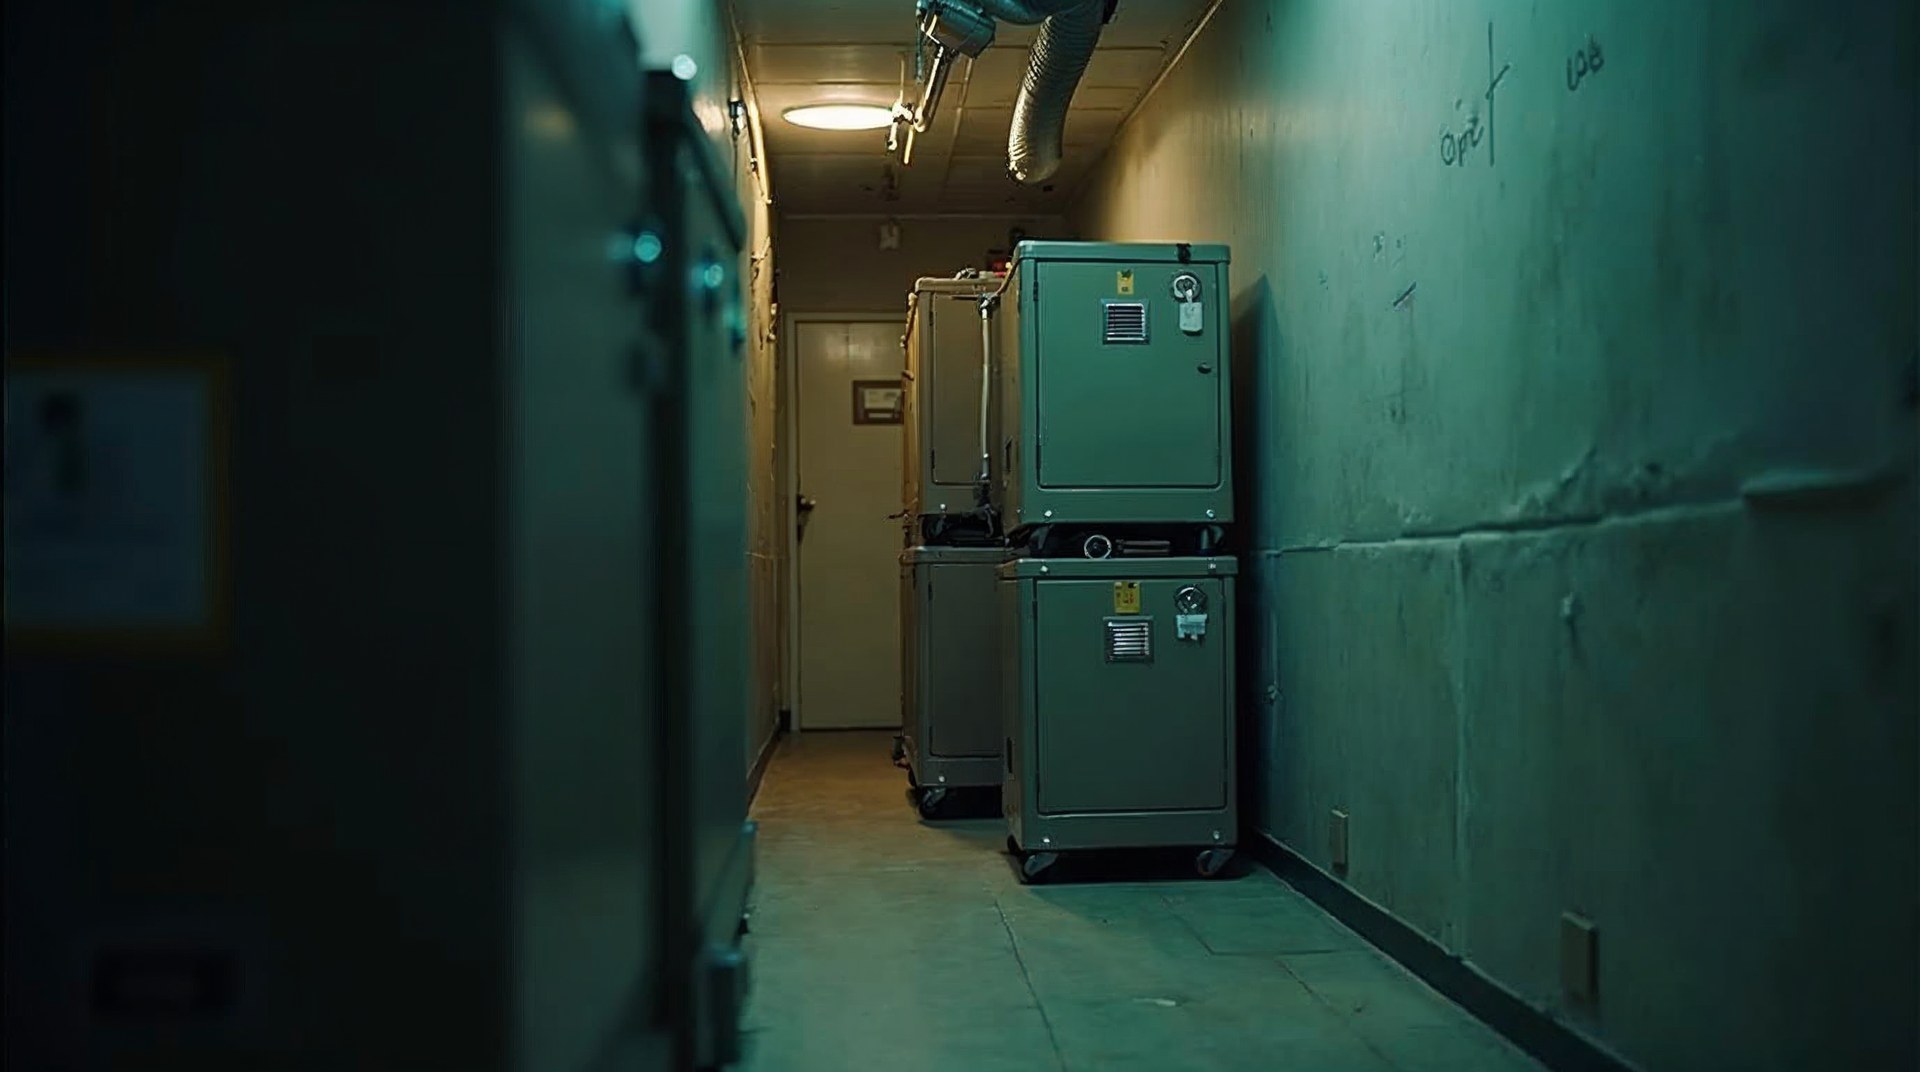
Twelve months of job records plus how the phone is really answered, including at two in the morning.

Week 2 / Economics
Margin per job, drying days and equipment utilisation
What each job type earns, how consistently crews dry, and where equipment and hours quietly disappear.
Week 2 / Cash
Documentation quality against approvals and days to payment
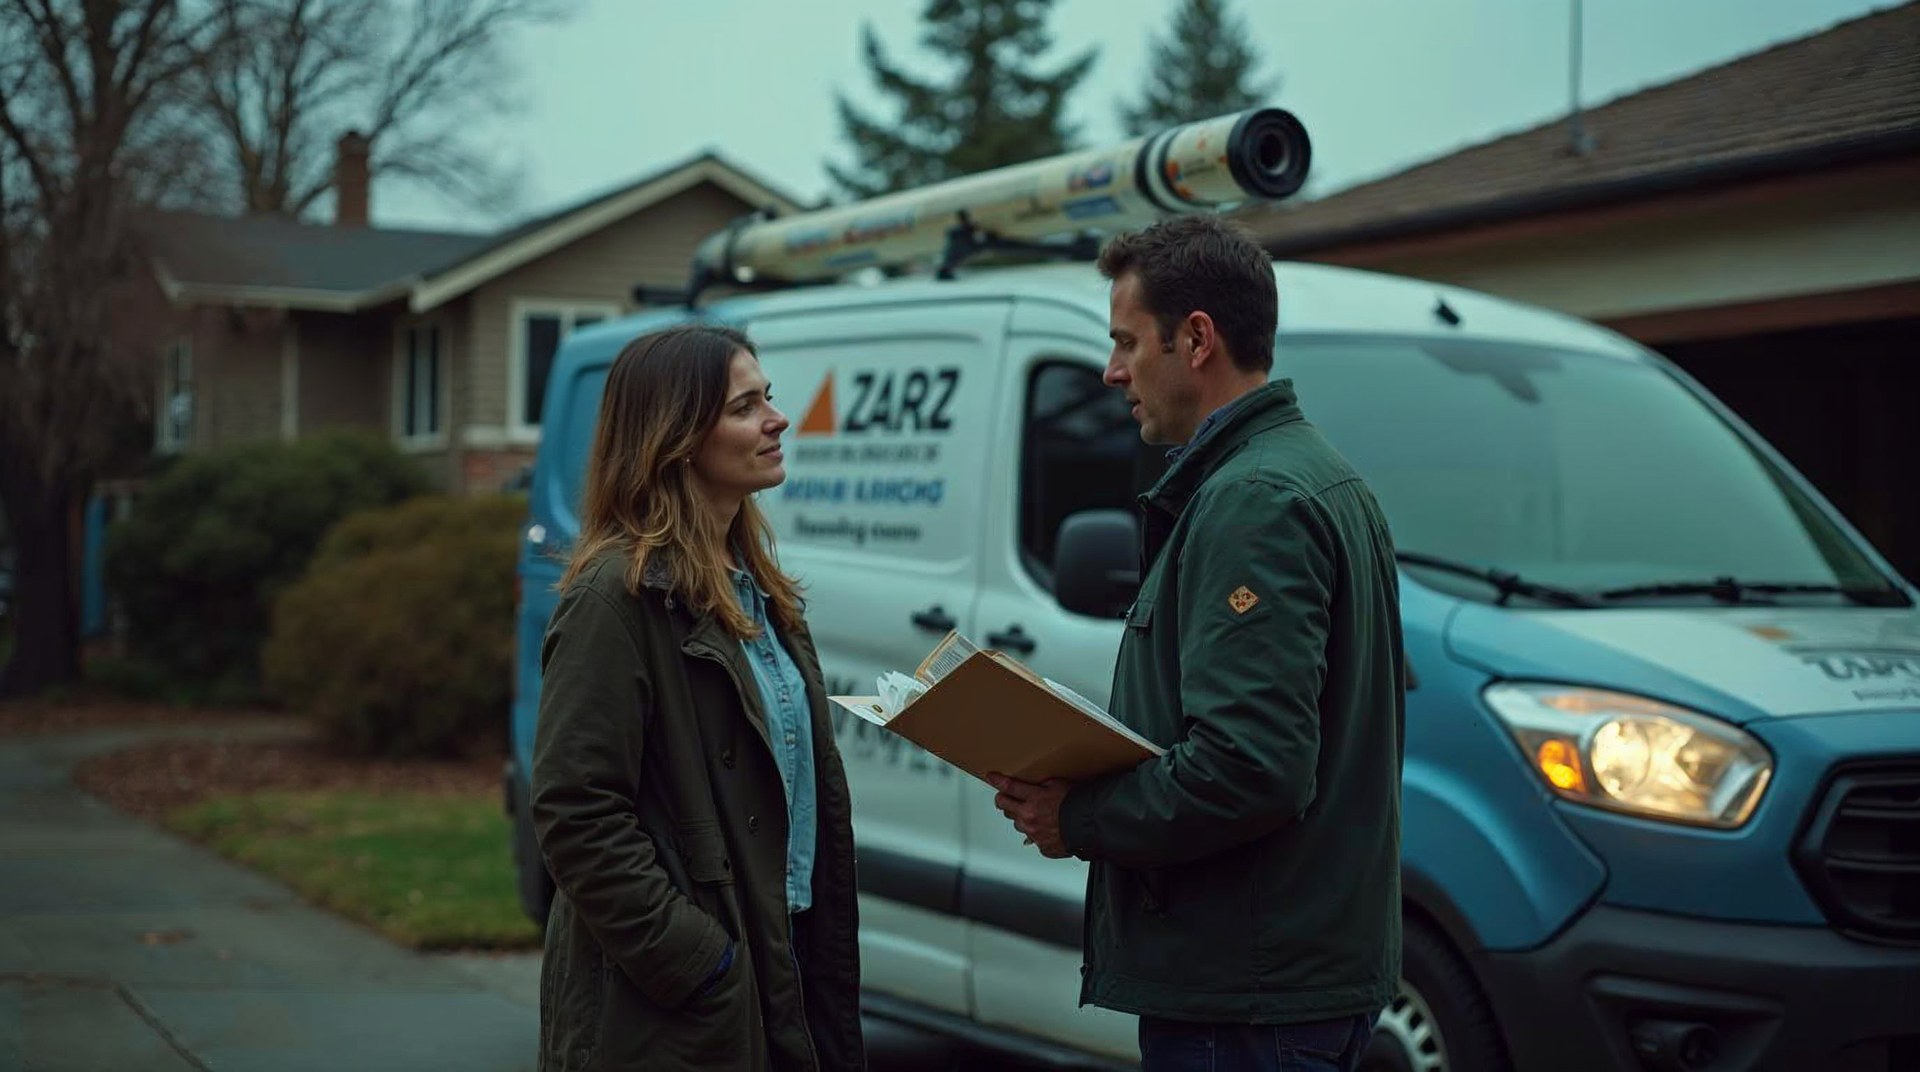
Which carriers and programs pay slowly, and which files come back reduced for reasons you control.

Weeks 4-6 / Plan
The referral plan, the intake standard and a scorecard
Named account owners, a response standard the company can hold, and a short monthly scorecard.
WHAT YOU GET
Six deliverables, all editable, all yours.
all yours
Written for your branches, your crews and your referral sources, in files your team can change without calling us.

Water damage growth plan
Where growth comes from over the next four quarters, by branch and job type, with a named owner for each workstream.

Job economics model
Margin per mitigation, mold and repair job after labour, equipment, subcontract and administrative time.

Intake and response standard
Answer, dispatch and on-site targets by hour, with the measurement that proves whether they are being met.

Referral and demand map
Every source of work with its volume, margin, payment behaviour and named owner inside your company.

Marketing brief for your vendors
What to buy, in which territories, for which job types, written so any agency can be held to it.

Monthly operating scorecard
A short set of defined numbers, from job margin to days to payment, your team maintains without help.
HOW WE WORK
Operating standards, not promises.
Operating standards


Multi-crew water damage operators
Where two crews dry a house in three days, two take five, and nobody has measured what that costs.
Franchisees and franchise groups
Where brand referral volume is comfortable, margin is thinning, and direct demand has never been built.
Commercial and property management specialists
Where response promises are sold to building owners before the dispatch capacity to keep them exists.


















Built on trust. Proven by results.
We partner with SMBs and Fortune 500 companies to deliver more than reach — we bring clarity, execution, and measurable outcomes. Every successful partnership starts with a strong culture fit and a shared drive to grow.







CASE STUDIES
Case studies
Website Portfolio
Video Ads
Static Ads














































EN

EN

EN


FR
FR
FR

FR

FR

FR

FR

FR


EN
FAQ
What water damage operators ask before buying growth consulting.
Do you actually perform water damage restoration?
No. We do not extract water, we do not dry structures, we do not remediate mold and we do not write estimates. This page is about the business behind that work. If you are a property owner with an active loss, call a licensed restoration contractor in your area rather than us. If you own or run the restoration company, this engagement measures where its margin, demand and cash cycle actually stand and hands you a plan.
What does water damage growth consulting cover?
Four areas and a plan. Job economics, meaning margin per mitigation, mold and repair job after labour, equipment and administrative time; intake, meaning how calls are answered, converted and dispatched; demand, meaning which referral sources and programs bring work and at what real margin; and cash, meaning documentation quality, approvals and days to payment. The output is a written plan with named owners, a vendor brief and a monthly scorecard.
How is this different from a restoration marketing agency?
An agency is paid to generate leads and run campaigns. This engagement is paid to find out where the business loses money, and in water damage that is usually intake, drying discipline, program dependence or the cash cycle rather than lead volume. Because we take no execution work inside the engagement, the plan is free to recommend spending less on media and more on dispatch or documentation. Execution afterwards is scoped separately, and the brief is written so any agency, including your current one, can deliver against it.
Is our company big enough for this?
The engagement suits operators with several crews, and it gets more valuable with each branch, because mix, capacity and referral concentration become real questions. In the 2026 Cleanfax survey the largest revenue bracket was $1M to $2.9M at 28% of respondents, with about 10% above $10M, so this is an industry of substantial operating companies. A single-truck company that wants more calls next month is better served by execution than by a diagnosis, and we will say so at the scoping call.
What does the engagement cost?
A fixed fee quoted after a scoping call, with deliverables and dates written down before you commit. It varies with the number of branches and systems in scope and the state of the job data, so publishing a rate would mislead most readers. Book a meeting and you will get a scope and a number rather than an estimate range.
Can you fix our after-hours call handling?
We measure it and specify the standard; your team or your answering provider implements it. A water loss is a same-hour purchase, so the plan states target answer rates by hour, what after-hours cover has to do, how quickly an inspection is scheduled and when the first crew arrives, then defines the measurement that proves whether the standard is being met. Where it turns out the constraint is systems rather than habits, marketing operations consulting covers the rebuild.
Should we reduce our TPA and program work?
Only once the alternative exists, and only if your own margin data supports it. 64% of restorers use TPAs in some form and 61% of TPA users would not recommend them, which says the relationship is tolerated rather than loved. We compare real margin and payment behaviour on program work against direct work, then the plan sequences it: build the direct and referral pipeline first, reduce dependence second.
How do you handle plumber and property manager referrals?
As accounts, not as goodwill. The plan lists the plumbing companies, property managers, facility teams and building owners worth pursuing in each territory, what each of them actually needs from a restoration partner, who inside your company owns the relationship, and what response standard has to be true before the promise is made. Referral pipelines fail on inconsistent response far more often than on a lack of contact.
Does the plan touch pricing and estimating software?
It touches pricing discipline, not estimate writing. Xactimate remains the dominant pricing tool at 66% of contractors, and rising costs against published price models are one of the loudest complaints in the industry. We measure what your jobs actually cost against what they bill, where reductions concentrate and what documentation protects. We do not write estimates or advise on claim negotiation.
Where does AI fit into a water damage business?
In documented administrative time, mostly. The share of contractors reporting no AI implementation fell from 50% to about 30% in a year, with the practical uses being job documentation, report writing and administration. The plan scores candidate use cases on the hours they actually return rather than on novelty. If AI readiness is the question you are really asking, AI marketing advisory is the more direct engagement.
Our job costing is incomplete. Can you still do this?
Yes. We work from whatever job and accounting records exist, fill gaps with structured interviews and time observation, and label clearly which findings are solid and which are directional. Where costing is genuinely absent, part of the plan is the minimum set of fields and habits that make next quarter measurable, so the same diagnosis can be repeated by your own team without us.
How is this different from a marketing audit?
A marketing audit examines what is currently running and what it returns. This engagement is wider: job economics, intake, referral concentration and the cash cycle, which is where a water damage company's growth is actually decided, and it ends in a plan rather than findings. Companies wanting positioning and brand strategy instead should look at marketing strategy consulting.
Will the plan tell us to add mold, reconstruction or contents?
Sometimes, and only with the capacity and cash consequences attached. Attaching mold remediation or repair to losses you already handle is often the largest available margin in the business, because the demand is already in the building. It also changes crew mix, licensing and working capital. The plan quantifies the opportunity and states what has to be hired, trained or financed before it is real.
Which numbers do you want before the first call?
Twelve months of jobs with job type, revenue and cost detail; drying days and equipment counts if you track them; receivable ageing; call volumes and answer data; marketing spend by vendor and territory; and revenue split by referral source and program. Ranges are fine where records are thin, and we will label them as ranges rather than presenting them as measured.
Do you work with other kinds of restoration company?
Yes. The multi-line version is disaster restoration growth consulting, the parent engagement is growth advisory, and the same work runs in adjacent trades such as plumbing and roofing.
What happens after the plan?
Your team runs it, and every workstream has a named owner on your side. Many companies book a review at ninety days to re-measure job margin, conversion and days to payment, which takes half a day and is optional. Where you want ongoing marketing leadership rather than a project, a fractional CMO or scorecard advisory is the next engagement, quoted separately.

.webp)
.webp)


