



Paid search that buys jobs, not clicks.
buys jobs
Restoration clicks are among the most expensive in home services, and a wasted budget here is a payroll problem by Friday. We run Google Ads and Local Services Ads for restoration companies with tracked numbers per loss type, pages built for a wet phone, and a monthly report that ends at cost per booked job. It runs alongside your restoration marketing and our paid search programme so nothing is counted twice.






Tell us a little about your brand and we'll be in touch within 24 hours to lock in a time.



FOUR WORKSTREAMS
Four workstreams keep an expensive channel honest.
Four workstreams
Where the money goes, what the ad promises, what the page does with the click, and what the job was worth. In that order.
Search, LSA and the mix
Waste control
Landing pages & the call
Measurement & job value
Guaranteed ads first, then Google Ads, then everything else.
The order matters more than the budget. Local Services Ads have been running roughly $80 to $180 per lead for water damage work, while Google Ads leads sit nearer $600 to $740 at the median and above $1,400 in the hardest metros. So we fund the cheaper guaranteed placement to capacity before scaling ordinary campaigns.
From there, Google Ads picks up the demand LSA cannot reach — commercial losses, mold and fire enquiries, brand defence — and every campaign is held to the same cost per booked job.
- Local Services Ads funded and managed to capacity first
- Search used for the demand guaranteed ads cannot cover
- Brand terms defended cheaply instead of ignored
- One budget conversation, not three separate invoices
$180
upper end of 2026 Local Services Ads cost per water damage lead
$740
median Google Ads lead price for water damage work in 2026
Most restoration accounts we inherit are paying for the wrong calls.
Tenants who cannot authorise work, DIY queries, job seekers, insurance students, suppliers and towns forty minutes outside your area. At $8.33 a click across home improvement those add up to real money before anyone notices.
We rebuild the account around tight match types, a long negative list maintained weekly from the actual query reports, geographic targeting drawn around where your trucks go, and hours that match who answers the phone at 3am.
- Search term review every week, not every quarter
- Negative lists built from your own call recordings
- Radius targeting drawn around real drive times
- Bidding adjusted for the hours you can actually respond
$8.33
average cost per click across home and home improvement search
A wet phone, one hand, ninety seconds.
The click arrives from somebody standing in a mess. The average home service site takes 8.7 seconds to load on mobile and 53% of visitors abandon anything slower than three seconds — at restoration click prices that is the most expensive bounce in the trades.
We build fast single-purpose pages per loss type, outside the main website so they can change within hours during a storm, with a tracked number at the top, your response time in plain words, and a short fallback form that still reaches the on-call phone.
- One page per loss type, tested on a phone over mobile data
- Tap-to-call above the fold with a tracked number
- Response time and service area stated plainly
- Pages editable within hours when a storm hits
8.7s
average mobile load time on home service websites
$90.92
benchmark cost per lead across home and home improvement
Lead counts flatter. Booked jobs do not.
A restoration account can show a falling cost per lead while the crews sit idle, because half the leads were the wrong postcode. We measure the other end instead: tracked numbers by loss type, qualified jobs pushed back from your CRM, and average job value in the report next to the spend.
It also keeps the channel comparison fair. The market is fragmented — 62,582 US firms sharing about $7.2 billion — so your competitive set is local, and only local numbers matter.
- Call tracking split by loss type and service area
- Qualified jobs imported back from your CRM
- Cost per booked job reported beside organic and referral work
- Monthly written read anyone in the office can follow
62,582
US restoration firms sharing about $7.2bn of annual revenue
$1,400
cost per lead regularly exceeded in the most competitive metros
Ad accounts, analytics and call tracking stay in your name
Cost per booked job is the metric we are judged on
Weekly working session with the people doing the work
Long-term lock-ins
We made the difference for those brands

B2B software, fintech, insurance
Travel & mobility

Creative, content, arts & culture

Beauty, personal care & wellness

Travel & mobility

Home essentials, appliances, kitchen & pet

Apparel and lifestyle

Beauty, personal care & wellness

Travel & mobility

Creative, content, arts & culture

B2B software, fintech, insurance

B2B software, fintech, insurance

Food & beverage

Consumer tech and platforms

Travel & mobility

Apparel and lifestyle

Home essentials, appliances, kitchen & pet

Food & beverage

Food & beverage

B2B software, fintech, insurance

B2B software, fintech, insurance

Food & beverage

Creative, content, arts & culture

B2B software, fintech, insurance

Food & beverage

Home essentials, appliances, kitchen & pet

Creative, content, arts & culture

B2B software, fintech, insurance

Consumer tech and platforms

Consumer tech and platforms
Retail & commerce

B2B software, fintech, insurance
01 — The challenge
The clicks keep costing more and the crews are still waiting.
Restoration owners rarely arrive with a tracking problem. They arrive with an invoice. Spend has crept up two years running, the previous agency reports impressions and conversions that nobody can tie to a job number, and the office manager quietly says half the calls are people renting a property or asking whether a dehumidifier can be borrowed. Meanwhile a national franchise outbids everyone at 2am and the local company that does better work never gets the ring.
“We are spending more than last year and I could not tell you what a job costs us.”
At $600 to $740 for a median water damage lead, that uncertainty is the expensive part. Once every call is tracked to a loss type and a booked job, most accounts turn out to need better targeting rather than a bigger budget.
02 — Our approach
Track everything, cut the waste, then scale what books.
The first fortnight is measurement, not media. Tracked numbers per loss type and service area, conversion tracking that survives a phone call rather than counting form views, and a working session with your office staff to agree what a qualified job actually is. Without that agreement every later argument is about lead counts instead of revenue. Then we cut. Search terms reviewed weekly, negatives written from real call recordings, geography redrawn around drive times, and schedules matched to who genuinely answers at night. Guaranteed placements get funded to your crews' capacity before we scale ordinary search, because the cheaper lead should always be bought first. Only then do we grow: more budget into the loss types with capacity, dedicated pages per service, and storm-event playbooks that change copy and spend within hours rather than at the next monthly meeting. Every month you get one page with spend, calls, booked jobs and cost per job, plus a plain recommendation. You own the accounts, and we hold category exclusivity by service area so we never run two competing restoration firms.
03 — What we did
A first ninety days with the waste gone by week three.
Measurement, then the clean-up, then disciplined scaling, then a number you can hold us to.
Weeks 1-2 / Measurement
Tracked numbers before extra budget
Call tracking by loss type and suburb, conversion tracking that counts answered calls, and an agreed definition of a qualified job.
Weeks 2-4 / Clean-up
Waste cut, pages rebuilt
Negatives from real call recordings, targeting redrawn around drive times, and a fast landing page for each loss type you want more of.

Weeks 4-10 / Scaling
Budget follows crew capacity
Guaranteed placements funded first, search scaled into the loss types with capacity, and copy and spend adjusted through storm events.

Day 90 / Report
Cost per booked job, in one page
Spend, calls, booked jobs and cost per job by channel and loss type, with a plain recommendation for the next quarter.

WHAT YOU GET
Deliverables your office manager can audit.
can audit
Everything below lands in accounts you own and stays yours if you ever leave.

Account and spend audit
Where the budget goes today, which search terms waste it, and what a booked job currently costs you by channel.

Campaign and budget plan
Which loss types get funded first, how much sits in guaranteed placements, and where the ceiling is.

Emergency landing pages
Fast single-purpose pages per loss type with tap-to-call, service area and response time stated plainly.

Call tracking by loss type
Tracked numbers and CRM feedback so water, fire, smoke and mold work can be judged separately.

Ad copy and offers
Copy built on your genuine response times, certifications and insurance experience, tested every week.

Monthly reporting
Spend, calls, booked jobs and cost per job beside your other channels, with a clear recommendation.
HOW WE WORK
Operating standards, not promises.
Operating standards


Water & storm damage
Overnight emergency demand bought carefully and answered on the first ring.
ExploreFire, smoke & mold remediation
Higher value work where cost and insurance questions decide who gets called.
ExploreCommercial & large loss
Facility and property manager demand measured on qualified opportunities.
Explore

















Built on trust. Proven by results.
We partner with SMBs and Fortune 500 companies to deliver more than reach — we bring clarity, execution, and measurable outcomes. Every successful partnership starts with a strong culture fit and a shared drive to grow.






CASE STUDIES
Case studies
Website Portfolio
Video Ads
Static Ads















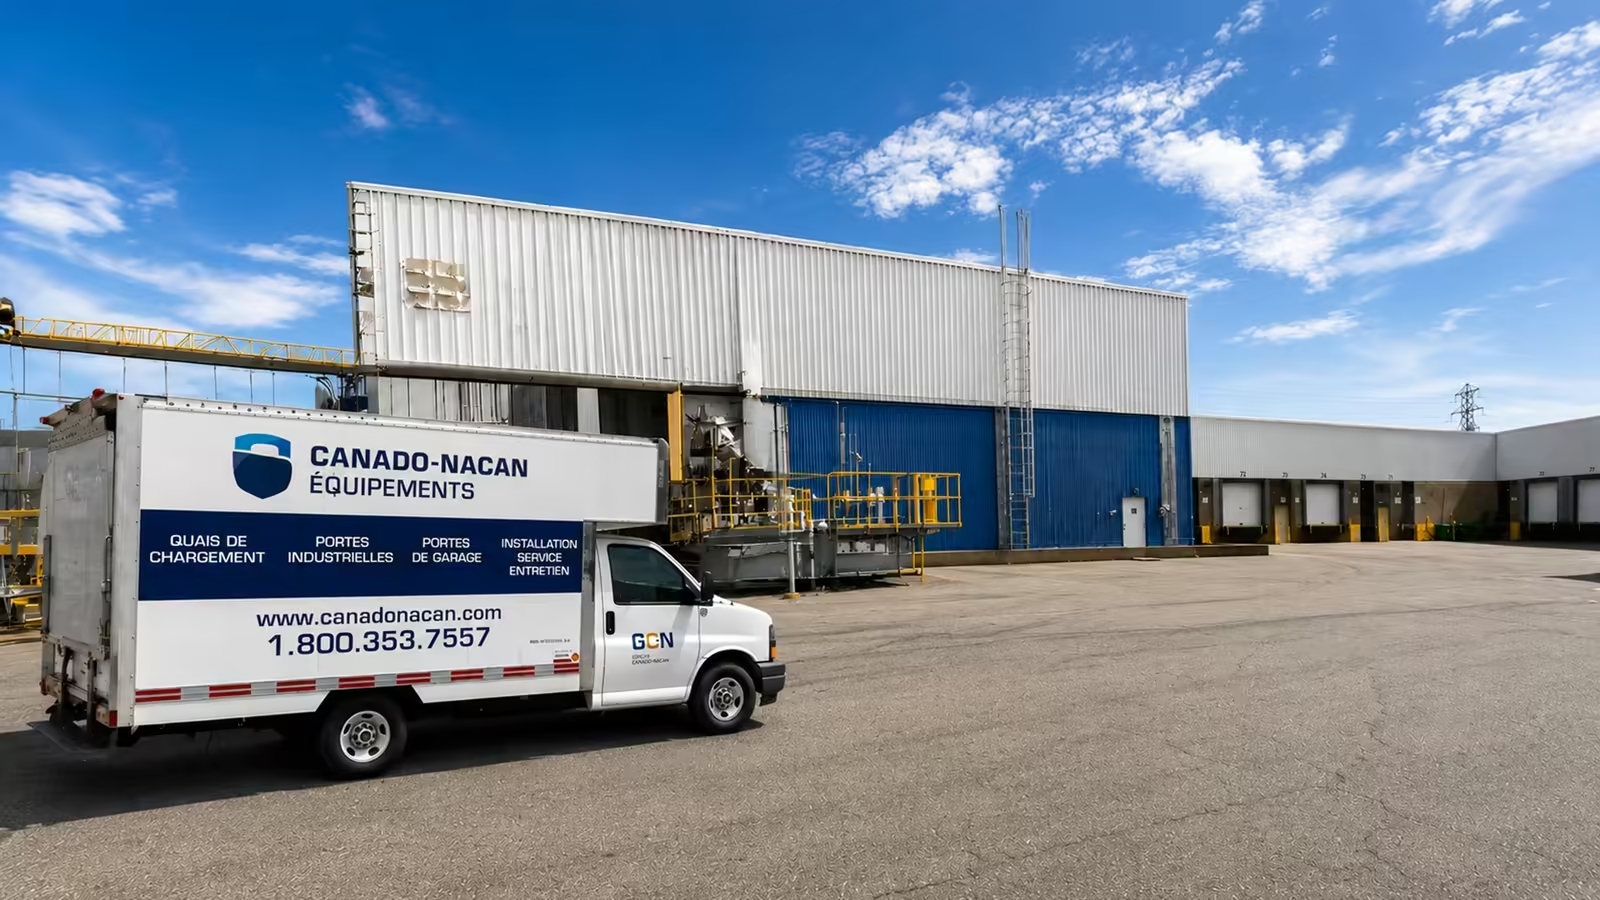

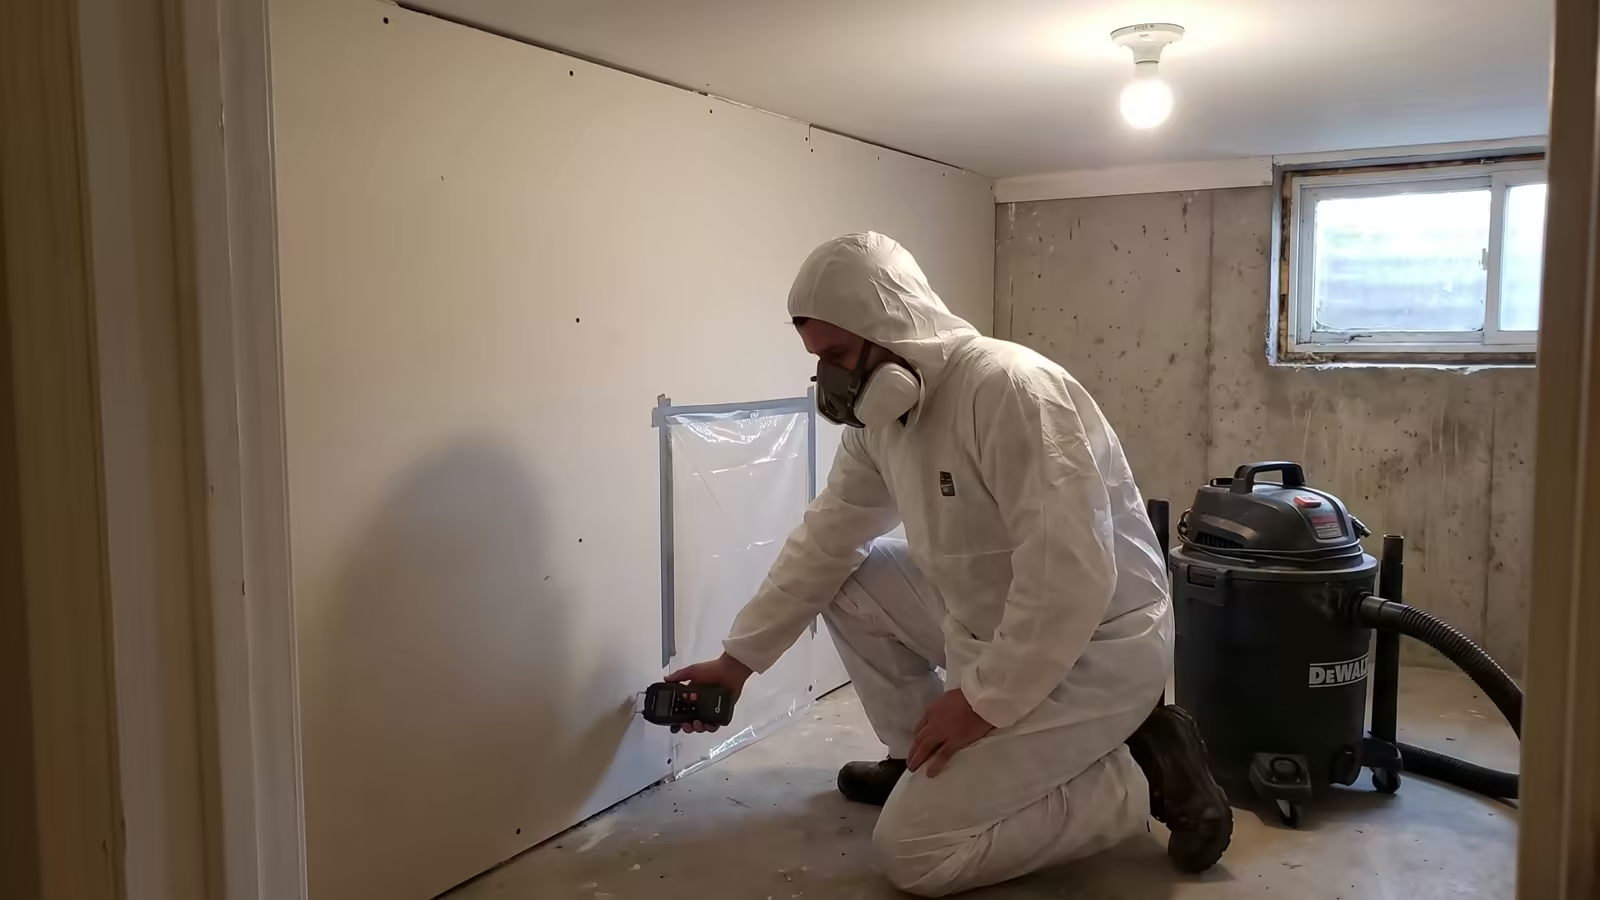

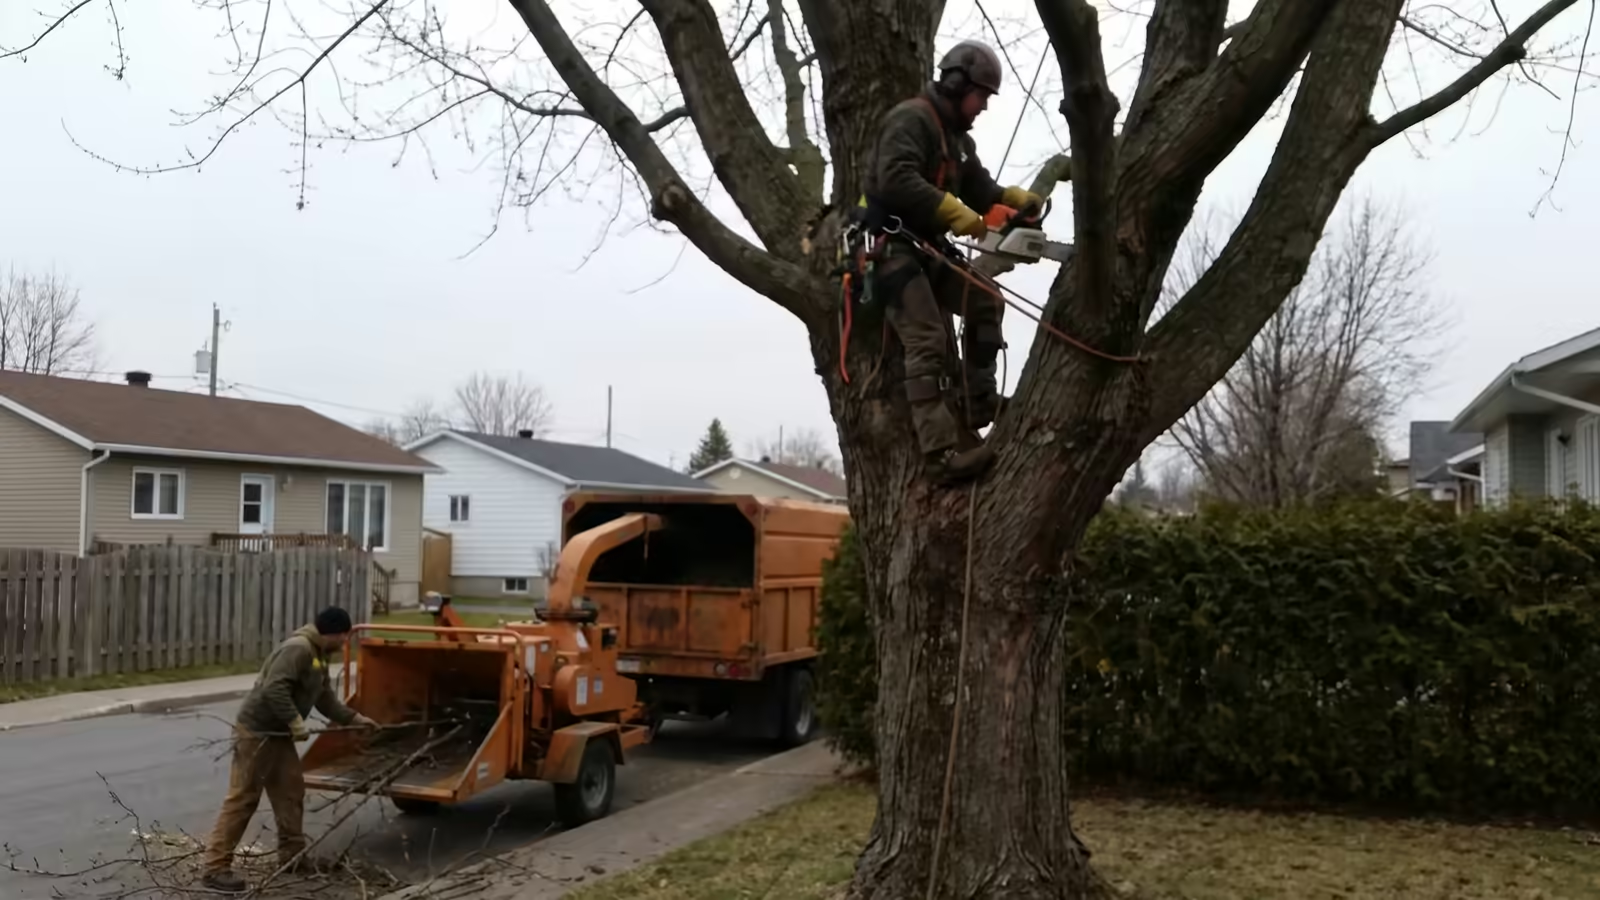



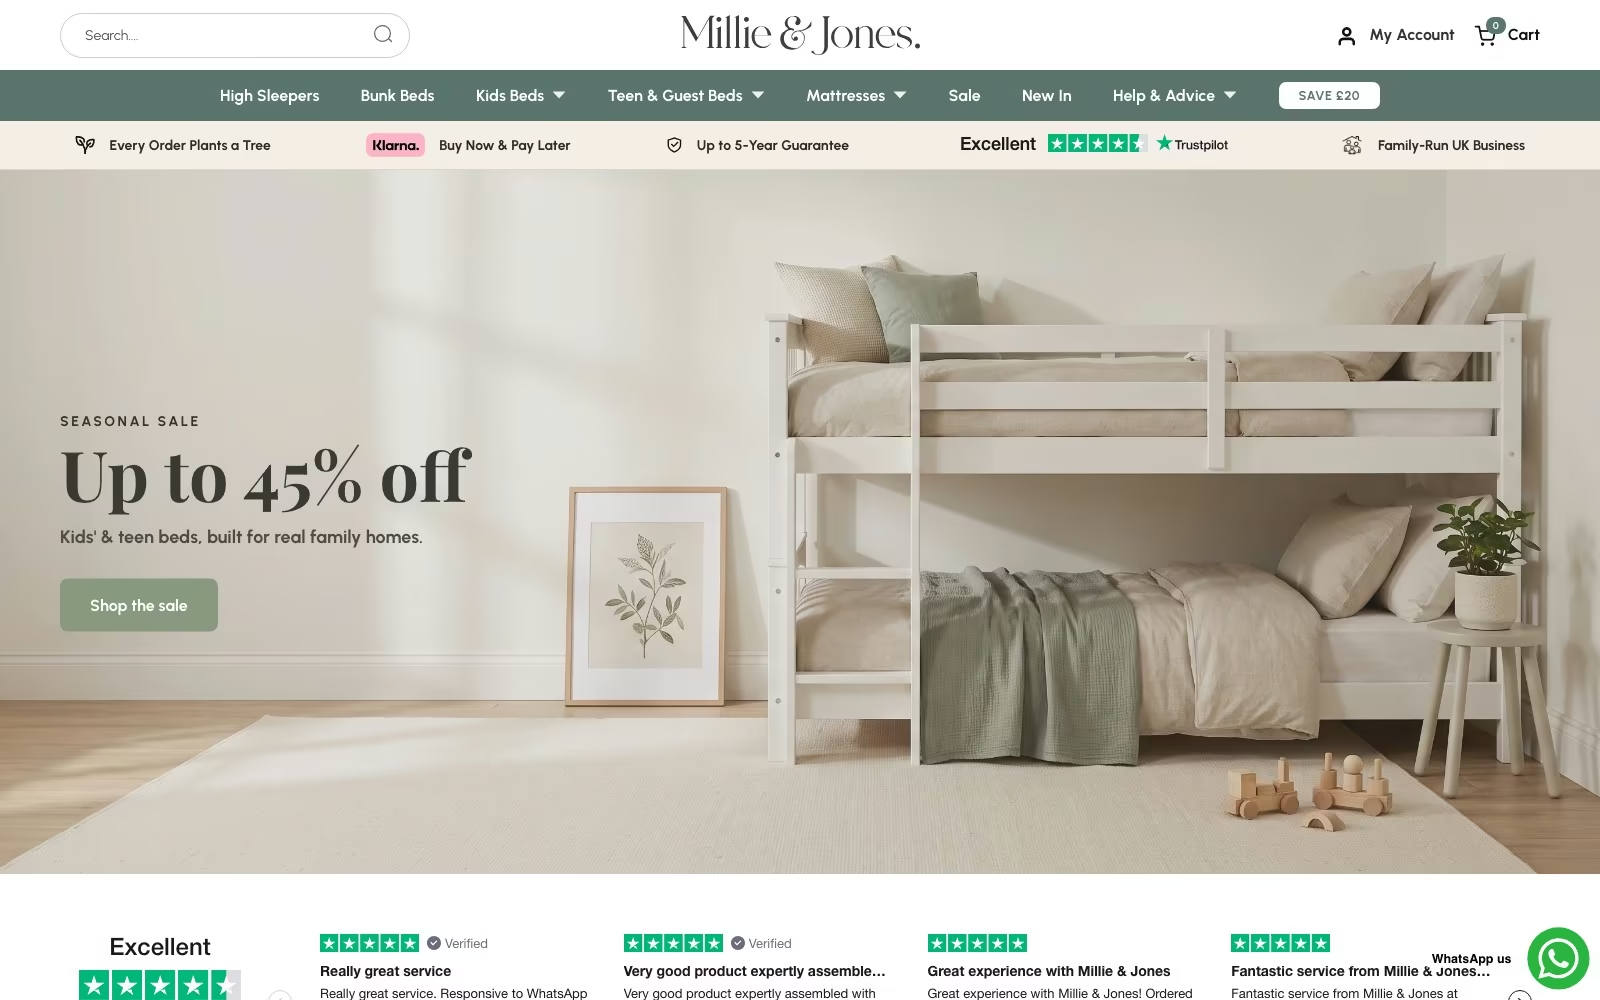

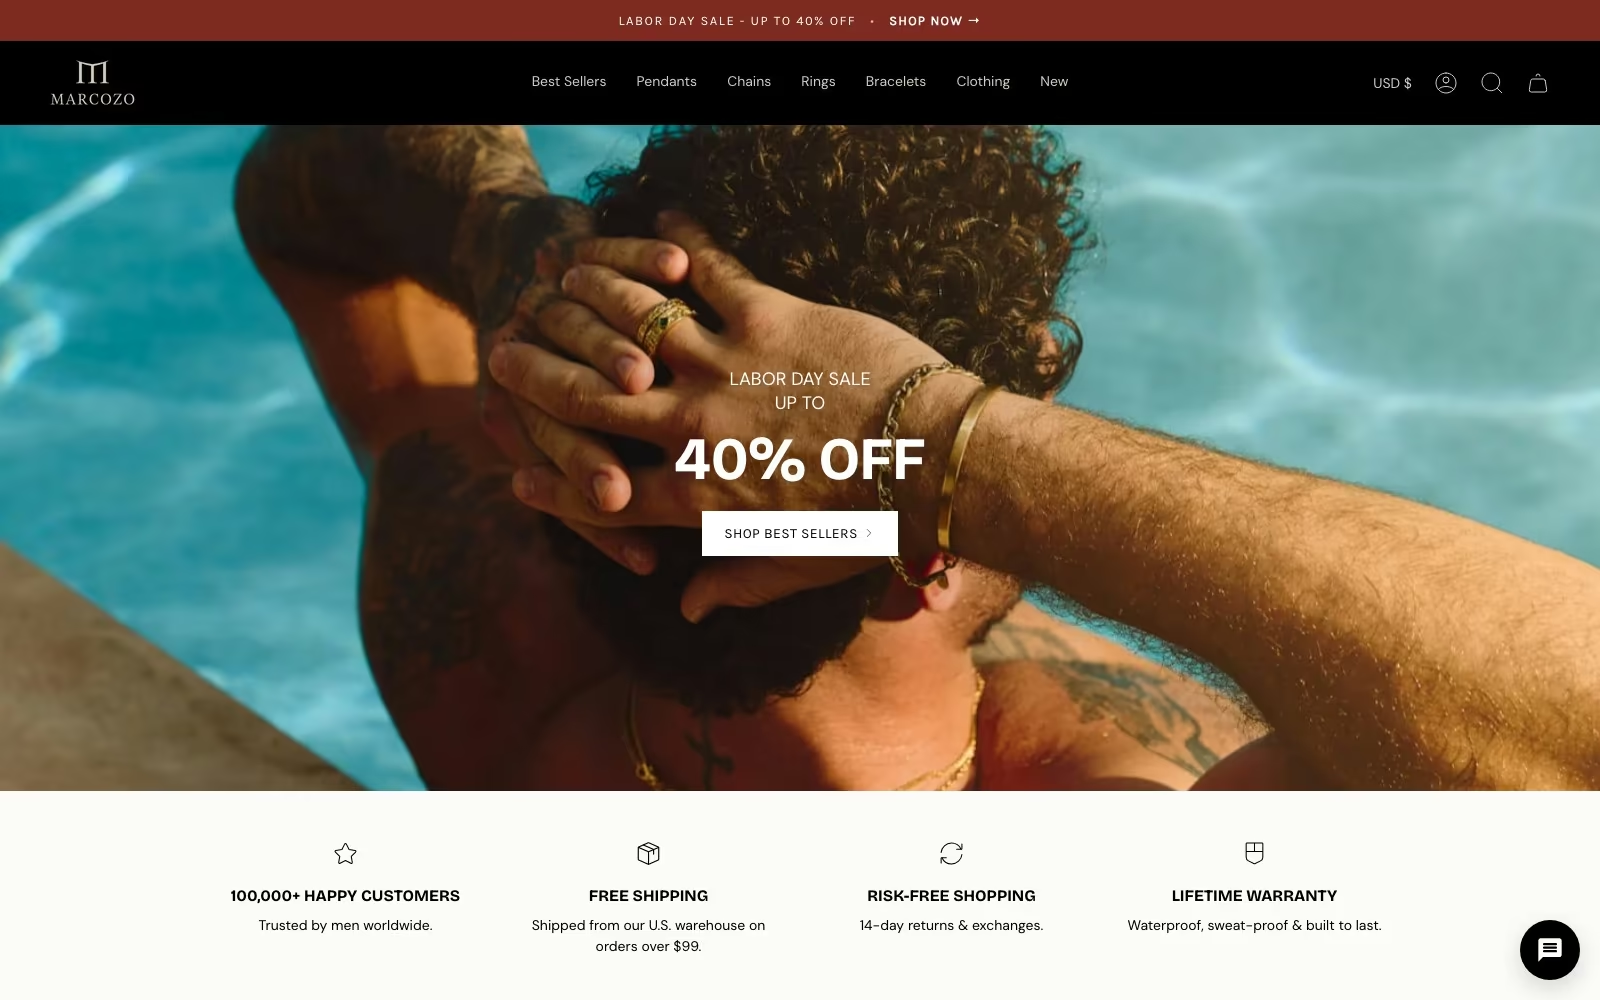













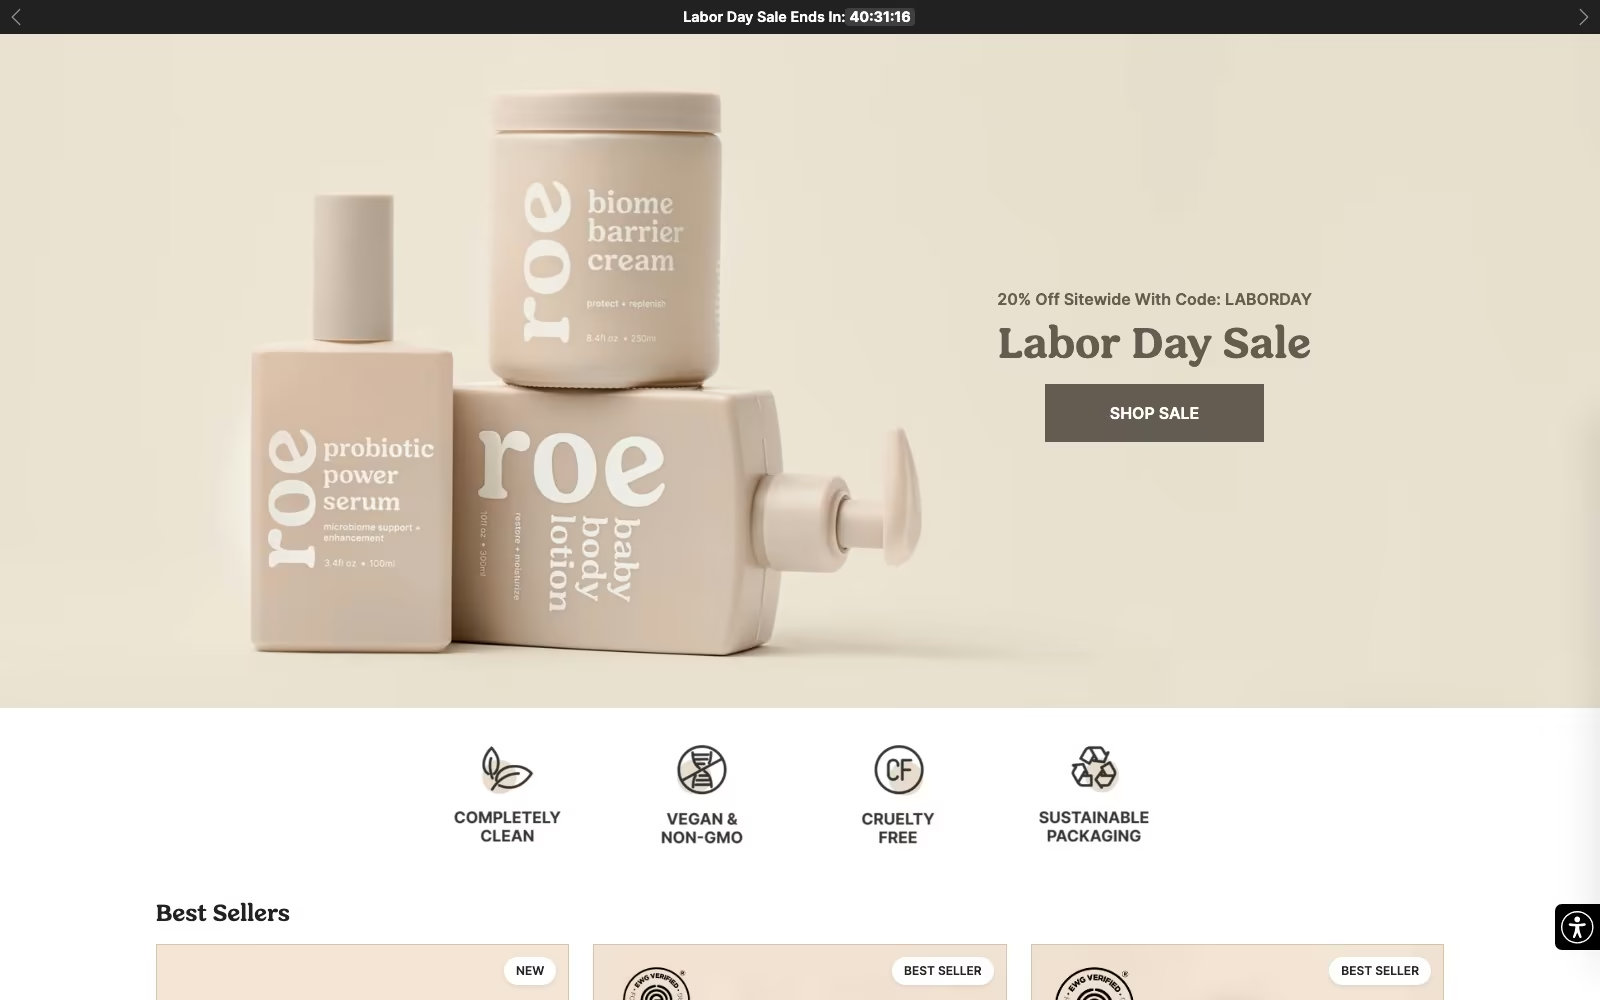



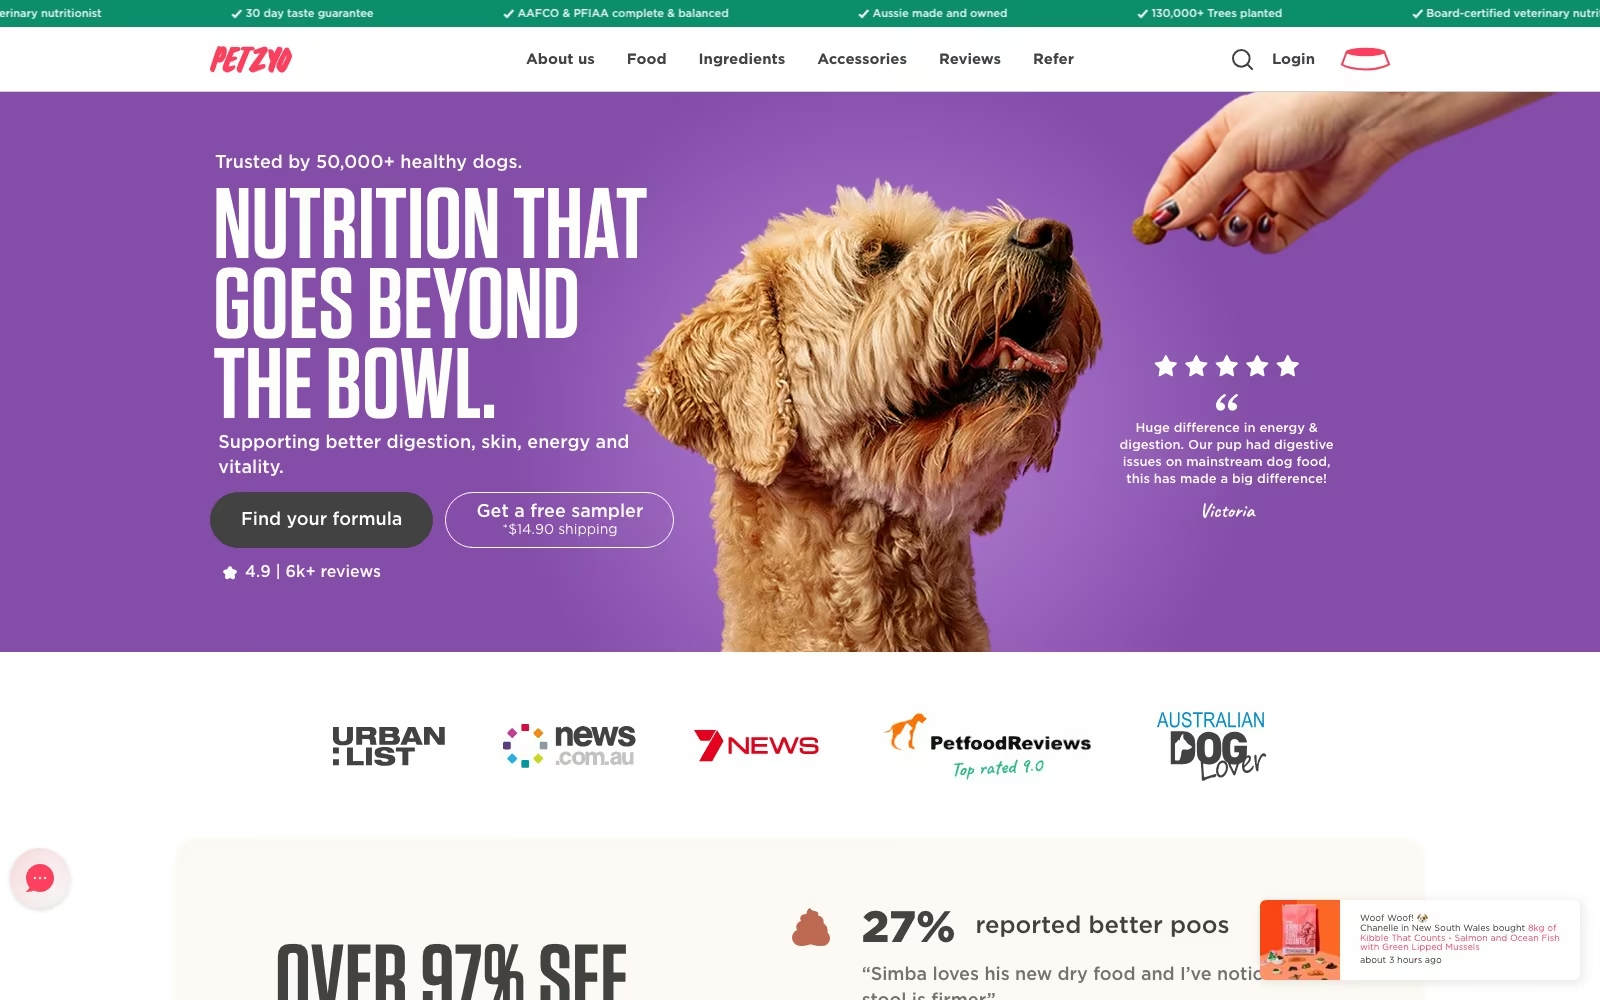


















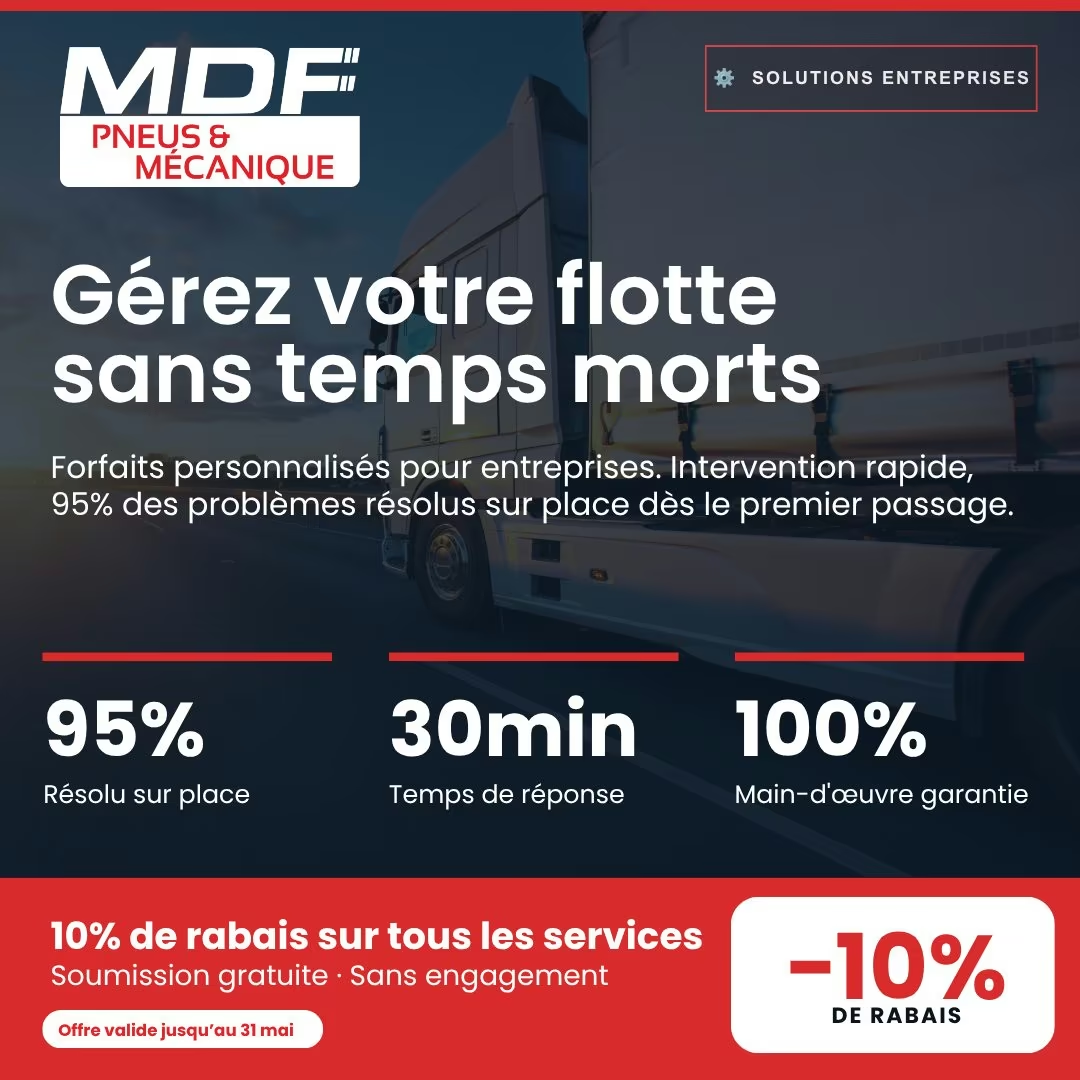







FAQ
What restoration owners ask us first.
What should a restoration company budget for paid search?
Start from job economics rather than a round number. If a water mitigation job is worth several thousand dollars and a median lead costs $600 to $740, you can afford real spend — but only at a close rate you can prove. We usually begin with guaranteed placements funded to crew capacity plus a modest search budget, then scale monthly against booked jobs instead of committing a large number on day one.
Are Local Services Ads better than Google Ads for restoration?
Cheaper per lead, usually, and they should be filled first: water damage LSA leads have been running about $80 to $180. But they cap out. They do not cover commercial losses well, they give you little control over messaging, and disputes over unqualified leads take time. Search fills the gaps and defends your brand name, so most restoration companies do best running both from one plan.
How quickly can we see results after launch?
Calls usually arrive in the first week, because this is bought demand rather than earned visibility. Useful data takes about a month, and the account is normally at its best around the third, once negatives have been written from real call recordings and the landing pages have been through a couple of revisions. Storm events accelerate everything, and we plan for them rather than react.
How do you stop us paying for unqualified calls?
By listening to them. Every week we review search terms against actual call outcomes, write negatives for tenants, DIY questions, job hunters and suppliers, tighten geography to real drive times, and adjust ad copy so the wrong caller self-selects out before clicking. Your office hears a smaller number of better calls, which is usually a bigger relief than the saved spend.
Do we need a new website before running ads?
No. We build fast standalone landing pages for the campaigns, which is quicker and cheaper than a rebuild and lets us change wording mid-storm. If your main site is also holding back organic visibility, our web design team can look at it separately, on its own business case rather than as a condition of running ads.
What happens to our ads during a major storm event?
We treat it as an operations problem, not a bidding one. Budgets and copy change within hours, pages state what your crews can genuinely reach that week, and we throttle spend when the schedule fills instead of buying jobs you cannot service. If capacity is committed to commercial losses, the money moves to the work you still want.
Can you tell which channel produced a job?
For direct response, yes: tracked numbers per loss type and tagged pages attribute the call cleanly, and CRM feedback confirms whether it became work. Some influence stays indirect, where somebody sees an ad and later queries your name, so we watch branded search and direct calls alongside the report rather than quietly claiming everything as paid.
Will you take on our competitor down the road?
No. We hold category exclusivity by service area, so once we work with a restoration company in a market we will not run campaigns for another firm competing in it. Owners ask this early and they are right to, because bidding two clients against each other in one auction raises both their costs and only benefits the agency.
What does Web Tonic charge for paid search management?
A fixed monthly fee scoped to the work, not a percentage of media, so our incentive is efficiency rather than volume, and you pay the platforms directly. There is no long-term lock-in. If paid search stops earning its place, we will recommend moving budget to organic or guaranteed placements and say so in writing.
Which loss types should we advertise for first?
The ones your crews want more of, which is not always the ones with the most search volume. Water mitigation brings volume, fire and smoke carry the highest job values, mold attracts research-stage enquiries that convert more slowly, and commercial or large-loss work is the slow prize worth building toward. We start where capacity and margin meet, then let the account data move the money.
How do you compare paid results against our other marketing?
On the same line of the same page. Spend, calls, booked jobs and cost per job for guaranteed ads, search, organic and referrals, using industry benchmarks like $8.33 average clicks and $90.92 leads across home improvement only as context, never as a substitute for your own numbers. Our analytics team builds it once and it stays consistent month to month.
Can you run our SEO and reporting as well?
Yes, and the numbers get more honest when one team holds them. Our restoration SEO and local SEO specialists work from the same plan as the paid team, so a job is attributed once instead of claimed by three vendors. Hiring us for paid alone is equally fine — everything is documented and left in accounts you own.

.webp)
.webp)


