Table of contents
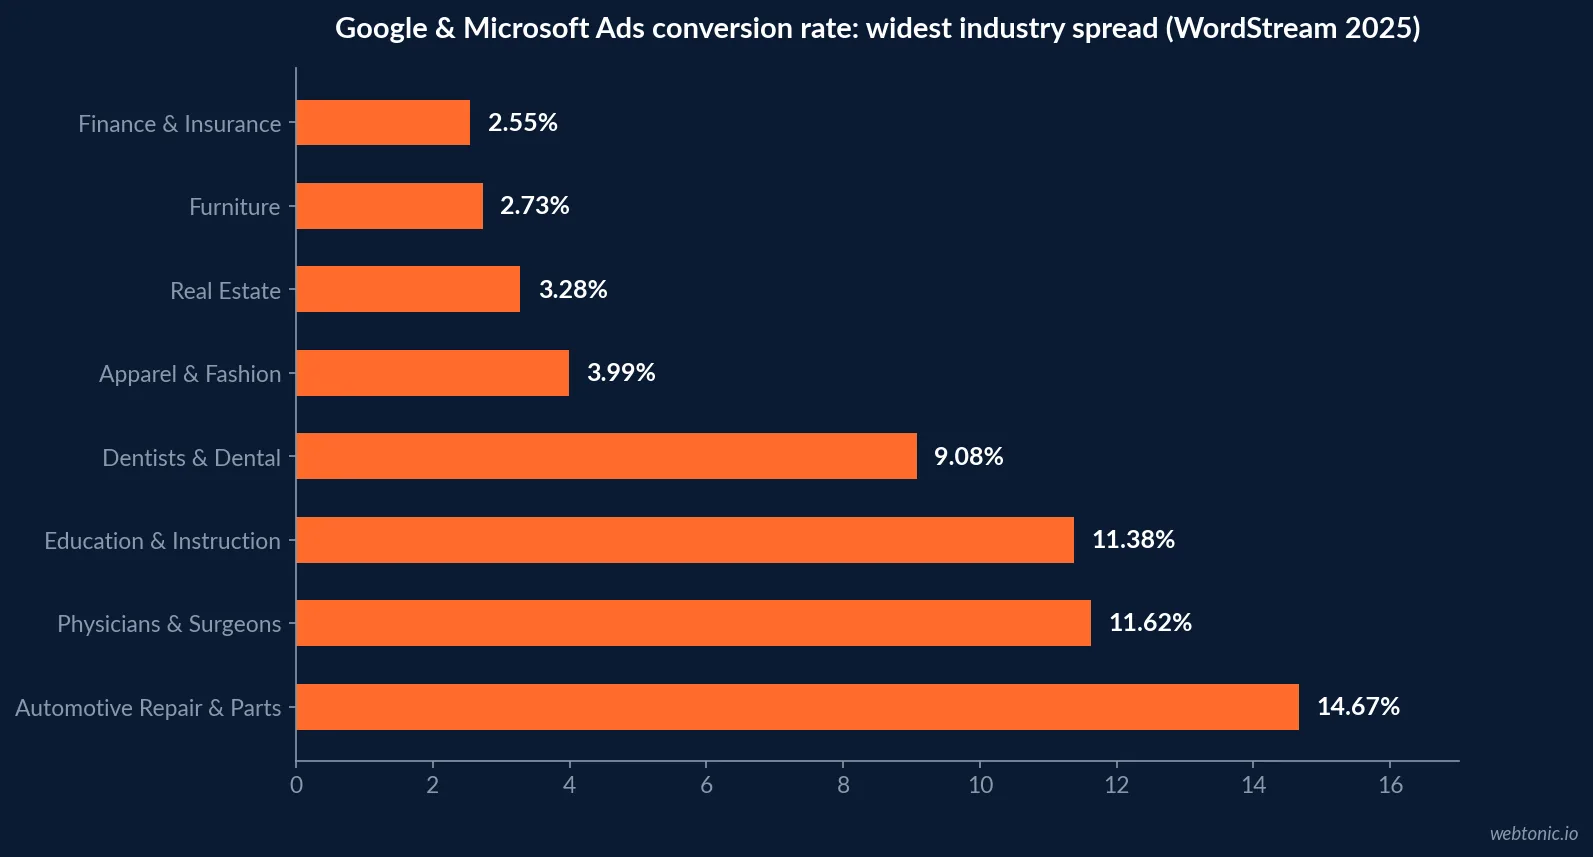
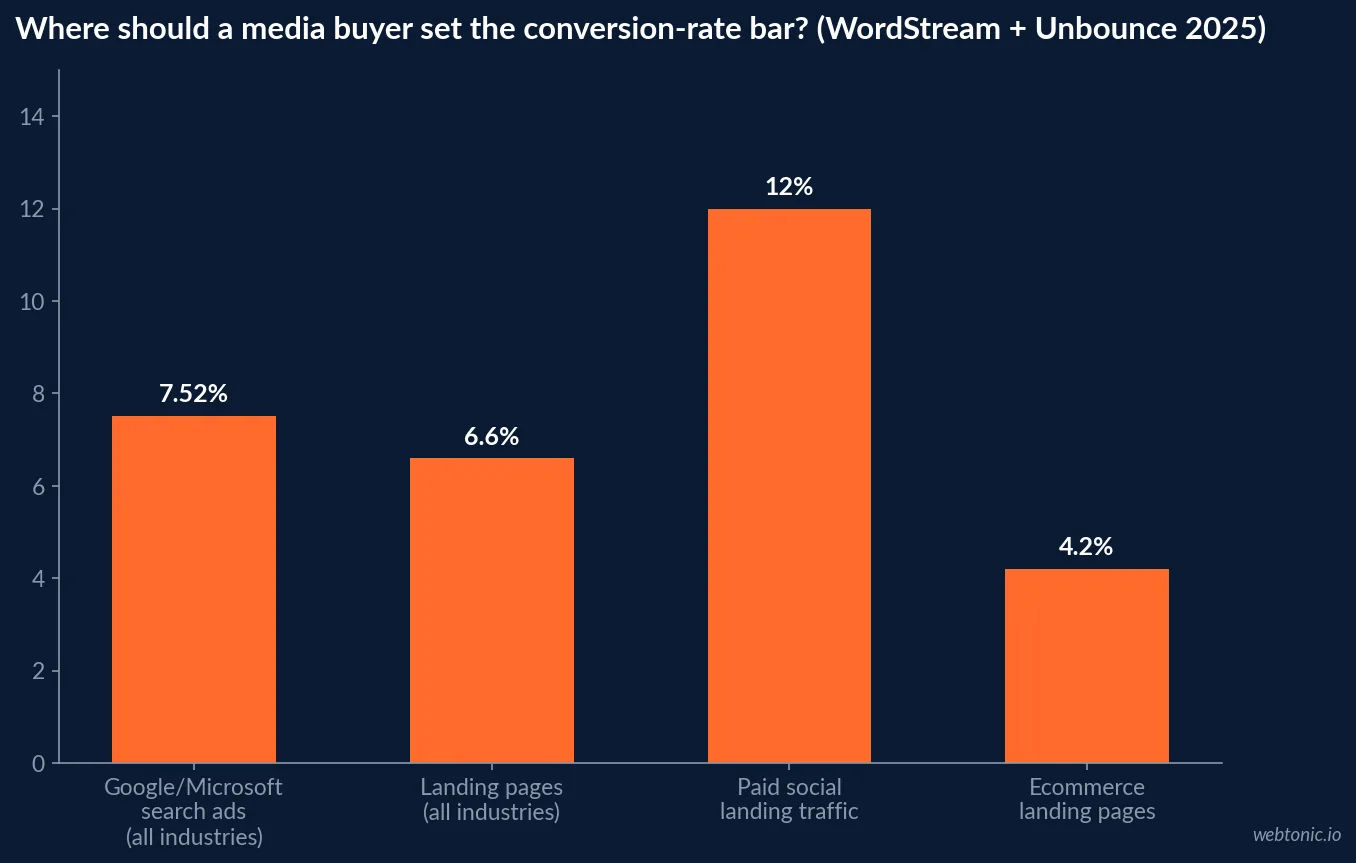
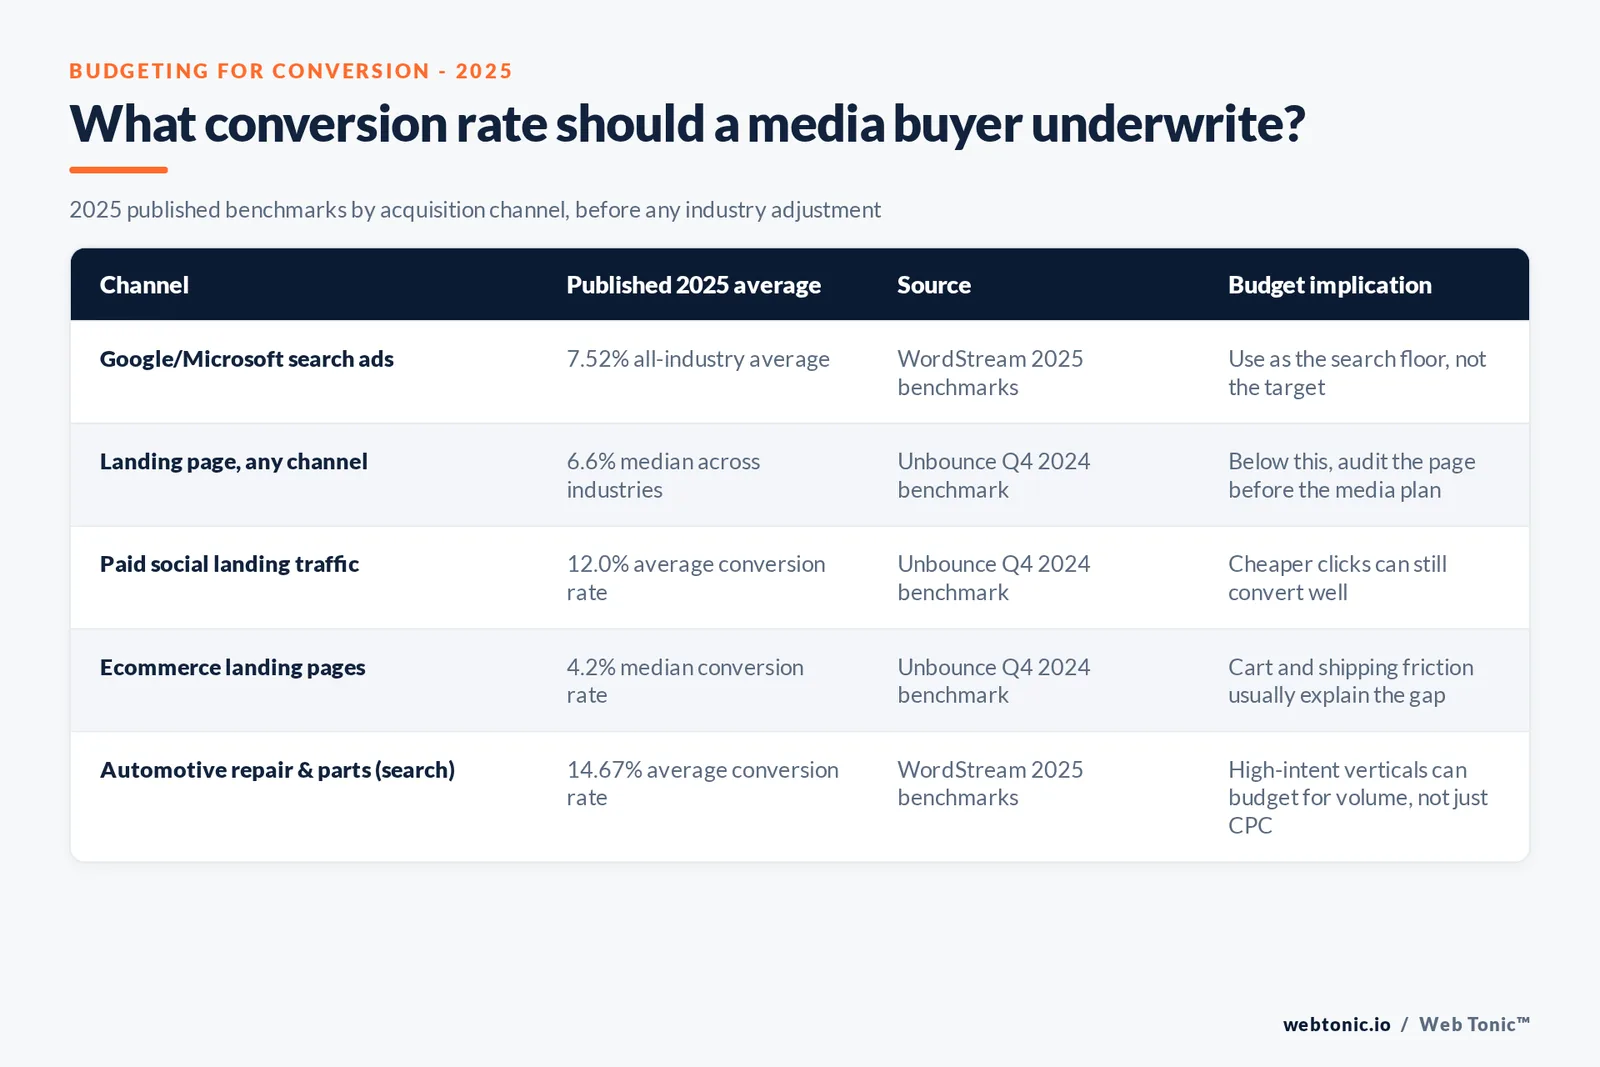
The average conversion rate across all industries in Google and Microsoft search ads is 7.52% in 2025, but that single number hides a spread wide enough to break a media plan: Finance & Insurance sits at 2.55%, Automotive Repair sits at 14.67%. Before setting a CPA target or a monthly budget, a media buyer needs the industry-specific line, the channel that produced it, and what counts as a "conversion" in that number.
Key Takeaways
- The 2025 all-industry average conversion rate for Google/Microsoft search ads is 7.52%, up from a lower rate the prior year, per WordStream's analysis of 16,000+ campaigns.
- Conversion rate increased year over year for 65% of the 23 industries WordStream tracked.
- The widest swing sits between 2.55% (Finance & Insurance) and 14.67% (Automotive Repair, Service & Parts).
- Unbounce's Q4 2024 data puts the median landing page conversion rate at 6.6% across all industries, independent of ad platform.
- Email-sourced landing page traffic converts at 19.3% on average, versus 12.0% for paid social and 10.9% for paid search (Unbounce).
- Ecommerce landing pages median 4.2% conversion, well below most lead-gen categories (Unbounce).
- Average cost per lead across all industries reached $70.11 in the same 2025 WordStream dataset — the number a media buyer should reconcile against the conversion rate, not read alone.
- Automotive Repair, Service & Parts converts nearly 6x better than Finance & Insurance in search ads — a reminder to never apply one blended CPA target across every account.
Start with the channel, not the industry average
Every "average conversion rate" figure is only meaningful next to a stated channel and a stated definition of conversion. WordStream's 2025 Google Ads Benchmarks report, produced by LocaliQ from more than 16,000 US-based search campaigns running April 2024 through March 2025, measures conversion at the ad-platform level — a form fill, a call, or another tracked action inside Google or Microsoft Ads. That is the number a media buyer sees first because it lives in the ad account.
Unbounce's Conversion Benchmark Report, built from more than 57 million landing page conversions, measures a different layer: the page itself, independent of which platform sent the click. Both numbers are legitimate. Neither should be quoted without saying which one it is, because a media plan built on the wrong layer will chase the wrong lever when performance slips.
| Business Category | 2025 Avg. Search-Ad Conversion Rate | YoY Direction |
|---|---|---|
| Automotive — Repair, Service & Parts | 14.67% | Increased |
| Animals & Pets | 13.07% | Increased |
| Physicians & Surgeons | 11.62% | Increased |
| Education & Instruction | 11.38% | Increased sharply |
| Personal Services | 9.74% | Increased |
| Dentists & Dental Services | 9.08% | Increased |
| Beauty & Personal Care | 7.82% | Increased |
| Home & Home Improvement | 7.33% | Increased |
| Health & Fitness | 6.80% | Increased |
| Industrial & Commercial | 7.17% | Increased |
| Automotive — For Sale | 7.76% | Increased |
| Restaurants & Food | 7.09% | Increased |
| Sports & Recreation | 7.62% | Increased |
| Travel | 5.75% | Increased |
| Business Services | 5.14% | Mixed |
| Arts & Entertainment | 4.84% | Mixed |
| Shopping, Collectibles & Gifts | 3.83% | Mixed |
| Career & Employment | 4.33% | Decreased |
| Real Estate | 3.28% | Decreased |
| Furniture | 2.73% | Decreased |
| Finance & Insurance | 2.55% | Decreased |
Why the same click converts so differently by industry
WordStream's own read on its 2025 dataset points to funnel proximity: categories where a search click sits close to a purchase or service decision — auto repair, dental, physician visits — post the highest conversion rates because the visitor already knows they need the service and simply needs a provider. Categories that require comparison shopping, a multi-step application, or a considered financial commitment — finance & insurance, furniture, real estate — post lower single-visit conversion rates because the buying journey extends past one session.
This matters for budgeting because a blended target CPA calculated from an all-industry average will systematically overstate what a low-intent category should spend per click, and understate what a high-intent category can profitably pay. A finance advertiser budgeting to the 7.52% all-industry average, rather than the 2.55% category average, will chronically miss its cost-per-lead target.
| Business Category | 2025 Avg. Cost Per Click | 2025 Avg. Cost Per Lead | Read for the media plan |
|---|---|---|---|
| Attorneys & Legal Services | $8.58 | $131.63 | High CPC and CPL — budget for fewer, higher-value leads |
| Home & Home Improvement | $7.85 | $90.92 | Mid conversion rate, high CPL — qualify traffic hard |
| Dentists & Dental Services | $7.85 | $83.93 | Strong CVR offsets a high CPC |
| Business Services | $5.58 | $103.54 | Lower CVR pushes CPL up despite moderate CPC |
| Beauty & Personal Care | $5.70 | $60.34 | Reasonable CPL given a high CVR |
| Automotive — For Sale | $2.41 | $38.86 | Low CPC and solid CVR — efficient category |
| Restaurants & Food | $2.05 | $30.27 | Lowest CPC in the set, easy CPL to defend |
| Finance & Insurance | $3.46 | $83.93 | Low CVR keeps CPL high despite a moderate CPC |
Landing page conversion rate: the layer search-ad averages don't show
Unbounce's Conversion Benchmark Report separates the traffic source from the page. Its headline figure — a 6.6% median conversion rate across all industries — comes from analyzing over 57 million conversions across more than 41,000 landing pages, built and hosted independently of any single ad platform. Because it isolates the page, it is the better number for diagnosing whether a conversion-rate problem is a targeting issue or a page issue.
The report also breaks conversion rate down by the channel that sent the visitor to the page, which is where the channel-mix decision really lives for a media buyer.
| Traffic source (Unbounce, Q4 2024) | Average landing page conversion rate | Read for budget allocation |
|---|---|---|
| 19.3% | Highest-converting source; protect list health before cutting send frequency | |
| Paid social | 12.0% | Outperforms paid search by roughly 10% in this dataset |
| Paid search | 10.9% | Still strong, but the lowest of the three paid/owned sources measured |
| Google paid search (search-engine cut) | 11.3% | Google converts 41% better than Bing and 95% better than Yahoo in the same report |
Ecommerce is its own category — don't blend it into lead-gen averages
Unbounce's ecommerce-specific benchmark measures a median landing page conversion rate of 4.2%, well below the 6.6% all-industry median and far below high-intent lead-gen categories like Automotive Repair (14.67%, search ads). This is not a sign that ecommerce media is underperforming — it reflects a fundamentally different conversion event: a completed purchase with payment details, versus a form fill or phone call.
Within the ecommerce benchmark itself, category matters again: the report found food ecommerce converting at 7.1% against an ecommerce-median of 4.2%, and pages written at a 5th-to-7th-grade reading level converting at 5.6% against the same baseline. A single "ecommerce conversion rate" quoted without the sub-category or the reading-level context is directional at best.
| Ecommerce cut (Unbounce, Q4 2024) | Median conversion rate | vs. ecommerce baseline (4.2%) |
|---|---|---|
| Ecommerce median (all sub-categories) | 4.2% | Baseline |
| Food ecommerce | 7.1% | +69% |
| Google paid search traffic (ecommerce) | 5.7% | +36% |
| Bing paid search traffic (ecommerce) | 3.7% | -12% |
| Email traffic (ecommerce) | 28.6% | +581% |
| Paid social traffic (ecommerce) | 5.1% | +21% |
| Paid search traffic, blended (ecommerce) | 5.2% | +24% |
Turning industry benchmarks into a media budget
A benchmark is a comparison point, not a target to reverse-engineer a bid from. The practical sequence: pull your own trailing 90-day conversion rate by campaign and channel; find the closest published category (not the all-industry blend); compare like-for-like — search ad conversion rate against WordStream's search data, landing page conversion rate against Unbounce's page-level data — and only then set a CPA or ROAS target that reflects where your number sits relative to that specific category line.
Where your own conversion rate trails the category benchmark by a wide margin, the fix is rarely "spend more." It is more often a landing page experience gap, an offer mismatch, or a lead-quality problem further down the funnel that the benchmark cannot see.
| Budgeting question | Benchmark to check | 2025/2024 published figure | What a gap usually means |
|---|---|---|---|
| Is my search-ad CVR normal for my industry? | WordStream 2025 industry table | 2.55%–14.67% range across 23 categories | Below your category line: audit ad-to-page match |
| Is my landing page underperforming the channel? | Unbounce all-industry median | 6.6% median, Q4 2024 | Below median: test page load speed, form length, headline match |
| Am I over-indexed on a low-converting channel? | Unbounce channel breakdown | 19.3% email vs. 10.9% paid search | Heavy paid-search mix with a low CVR may need a page or offer fix, not more budget |
| Is my ecommerce conversion rate healthy? | Unbounce ecommerce median | 4.2% median, Q4 2024 | Below 4.2%: check checkout friction and mobile experience separately |
| Is my cost per lead reasonable for the conversion rate I'm seeing? | WordStream CPC/CPL table | $28.50–$131.63 CPL range, 2025 | High CPL with average CVR usually points to CPC, not conversion, as the lever |
B2B budgets run hotter than the blended average
Industry alone doesn't fully explain a media budget — buyer type does too. Databox's Google Ads effectiveness research, surveying hundreds of Google Ads users, found B2B companies paying a median of $50.44 per conversion, $9.05 more than the all-companies median, and a median monthly spend of $2,136.39, $178.33 above the all-companies figure. A media buyer running a B2B account should expect to underwrite a higher cost per conversion even before industry-specific factors are applied, simply because B2B deals typically carry longer cycles and higher deal values than the blended benchmark assumes.
This context matters when a benchmark like WordStream's 7.52% all-industry conversion rate gets used to sanity-check a B2B account: a B2B campaign converting at a lower rate but a higher deal value can still be outperforming a B2C campaign with a higher headline conversion rate. Match the benchmark to the deal economics, not just the percentage.
Know what "conversion" means before you budget against it
Every platform lets an advertiser define what counts as a conversion — a purchase, a form submission, a phone call, a specific page view — and Google's own Quality Score documentation notes that click-through rate, ad relevance and landing page experience all factor into how cheaply an account earns those conversions in the first place. Two accounts in the same WordStream industry category can report very different conversion rates simply because one counts a call and the other counts only a completed form. HubSpot's 2026 State of Marketing Report found lead-to-customer conversion ranks as the second most important KPI for marketers across company sizes — a reminder that the conversion event a media buyer is optimizing toward should map to a real revenue outcome, not just the easiest event to track.
What this means for the next planning cycle
Treat published conversion-rate benchmarks as a triage tool, not a contract. Start by identifying which layer of the funnel a given number describes — ad platform, landing page, or completed purchase — then compare it only against your own performance in that same layer and the closest matching industry category. A media buyer who sets next quarter's CPA target from the 7.52% all-industry average, rather than their own category's line, is budgeting against a number that may not describe their business at all. Web Tonic's data intelligence practice and growth marketing services both start from this same category-matching step before recommending a budget shift; see our related breakdown of what Google Ads actually costs by industry in 2026 for the spend side of this same equation.
Frequently Asked Questions
What is a good average conversion rate by industry?
There is no single number — it depends on the channel and the industry. WordStream's 2025 Google Ads Benchmarks report puts the all-industry average conversion rate for search ads at 7.52%, based on more than 16,000 US campaigns running April 2024 through March 2025. But the same report shows individual industries ranging from 2.55% (Finance & Insurance) to 14.67% (Automotive Repair, Service & Parts) — a nearly six-fold spread. Budget against your own industry's line, not the blended average.
Why does conversion rate vary so much between industries?
Two structural reasons show up across every benchmark set: purchase intent and conversion definition. High-converting categories like Automotive Repair (14.67%) and Physicians & Surgeons (11.62%) usually count a phone call or form fill as the conversion event, and searchers in those categories tend to be close to a decision. Lower-converting categories like Finance & Insurance (2.55%) and Furniture (2.73%) often require a multi-step application or a higher-value purchase decision, which naturally suppresses a single-session conversion rate.
Should a media buyer use search ad conversion rate or landing page conversion rate to set a budget?
Use both, for different jobs. Search ad conversion rate (WordStream: 7.52% all-industry, 2025) tells you what a click is worth inside a specific ad platform's own attribution window. Landing page conversion rate (Unbounce: 6.6% median across industries, based on Q4 2024 data across 41,000+ pages) isolates the page itself from the channel that sent the traffic. A media plan that budgets only against the platform number can miss a landing page problem masquerading as a targeting problem.
How much does channel change the conversion rate for the same industry?
Substantially. Unbounce's 2024 Conversion Benchmark Report found email-driven landing page traffic converting at 19.3% on average, compared with 12.0% for paid social and 10.9% for paid search reaching the same style of page. A media buyer moving budget from email to paid social without adjusting the offer or landing page should expect the blended conversion rate to fall, independent of targeting quality.
Is ecommerce conversion rate comparable to lead-gen conversion rate?
Not directly. Ecommerce conversion counts a completed purchase, typically a multi-field checkout with a real payment; lead-gen conversion often counts a short form or click-to-call. Unbounce's ecommerce-specific landing page benchmark sits at a median of 4.2%, well below WordStream's Automotive Repair search-ad figure of 14.67%, because the two are measuring fundamentally different customer commitments. Always compare a rate to others measuring the same funnel step.
Sources
WordStream — 2025 Google Ads Benchmarks by Industry
WordStream — Digital Benchmarks by Industry: PPC
Unbounce — Conversion Benchmark Report
Unbounce — What Is the Average Landing Page Conversion Rate?
Unbounce — Ecommerce Conversion Rate Benchmark
Google Ads Help — About Quality Score for Search Campaigns
Databox — Who Gets the Best Use Out of Google Ads? (B2B vs. B2C)
HubSpot — 2026 Marketing Statistics, Trends & Data