



PPC judged on profit per order, not on ROAS screenshots.
profit per order
Most ecommerce PPC accounts running Google Ads are not badly optimised, they are badly measured: a reported ROAS built on double-counted conversions, a Shopping catalog nobody has opened in a year, and a Performance Max campaign quietly buying back the brand searches you already own. We rebuild the feed, the structure and the measurement, then manage the spend against contribution with our analytics team.






Tell us a little about your brand and we'll be in touch within 24 hours to lock in a time.



FOUR WORKSTREAMS
Four workstreams behind PPC that survives a margin review.
survives a margin review
Ecommerce PPC on Google Ads is four jobs running together: a clean product feed, a campaign structure you can steer, measurement the finance team believes, and creative and landing pages that earn the click's worth.
Shopping catalog management
Campaign structure & bidding
Tracking & measurement
Creative & landing pages
Your product catalog is the campaign.
Shopping and Performance Max bid on your data, not on your keywords, so a truncated title, a missing GTIN or a stale price is a budget decision whether you meant it or not. We rebuild titles around how people search, fix attributes and availability, split the catalog into product groups that can be steered by margin, and keep Merchant Center disapprovals from quietly killing your best sellers.
Shopping placements earn it. Across 500+ ecommerce accounts, Shopping averaged a $0.68 CPC and 5.1x ROAS against $1.42 and 3.4x on Search.
- Titles and attributes rewritten for how shoppers search
- Product groups split so margin can steer the bidding
- Merchant Center disapprovals monitored, not discovered
- Price, stock and promotion data kept current
$0.68
average ecommerce Shopping CPC (500+ accounts)
5.1x
average Shopping ROAS in the same dataset
A structure you can actually steer.
One Performance Max campaign holding the entire catalog is convenient for the platform and useless for you: brand and non-brand blur together, the products that already sell absorb the budget, and there is no lever left to pull. We separate brand from acquisition, give best sellers, long-tail products and clearance their own campaigns and targets, and set bidding to what each group is actually worth.
The gaps between campaign types are large enough to matter: Performance Max averaged a $43.16 cost per acquisition against $50.71 on Search in the same benchmark.
- Brand and acquisition spend separated and reported apart
- Best sellers, long tail and clearance on their own targets
- Search terms mined weekly, negatives applied
- Bidding set to margin, not to a platform default
$43.16
average Performance Max cost per acquisition
$50.71
average Search cost per acquisition
Numbers the finance team will sign off.
Before we change a bid we make the data honest: server-side conversion tracking, deduplication across platforms, offline and returns data fed back, and revenue reported net of refunds. Then we set targets in contribution rather than revenue, because a 4x return on a 20% margin product and a 4x return on a 60% margin product are different businesses.
New-customer value gets measured separately, so paying more for a first order is a decision with evidence behind it rather than an argument between the marketing and finance sides of a spreadsheet.
- Server-side tracking with deduplicated conversions
- Revenue reported net of refunds and cancellations
- Targets set in contribution margin, not blended ROAS
- New versus returning customer value split out
2.8%
average ecommerce Search conversion rate (500+ accounts)
The click is bought. The sale is not.
Half of ecommerce paid performance is decided after the click, and it is the half most accounts never touch. We match the landing page to the promise in the ad, put shipping cost, delivery time and returns where they can be read before the cart, and test offers instead of shuffling headlines.
The scale of the leak is well documented: average cart abandonment sits at 70.22% across 50 studies, and most of it is caused by things a landing page and a checkout can answer.
- Landing pages matched to the ad's promise
- Shipping, delivery and returns visible before the cart
- Offer and bundle testing, not headline shuffling
- Post-click behaviour reviewed with the media numbers
70.22%
average documented cart abandonment (Baymard, 50 studies)
Ad accounts, feed and tracking stay in your name
A written log of every change and what it did
Working session with the people doing it
Long-term lock-ins
We made the difference for those brands

Consumer tech and platforms

Creative, content, arts & culture

Consumer tech and platforms

B2B software, fintech, insurance

Creative, content, arts & culture

Retail & commerce

Home essentials, appliances, kitchen & pet

Creative, content, arts & culture

Consumer tech and platforms

Consumer tech and platforms

B2B software, fintech, insurance

Healthcare & regulated services

Consumer tech and platforms

Apparel and lifestyle

Home essentials, appliances, kitchen & pet

Food & beverage

Healthcare & regulated services

Creative, content, arts & culture

Retail & commerce

Beauty, personal care & wellness

Creative, content, arts & culture

Food & beverage

Apparel and lifestyle

B2B software, fintech, insurance

Beauty, personal care & wellness

Creative, content, arts & culture

Home essentials, appliances, kitchen & pet

Consumer tech and platforms

Travel & mobility

Food & beverage
01 — The challenge
The account reports 6x. The bank says otherwise.
PPC spend is up, the ads platform is delighted with itself, and the profit and loss statement has not moved. Somewhere between double-counted conversions, brand searches billed as acquisition and refunds nobody subtracts, the reported number stopped describing the business.
“Every dashboard says we are winning. Nothing in the bank agrees.”
The fix is boring and it works: honest tracking, brand split out, targets set in margin. Benchmarks help calibrate what good looks like — the average ecommerce account runs a $1.42 Search CPC, a 2.8% conversion rate and 3.4x ROAS — but the only number that settles an argument is contribution per order.
02 — Our approach
Fix the data, fix the feed, then spend with intent.
We start with measurement, because tuning Google Ads campaigns on numbers nobody trusts wastes a quarter. Server-side tracking, deduplication, refunds subtracted, new-customer value separated, and targets restated in contribution instead of blended ROAS. Next comes the product feed, which is what Shopping and Performance Max actually bid on: titles written the way shoppers search, attributes and availability corrected, disapprovals cleared, and the catalog split into groups that can be steered by margin rather than by volume. Then the structure — brand separated from acquisition, best sellers and long tail on their own budgets and targets, search terms mined weekly, negatives applied, bidding matched to what each group is worth. Finally the post-click half: landing pages that keep the ad's promise, shipping and returns stated before the cart, and offer testing. Every PPC decision is reported in orders and margin, with the ads and keywords behind it named.
03 — What we did
Six weeks to a rebuilt account, then a weekly rhythm.
Measurement, feed, structure and post-click — in sequence, with a weekly check on spend and a monthly written read.
Weeks 1-2 / Measurement
Make the numbers honest first
Tracking rebuilt server-side, conversions deduplicated, refunds subtracted, and targets restated in contribution margin.

Week 3 / Feed
The catalog, rewritten for the auction
Titles, attributes and availability corrected, disapprovals cleared, and product groups split so margin can steer the spend.

Weeks 4-5 / Structure
Brand out, acquisition in view
Campaigns rebuilt so brand, best sellers, long tail and clearance each carry their own budget, target and report line.

Week 6 onward / Post-click
The half that happens after the click
Landing pages matched to the ads, shipping and returns surfaced early, and a testing queue that runs offers rather than headlines.

WHAT YOU GET
Deliverables your team can pick up and run.
pick up and run
Everything below is delivered in working files and accounts that stay yours if you ever leave.

Account and campaign plan
Brand, acquisition, best sellers and clearance mapped to campaigns with a budget and a target attached to each.

Shopping catalog rebuild
Titles, attributes, availability and product groups corrected, with the rules documented so new items inherit them.

Tracking and margin reporting
Server-side conversion tracking, deduplication and a report that reads in orders and contribution rather than platform ROAS.

Ad creative and copy
Google Ads copy, assets and extensions built per product group, refreshed on a schedule instead of when performance drops.

Weekly optimisation log
What changed, why, and what it did — search terms, negatives, bids and budgets, written down every week.

In-house playbook
Naming, budget rules, catalog checklist and the review cadence your team needs to run the account without us.
HOW WE WORK
Operating standards, not promises.
Operating standards



















Built on trust. Proven by results.
We partner with SMBs and Fortune 500 companies to deliver more than reach — we bring clarity, execution, and measurable outcomes. Every successful partnership starts with a strong culture fit and a shared drive to grow.






CASE STUDIES
Case studies
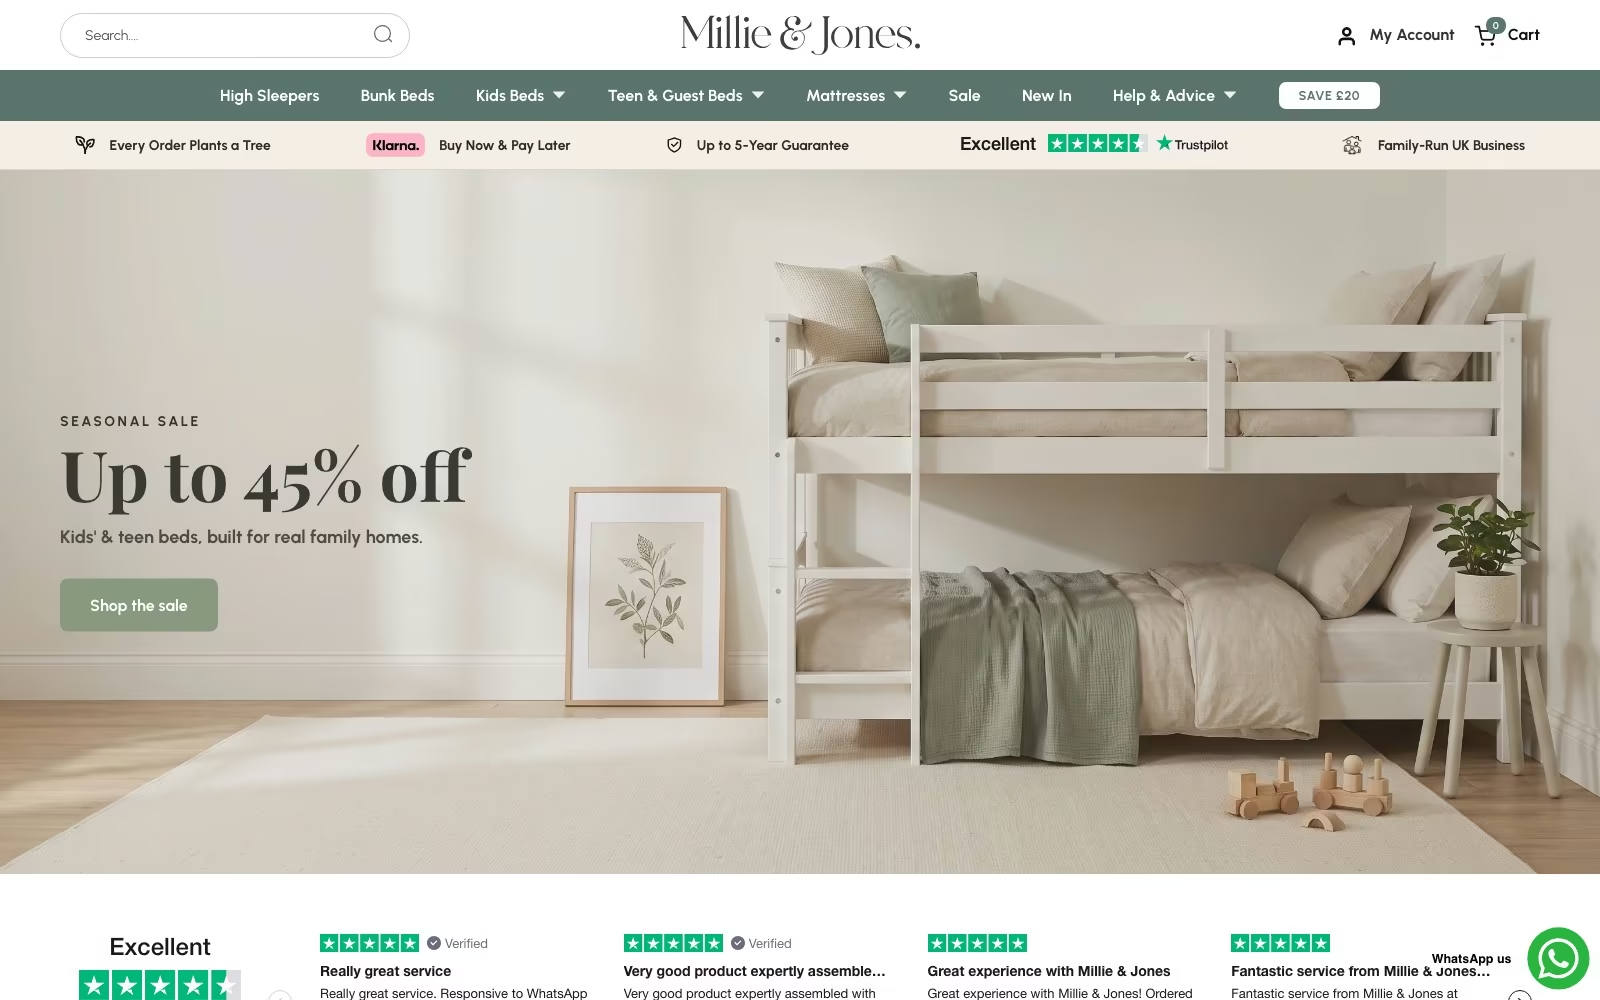
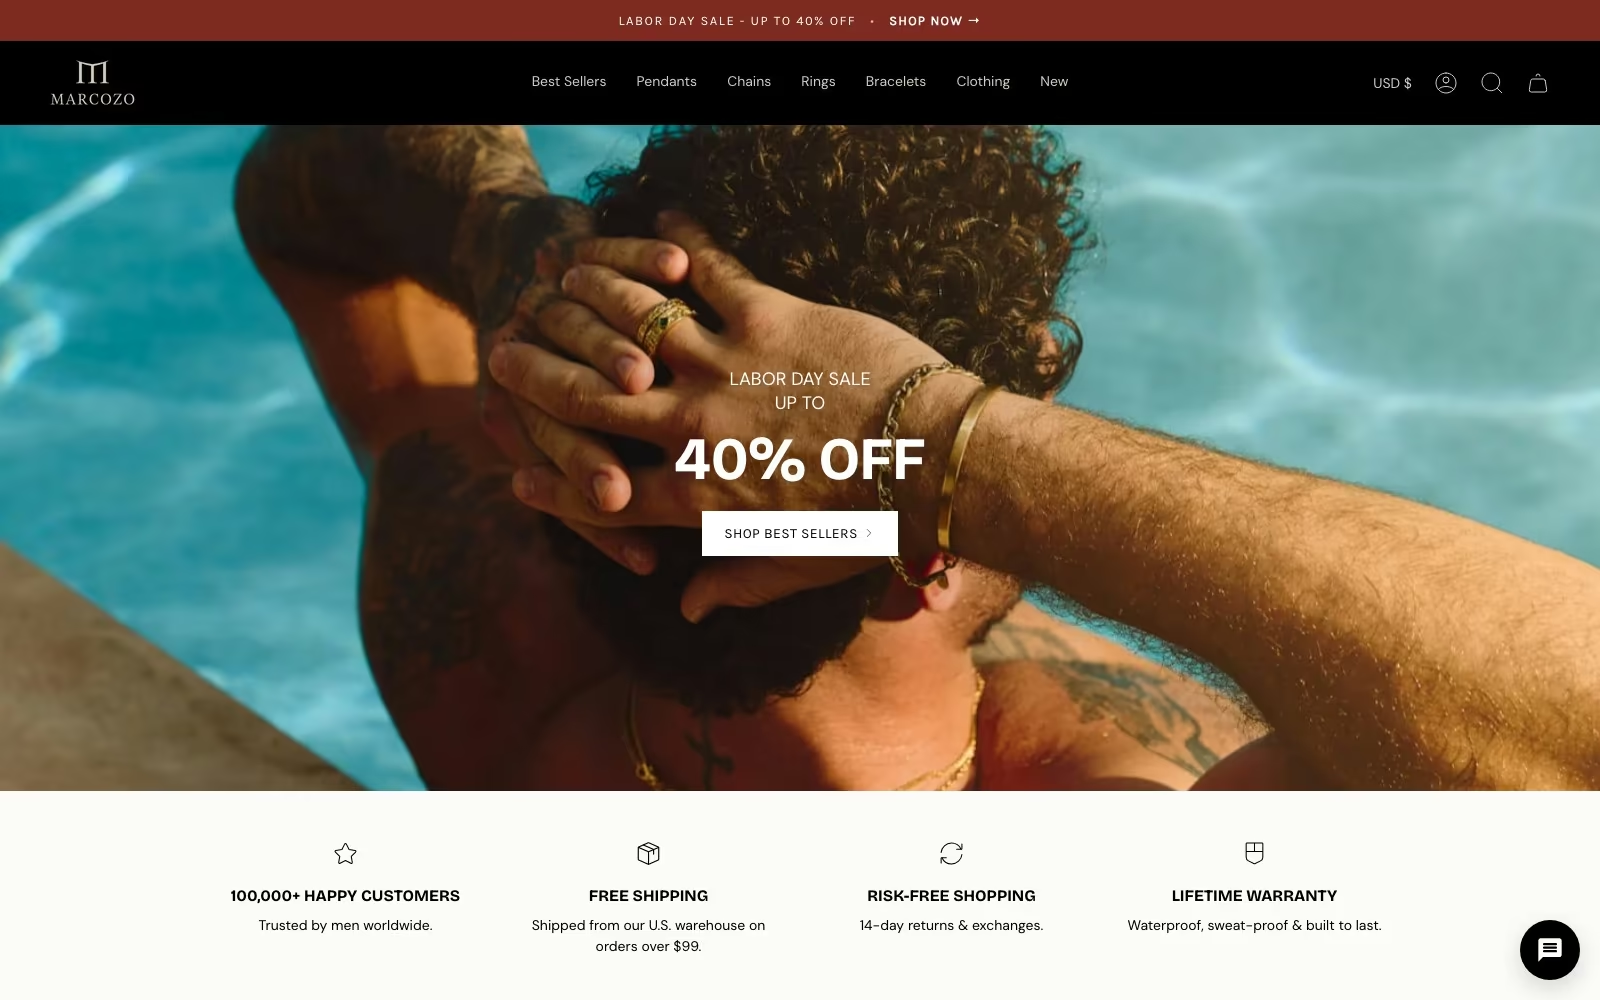
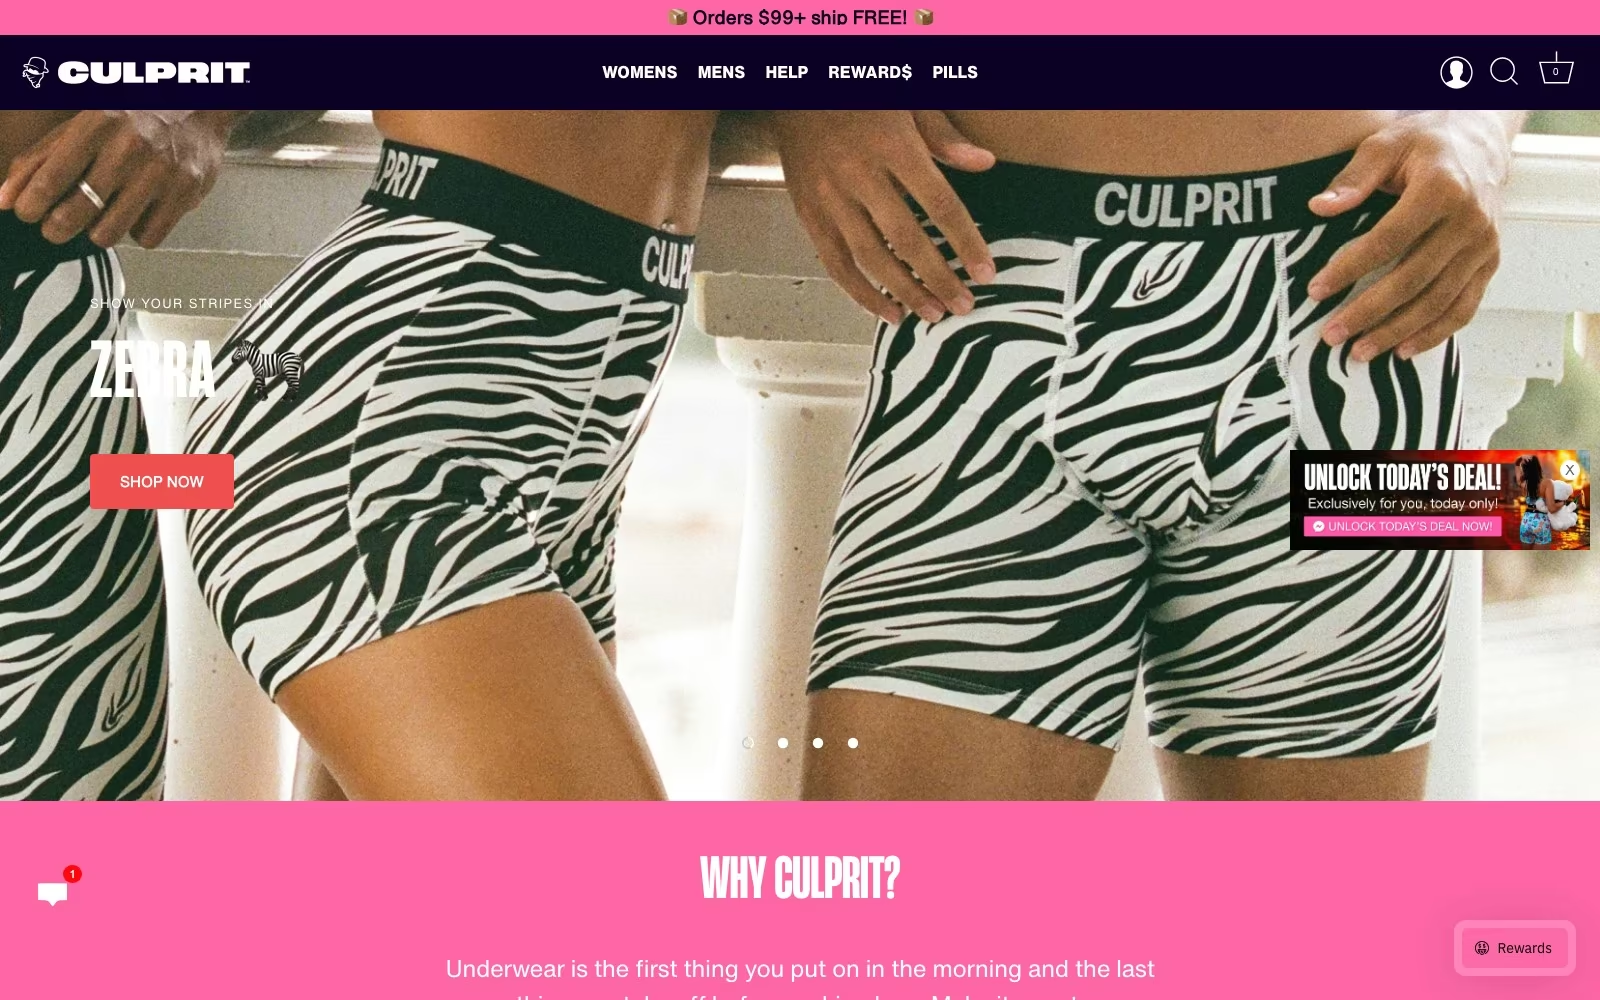
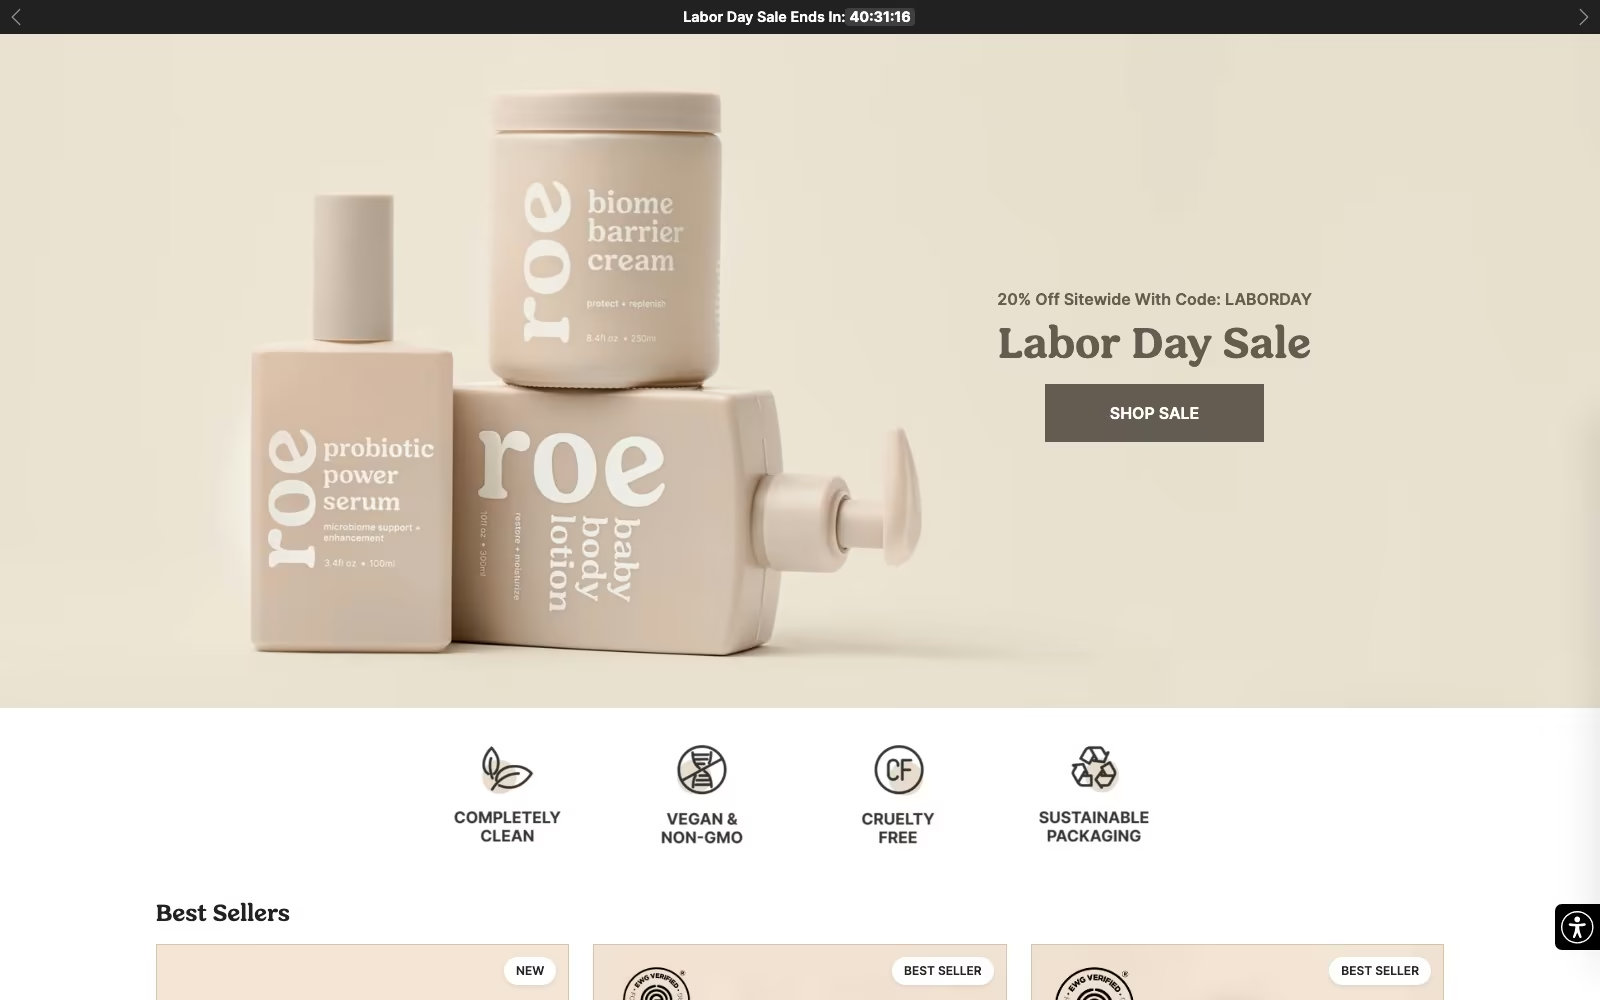
Website Portfolio
Video Ads
Static Ads




































































FAQ
What store owners ask us first.
What does ecommerce PPC management cost?
A fixed monthly PPC management fee scoped to the work, quoted before anything starts and kept separate from your media spend. We avoid percentage-of-spend pricing for stores because it pays the agency to spend more rather than to spend well, and it makes the honest recommendation — cut this campaign — expensive to give. Scope follows catalog size, the number of campaigns and how much catalog work is needed. After a first review you get a plan and a target before you commit to anything.
What is a good ROAS for an online store?
The one that clears your contribution margin, which is why the question is usually asked the wrong way round. A 4x return on a 20% margin product loses money once shipping, payment fees and returns are counted, while 2.5x on a high-margin item with strong repeat purchase is excellent. For calibration, the ecommerce averages across 500+ accounts are 3.4x on Search, 5.1x on Shopping and 4.8x on Performance Max — useful context, never a target on its own.
Should we run Performance Max or Standard Shopping?
Usually both, with clear jobs. Performance Max is efficient across a catalog and, at a $43.16 average cost per acquisition against $50.71 on Search, hard to argue with on cost — but it hides where the money went and happily re-buys brand demand. We keep brand in its own campaign, run Performance Max on the catalog with a feed built to steer it, and keep Standard Shopping where a product line needs direct control. Then we read the placement and search term data monthly instead of trusting the black box.
Why does our reported ROAS look better than reality?
Three usual causes, and most accounts have all three. Conversions are counted by more than one platform, so the same order is claimed twice; brand searches sit inside an acquisition campaign, so demand you already owned is billed as new; and refunds, cancellations and shipping subsidies never make it back into the number. We rebuild tracking server-side, deduplicate, subtract returns, and split brand out, which usually lowers the reported figure and makes every decision after it trustworthy.
How important is the Shopping catalog really?
It is the campaign. Shopping and Performance Max match your data to a query, so a product whose title starts with an internal code is invisible for the phrase people actually type, and a missing size or GTIN can drop it from the auction altogether. Most accounts we take over gain more from a week of feed work than from a month of bid tuning. We rewrite titles around search behaviour, fix attributes and availability, and document the rules so new products inherit them.
How do we advertise profitably on thin margins?
By deciding what a first order is worth and refusing to guess. We measure new-customer contribution separately from repeat, look at second-order rate and time to repeat, and set acquisition targets that allow a thinner first sale where the data supports it and a strict one where it does not. On the spend side we protect margin with product groups, so the clearance line and the hero product are never bidding under the same target, and we cut the long tail that never repays its click.
Do paid campaigns and SEO compete for the same terms?
They overlap, and the overlap should be deliberate. Paid gives you same week evidence on which queries and product sets convert, which sharpens the ecommerce SEO roadmap; search then takes over terms where click costs are punishing. With organic search at 35-55% of revenue-generating sessions in established stores, the goal is a blended cost per order across both rather than two teams claiming the same sale.
What happens after the click?
Half the outcome, and the half most accounts ignore. If the ad promises free returns and the landing page mentions them in the footer, the media was wasted regardless of how well it was bought. We match pages to ads, surface shipping cost and delivery time before the cart, and test offers rather than headlines. With documented cart abandonment averaging 70.22%, post-click work is usually the cheapest performance available.
How much budget do we need to start?
Enough for the platform to learn on, which in practice means a budget that can produce a steady flow of conversions each week rather than a trickle. Below that, campaigns spend their life in learning and every read is noise. If the budget is genuinely small we narrow the ambition instead of spreading it: brand protection plus one product group with real demand, run properly, beats four half-funded campaigns. We will tell you plainly if paid is the wrong first investment for your store.
How do you decide which products to advertise?
By margin and by demand, in that order, then by what the data says once it is running. We start from a contribution view of the catalog rather than a best-seller list, because the products that sell most are often the ones that earn least. Products with genuine search demand and healthy margin get their own campaign and budget; the long tail rides in a catalog-wide campaign; loss leaders are advertised only where the repeat data justifies it. That view is revisited every month, not set once.
How do you choose an ecommerce PPC agency?
Ask any PPC agency what they will measure and listen for whether the answer is platform ROAS or contribution per order. Ask who touches the account day to day and how much of the work is automated. Ask to see a weekly change log from a current client, redacted. And ask what they would switch off in your account tomorrow — a good answer names something specific and explains the reasoning. Anyone promising a return figure before seeing the data is selling a number, not a service.
Will you use automated bidding or manual control?
Automated Google Ads bidding, informed properly, with human control over what it is optimising toward. Smart bidding is very good at picking the auctions once it is fed clean conversions, correct values and sensible groupings, and very bad at all of it when the inputs are wrong — which is why our work concentrates on the inputs. We keep manual control over structure, budgets, targets and negatives, and we review the search terms and keywords weekly because that is where automated spend goes strange first.
What reporting will we get?
A weekly PPC log of what changed and why, and a monthly written read on orders, revenue net of refunds, contribution and new-customer share, split by campaign and product group. No dashboard-only reporting, and no report that lives behind a login only we can access. If a month was poor you will read why in plain language, along with what we are changing. Clients tell us the change log is the part they keep, because it is the only record of what actually caused a movement.
Can you work with our in-house team?
Frequently, and it is often the best value. A common split is that we own the catalog, the structure, measurement and the weekly optimisation while your team owns creative production and promotions, or the reverse where you have a strong buyer but no analyst. We document naming, budget rules and the feed checklist so nothing depends on us being in the room, and we are happy to train the team to take the account back entirely.
How quickly will we see a change?
Catalog and tracking fixes tend to show inside two to three weeks because they change what the auction sees. Structural rebuilds need a learning period, so expect noisier numbers for a fortnight before they settle, and we sequence changes so the whole account is never learning at once. A fair judgement point is the end of the second month with the full picture at ninety days. We report from week one, including the weeks where the honest answer is that it is still settling.

.webp)
.webp)


