



Most DTC brands do not have a traffic problem. They have a contribution margin problem.
a contribution margin problem
An ecommerce brand rarely stalls because paid media stopped working. It stalls because the product mix hides two loss-making SKUs, because discounting has become the offer, because a repeat purchase never happens, or because every channel is judged on platform attribution nobody trusts. We diagnose the unit economics and the growth model, then hand over a written plan your team owns and runs. Advisory only, no campaign management inside the engagement. Book a meeting and bring twelve months of order, cost and ad spend data.






Tell us a little about your brand and we'll be in touch within 24 hours to lock in a time.



WHAT WE EXAMINE
Four places ecommerce growth actually leaks.
actually leaks
Reach is cheap to buy and rarely the constraint. Margin, conversion and repeat behaviour are. Baymard's meta-analysis of 50 studies puts the average documented cart abandonment rate at 70.22%, which is the tax every brand pays before a single retention email is sent. The work is to find out how much of that number is your checkout, your offer, or the traffic you chose to buy.
Unit economics and contribution margin
Channel role and acquisition efficiency
Repeat purchase and lifetime value
Offer, catalogue and conversion path
What each order actually earns after everything that leaves with it.
We rebuild contribution margin per order and per SKU from your own numbers: landed product cost, shipping and fulfilment, payment fees, returns and refunds, discount depth, and the real cost of the offer that drives volume. Brands usually know blended gross margin and rarely know contribution after acquisition by product line, which is the number that decides whether growth is worth having.
Then the same view by cohort and channel: what a first order earns, what a second one earns, and how long the brand waits to be paid back. A plan built on revenue targets rather than contribution is how a growing brand runs out of cash while the dashboard looks healthy.
- Contribution margin per order, SKU and product line
- Discount depth and promotional dependence measured
- Returns, refunds and fulfilment cost carried into the model
- Payback period by channel and cohort
70.22%
average documented cart abandonment rate across 50 studies
What each channel is for, and what it is allowed to cost.
We look at paid social, paid search, marketplaces, affiliate, email and organic as a portfolio with roles rather than a leaderboard of platform ROAS. Incremental contribution, new customer share, cost per new customer against contribution per new customer, creative volume and fatigue, and how much of reported performance is the same buyer counted twice.
The confidence problem is industry-wide. Only 49% of senior marketing and finance leaders say they can measure how marketing drives business outcomes, 71% say AI favours short-term performance and 69% feel pressure to deprioritise brand. The plan sets what each channel is accountable for, and what evidence counts.
- Role, target and ceiling defined per channel
- New customer cost against new customer contribution
- Attribution reconciled to order and cohort data
- Creative volume and fatigue quantified
49%
of marketing and finance leaders can measure marketing's effect on outcomes
Whether the second order is designed, or left to chance.
We measure repeat purchase rate by cohort and by entry product, time to second order, subscription or replenishment behaviour where it exists, discount dependence in retention flows, and which entry products create returning customers rather than one-time bargain hunters. Acquisition targets that ignore this are a guess dressed as a model.
The output is an explicit retention design: which products should be the front door, what the second-order offer is, what the flows must do, and which cohorts justify a higher acquisition cost because they come back.
- Repeat purchase rate by cohort and entry product
- Time to second order and replenishment cycle
- Discount dependence inside retention flows
- Contribution-based lifetime value, not revenue LTV
74%
of leaders have scaled back an initiative they could not measure
The offer a first-time buyer meets, and what it does to margin.
We review the catalogue and the path to purchase as a commercial system: which SKUs earn shelf space, how bundles and kits affect contribution, price architecture and shipping thresholds, product page evidence, and the checkout friction that turns paid traffic into abandoned carts. This is a commercial review with recorded findings, not a redesign project.
Where the fix is build work, the plan scopes it and hands it to your team or your agency. If the constraint turns out to be how the marketing function itself is staffed and run, marketing team structure advisory is the more useful engagement.
- SKU rationalisation and bundle contribution
- Price architecture and shipping thresholds tested
- Checkout and payment friction documented
- Build work scoped and handed over, not delivered by us
9.0%
of company revenue spent on marketing on average, per The CMO Survey
Fixed scope with a defined end date, agreed in writing
We buy through your own mobile path instead of reviewing screenshots
Advisory only, so the plan can recommend spending less
Twelve months of order, cost and spend records, not a sample month
We made the difference for those brands

Consumer tech and platforms

Food & beverage

Beauty, personal care & wellness

B2B software, fintech, insurance

Apparel and lifestyle

Creative, content, arts & culture

Healthcare & regulated services

B2B software, fintech, insurance

Creative, content, arts & culture

B2B software, fintech, insurance

Retail & commerce

Apparel and lifestyle

Apparel and lifestyle

Consumer tech and platforms

Home essentials, appliances, kitchen & pet

B2B software, fintech, insurance

B2B software, fintech, insurance

Home essentials, appliances, kitchen & pet

Consumer tech and platforms

Creative, content, arts & culture

Creative, content, arts & culture

Food & beverage

Food & beverage

Creative, content, arts & culture

B2B software, fintech, insurance

Beauty, personal care & wellness

Beauty, personal care & wellness

Food & beverage

Consumer tech and platforms

Consumer tech and platforms
01 — The challenge
Revenue is growing, the dashboards look fine, and the bank balance disagrees.
A familiar picture in a scaling DTC brand: revenue is up year over year, paid social is reported as profitable inside the ad platform, email is credited with a suspiciously similar amount of the same revenue, and cash is tighter than last year. The catalogue has grown by launch rather than by decision. A sitewide discount has been running for so long it is now the price. Nobody can say what a first order earns after shipping, returns and the promotion that created it.
“We are doing record revenue months and we still cannot fund the next inventory order.”
The data underneath the decisions is usually part of the problem. 62% of organizations report losing revenue directly because of poor data quality, 67% have had campaigns delayed or scrapped over it, and only 41% have a dedicated data governance owner. In a brand running several platforms, a subscription app and a marketplace channel, that is exactly where growth plans go to die.
02 — Our approach
Rebuild the economics, decide the growth model, then a plan the founder owns. Four to six weeks.
Fixed scope, one senior advisor in every session, no campaign management inside the engagement. Week one is measurement. We take twelve months of order, product cost, shipping, returns, subscription and ad spend data out of your commerce platform, analytics, email platform and ad accounts, walk the buying path the way a first-time customer does on mobile, and interview the founder, whoever owns paid media, retention and merchandising, and the person who reconciles the numbers. Week two is economics: contribution margin per order and SKU, cost and contribution per new customer by channel, repeat purchase by cohort and entry product, payback period, and a reconciliation between platform-reported performance and what the order data supports. Week three is the decision session, covering price and promotion, which products earn shelf space, what each channel is for and what it is allowed to cost, and where the retention design has to change. The final week produces the written plan: unit economics model, channel roles and targets, the retention design, a merchandising and offer decision, a marketing brief any agency can be held to, and a monthly scorecard with defined metrics. We do not run your ads, we do not rebuild your store and we do not manage your agencies. Everything is handed over in editable files that stay yours.
03 — What we did
How the engagement actually runs.
Economics rebuilt before opinions, channel roles before targets, then one written plan the founder has already argued through.
Week 1 / Measurement
Orders, costs and the buying path measured as a customer meets them
Landed cost, shipping, returns and discount depth against a mobile walk of the real path to purchase.

Week 2 / Economics
Contribution per new customer, by channel and cohort
What each channel really costs to buy a first order, and what that order earns after everything that leaves with it.

Week 3 / Decisions
Retention design and the founder decisions
Which entry products create returning customers, what the second-order offer is, and which promotions stop.

Weeks 4-6 / Plan
The written plan and a scorecard the brand maintains
Unit economics model, channel roles and ceilings, merchandising decisions, a marketing brief and a short monthly scorecard.

WHAT YOU GET
Six deliverables, all editable, all yours.
all yours
Written for your catalogue, your channels and your cohorts, in files your team can change without calling us.

Brand growth plan
Where growth comes from over the next four quarters, in what order, with a named owner for each workstream.

Unit economics model
Contribution margin per order and SKU after product, shipping, returns and discount, with payback by channel.

Channel roles and targets
What each channel is for, what it is allowed to cost per new customer, and the evidence that counts as proof.

Retention and repeat design
Entry products, second-order offer, replenishment cycle and the cohorts that justify a higher acquisition cost.

Marketing brief for your vendors
What to buy, for which products, at what cost per new customer, written so any agency can be held to it.

Monthly operating scorecard
A short set of defined numbers, from contribution margin to repeat rate, your team maintains without help.
HOW WE WORK
Operating standards, not promises.
Operating standards


Scaling DTC brands
Where revenue has outgrown the reporting, and nobody can say what a first order earns after shipping, returns and the promotion that created it.
ExploreMulti-channel ecommerce operators
Where owned store, marketplaces and retail partners compete for the same inventory and the same media budget.
ExploreSubscription and replenishment brands
Where churn, replenishment cycle and discount dependence decide the model long before creative does.
Explore

















Built on trust. Proven by results.
We partner with SMBs and Fortune 500 companies to deliver more than reach — we bring clarity, execution, and measurable outcomes. Every successful partnership starts with a strong culture fit and a shared drive to grow.







CASE STUDIES
Case studies
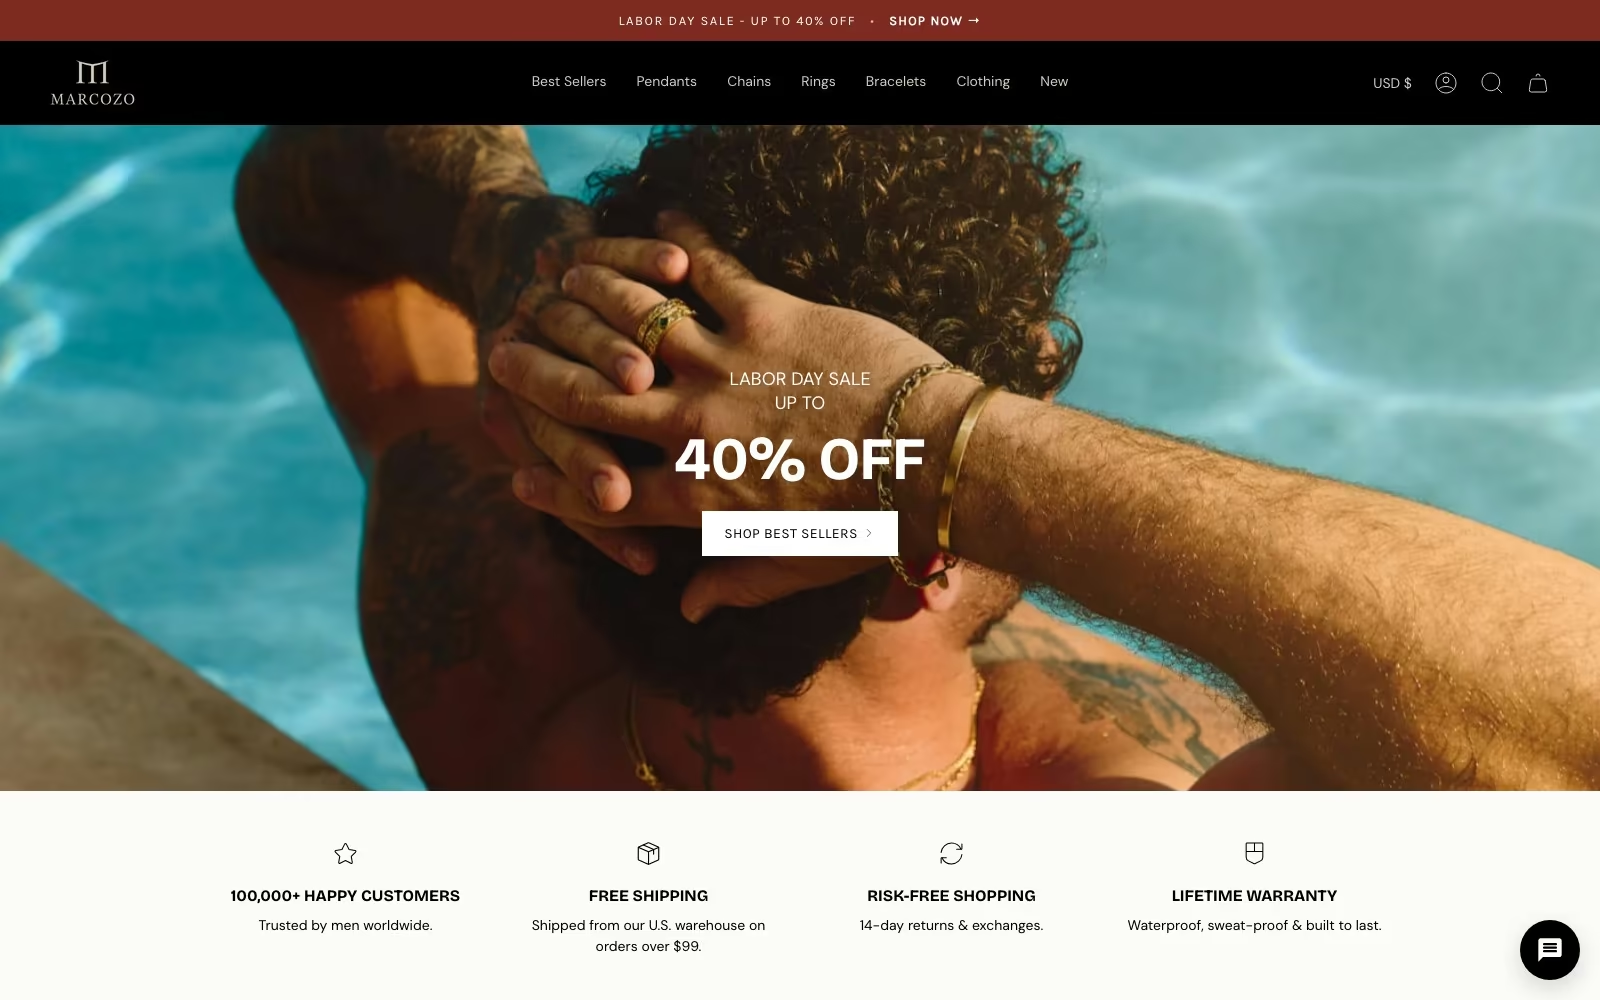
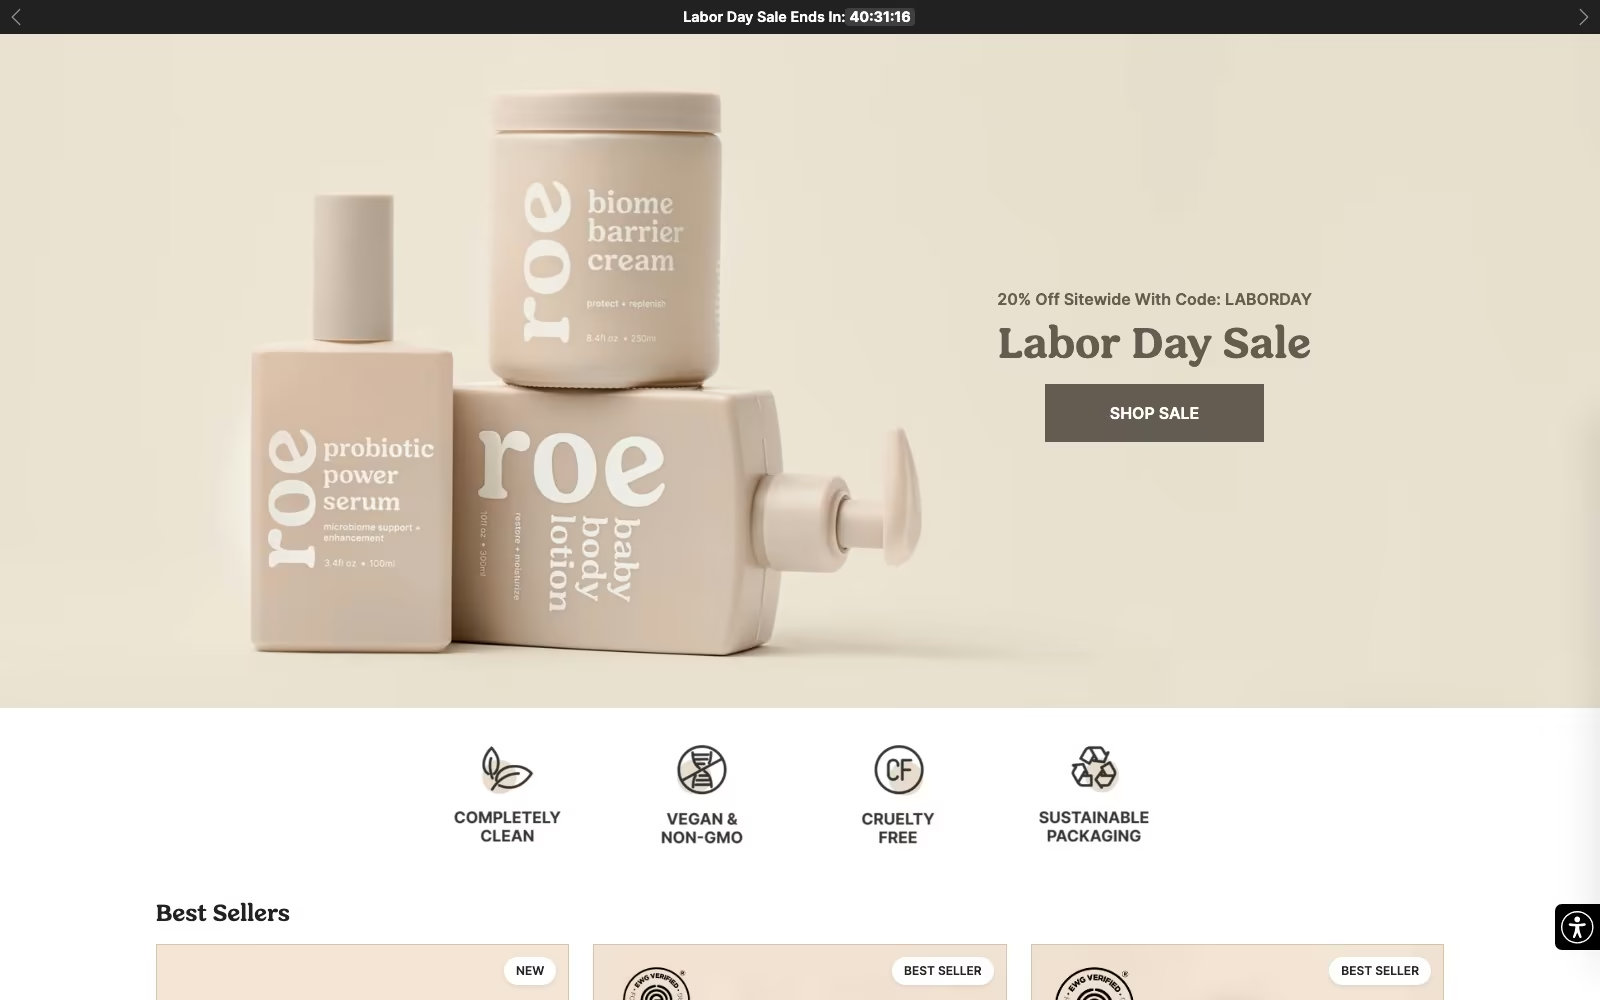
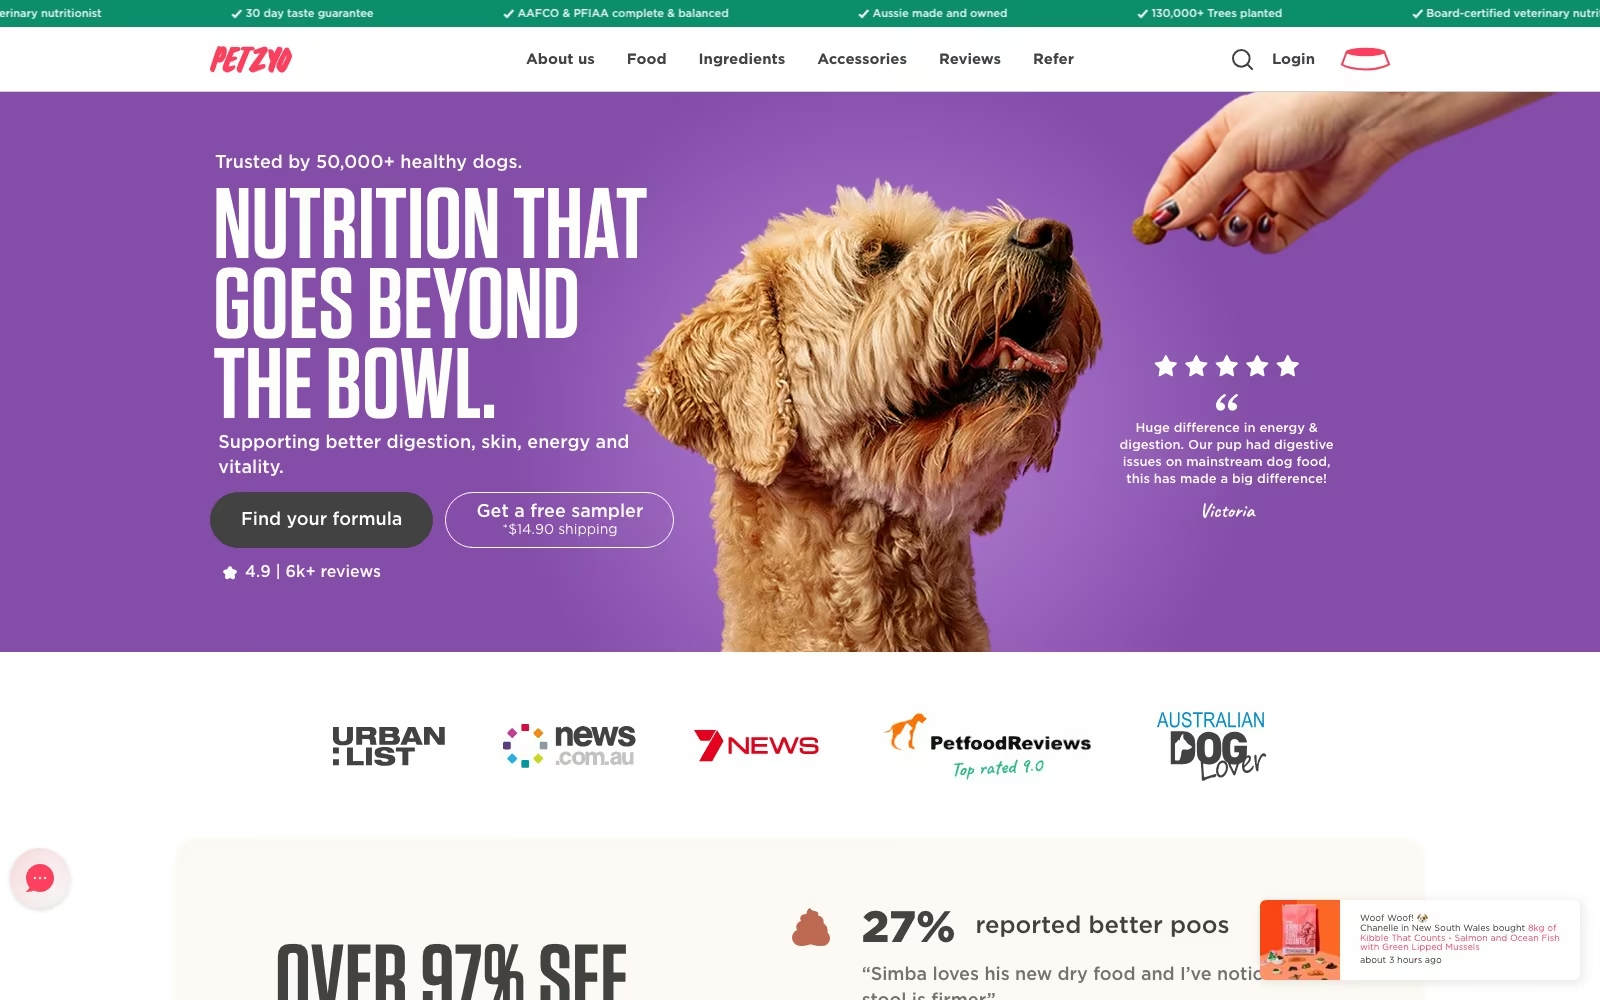
Website Portfolio
Video Ads
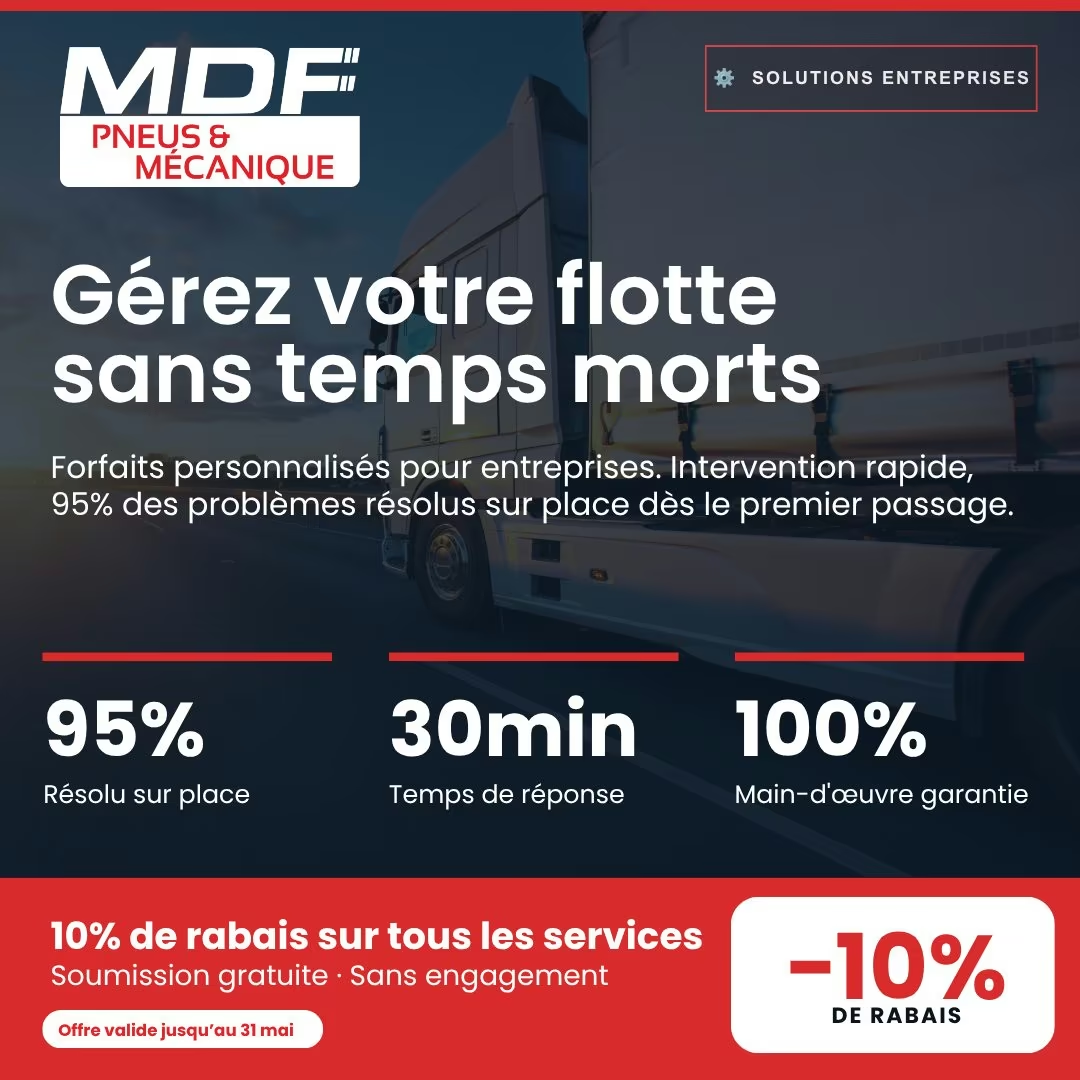
Static Ads



























































EN

EN

EN


FR
FR
FR

FR

FR

FR

FR

FR


EN
FAQ
What ecommerce founders ask before buying growth consulting.
What does ecommerce growth consulting actually cover?
Four areas and a plan. Unit economics, meaning contribution margin per order and SKU after product, shipping, returns and discount; acquisition, meaning what each channel costs and contributes per new customer; retention, meaning repeat purchase by cohort and entry product; and the offer, catalogue and conversion path a first-time buyer actually meets. The output is a written plan with owners, a marketing brief your vendors can be held to, and a monthly scorecard your team maintains.
How is this different from a growth marketing agency?
An agency is paid to run and scale campaigns. This engagement is paid to find out where the brand actually loses money, and in ecommerce that is usually margin, discounting, repeat purchase or checkout rather than reach. Because we take no execution work inside the engagement, the plan can conclude that you should spend less, cut two channels and fix the offer. If you want execution afterwards it is scoped separately, and the brief is written so any agency, including your current one, can deliver against it.
Do you manage Meta, Google or TikTok ads?
Not inside this engagement, and that is deliberate. Reviewing accounts we do not run is what lets the plan say a channel should shrink. We do read the accounts in detail during measurement, and the plan sets each channel's role, its allowed cost per new customer and the evidence that counts. Where you want hands-on media management afterwards, paid social and paid search are separate engagements.
What size brand is this built for?
Brands with enough order history for cohorts to be stable and enough complexity for the mix question to be real: several product lines, more than one acquisition channel, and usually more than one selling surface. A brand in its first year with one SKU gets more from a tighter offer and a working retention flow than from a four-week diagnosis. We will say so at the scoping call rather than sell you the wrong thing.
What does the engagement cost?
A fixed fee quoted after a scoping call, with deliverables and dates written down before you commit. It varies with catalogue size, how many channels and selling surfaces are in scope and the state of the data, so publishing a rate would mislead most readers. For budget context, The CMO Survey puts marketing at an average 9.0% of company revenue, with 33.6% of digital activity run by outside agencies. Book a meeting for a scope and a number.
Our attribution is a mess. Can you still do this?
Yes, and it is one of the reasons to run the project. We work from order and cost data first, then reconcile platform-reported performance against it and state plainly which findings are solid and which are directional. 62% of organizations report losing revenue directly because of poor data quality and only 41% have a dedicated data governance owner, so this is the norm. The plan includes the tracking and process changes that make next quarter's decisions cleaner, or marketing operations consulting if the rebuild is larger.
Will you tell us to stop discounting?
Usually to stop discounting sitewide, and to price the promotions that stay. The common finding is that a promotion introduced to clear stock has become the brand's price, so contribution is set by the discount rather than by the product. The plan quantifies what each promotion costs in margin, which cohorts it recruits, and whether those customers ever pay full price. Then your team decides, with the number in front of them.
How do you handle cart and checkout abandonment?
We document it as a commercial finding rather than a redesign project. The average documented cart abandonment rate is 70.22% across 50 studies, so the useful question is which part of yours is avoidable: shipping thresholds, payment options, forced accounts, price surprises or the traffic you chose to buy. The plan lists the fixes in priority order with the margin at stake, and your team or your agency builds them.
Do you cover marketplaces, retail and wholesale?
Yes, where they are in scope. Owned store, marketplace and wholesale channels have different margins, control and data quality, and the plan treats them as a portfolio: what each is for, what it is allowed to cost, and where they cannibalise each other. Brands that need the retail or wholesale side rebuilt commercially rather than reviewed should expect that to be a separate, longer piece of work.
Can you help us decide what to hire versus outsource?
Yes, at the level of roles and accountability rather than recruiting. The plan names which capabilities have to be in-house for the model to work, which are better bought, and what each owner is accountable for on the scorecard. Where that question is the main one, marketing team structure advisory or a fractional CMO engagement fits better than a growth diagnosis.
How is this different from a marketing audit?
A marketing audit examines what is currently running and what it returns. This engagement is wider: it covers unit economics, catalogue and offer, retention and channel roles, which is where ecommerce growth is usually decided, and it ends in a plan rather than findings. Brands that want positioning and brand strategy rather than commercial mechanics should look at marketing strategy consulting instead.
Are you investors or M&A advisors?
No. We are not a broker, an investment bank or a valuation firm, and nothing here is investment, tax or legal advice. What we do is the commercial work underneath those conversations: showing how the brand really earns contribution by product and channel, how much of the growth is repeatable, and what the plan for the next four quarters is. Founders preparing for a raise or a process often use that alongside their own financial and legal advisors.
Which numbers do you want before the first call?
Twelve months of orders with product, discount and shipping detail; landed product cost; returns and refunds; ad spend by channel; and email or SMS performance. Subscription data if you have it. If cost of goods is incomplete, say so and we will work with ranges and label them. We reconcile against your accounting system rather than taking platform dashboards at face value.
Where does AI fit into the plan?
Where it earns its place, and not as a theme. The CMO Survey reports AI use rising from 13.1% to 24.2% of marketing activities, mostly in creative production, merchandising copy and support. The risk is the other side: 71% of leaders say AI favours short-term performance and 69% feel pressure to deprioritise brand. If AI readiness is the actual question, AI marketing advisory is the better engagement.
Do you work with other kinds of company?
Yes. The parent version is growth advisory, and the same engagement runs in other verticals with the mechanics changed, for example B2B SaaS growth consulting, where pricing model and retention replace catalogue and shipping as the levers.
What happens after the plan?
Your team runs it, and every workstream has a named owner on your side. Many brands book a review at ninety days to re-measure contribution margin, repeat rate and cost per new customer, which takes half a day and is optional. Where you want ongoing marketing leadership rather than a project, a fractional head of growth or scorecard advisory is the next engagement, quoted separately.

.webp)
.webp)


