



Most SaaS growth problems are an ICP and pricing problem wearing a marketing costume.
wearing a marketing costume
When new ARR slows, the first instinct is to buy more pipeline. More often the real issue sits upstream: the ideal customer profile has drifted, the pricing model no longer matches how customers get value, or the sales and customer success motion is carrying accounts it should never have signed. We diagnose the growth system and write a plan your leadership team runs. Advisory only, no campaign execution inside the engagement. Book a meeting and bring four quarters of revenue data.






Tell us a little about your brand and we'll be in touch within 24 hours to lock in a time.



WHAT WE EXAMINE
Four places SaaS growth actually breaks.
actually breaks
Growth is now an output of unit economics rather than an input you can buy. Across 342 B2B SaaS and AI-native companies, median growth fell from 30% in CY-22 to 20% in CY-25, while the 75th percentile collapsed from 75% to 42%. The companies still compounding are not spending more. They have a tighter ICP, a pricing model that expands, and a retention floor that holds.
ICP and segmentation
Pricing and packaging
Pipeline and GTM efficiency
Retention and expansion
Which customers actually work, measured rather than asserted.
We rebuild the customer base by segment: acquisition cost, sales cycle, onboarding effort, support load, expansion rate and retention, cut by company size, industry, use case and acquisition channel. Nearly every SaaS company carries a segment that closes easily, churns quietly and consumes a disproportionate share of customer success time.
That analysis is what makes a go-to-market strategy decidable: which segments to concentrate on, which to serve at lower touch, and which to stop selling to even though the deals close.
- CAC, cycle time and win rate by segment and source
- Retention and expansion measured per segment cohort
- Support and success load loaded into each segment
- The segments to concentrate, deprioritise or decline, named
20%
median CY-25 growth rate across 342 B2B SaaS companies, down from 30%
Whether the model expands with the value customers get.
Pricing architecture now decides retention. Usage-based companies post a 108% median net revenue retention against 95% for seat-based companies, a 13-point gap, and the overall median NRR sits at 102%, close enough to breakeven that a small retention slip turns a growth engine into a treadmill.
So we look at the packaging as a system: how tiers map to the value metric, where discounting really happens, whether expansion needs a sales conversation or happens on its own, and what a migration would cost in churn risk and revenue timing before anyone touches the price page.
- Value metric tested against how customers actually consume
- Tier and packaging structure compared with expansion behaviour
- Discounting and floor pricing measured by segment and rep
- Migration risk modelled before any pricing change is recommended
108%
median NRR for usage-based pricing, against 95% for seat-based
Where the funnel loses money, stage by stage.
We decompose the pipeline from source to closed revenue: volume, conversion and cycle time by stage and source, pipeline coverage against target, sales capacity and ramp, and the real blended cost of acquiring a new logo compared with expanding an existing account.
Efficiency has improved industry-wide, but unevenly. Median CAC payback improved from 18 to 16 months, the largest single-year gain in four years, with a blended CAC ratio of $1.30. If your payback is materially worse than that, the plan says which part of the motion is responsible rather than asking for more budget.
- Stage conversion and cycle time by source and segment
- CAC payback and magic number rebuilt from your own data
- New logo cost compared with expansion cost
- Sales capacity, ramp and coverage checked against the target
16 mo
median CAC payback in CY-25, improved from 18 months
The floor everything else stands on.
Retention is deteriorating market-wide. Median gross revenue retention fell from 88% to 84%, the largest single-year drop recorded, and even the 75th percentile slipped from 95% to 91%. Companies at the bottom of that distribution must replace a meaningful share of ARR every year before they grow at all.
We look at churn and downgrade reasons in the customers' own words, time to first value, product usage against renewal outcomes, and whether customer success is structured to protect revenue or to answer tickets. Where the constraint is how the team is organised, marketing team structure advisory is the more useful engagement.
- Gross and net retention by cohort, segment and pricing model
- Churn and downgrade reasons coded from real accounts
- Time to first value and onboarding drop-off measured
- Expansion motion reviewed: automatic, assisted or absent
84%
median gross revenue retention in CY-25, down from 88%
Fixed scope with a defined end date, agreed in writing
CRM and product data checked against the finance file, not a dashboard
Advisory only, so the plan can recommend spending less
Real customer conversations, not only internal interviews
We made the difference for those brands

Beauty, personal care & wellness

B2B software, fintech, insurance

Creative, content, arts & culture

Beauty, personal care & wellness

Healthcare & regulated services

B2B software, fintech, insurance

Beauty, personal care & wellness

Consumer tech and platforms

Home essentials, appliances, kitchen & pet

Retail & commerce

Consumer tech and platforms

Healthcare & regulated services

Healthcare & regulated services

Travel & mobility

Home essentials, appliances, kitchen & pet

B2B software, fintech, insurance

Retail & commerce

Travel & mobility

B2B software, fintech, insurance

Beauty, personal care & wellness

Travel & mobility

Food & beverage

Travel & mobility

Consumer tech and platforms

Healthcare & regulated services

B2B software, fintech, insurance

Beauty, personal care & wellness

Creative, content, arts & culture

B2B software, fintech, insurance

B2B software, fintech, insurance
01 — The challenge
The board asked for a growth plan. The team produced a channel plan.
A familiar situation in a company between roughly five and fifty million in ARR: net new ARR has been flat for three quarters, the sales team says leads are weak, marketing says the deals stall in the pipeline, and customer success is quietly absorbing accounts that were never a fit. Reporting compounds it. The CRM has a source field half the reps leave blank, so every segment analysis has to be caveated, and the board deck ends up comparing dashboards that disagree with the finance file.
“We can tell you how many leads we generated. We cannot tell you which customers we should want.”
The measurement gap is industry-wide. Only 49% of senior marketing and finance leaders say they can measure how marketing drives business outcomes, 74% have abandoned or scaled back an initiative they could not measure, and 71% say their AI tools push them toward short-term performance. In a subscription business, where this quarter's decision shows up in next year's retention, that bias is expensive.
02 — Our approach
Rebuild the segments, model the economics, then a plan the leadership team owns. Four to six weeks.
Fixed scope, one senior advisor in every session, no execution work inside the engagement. Week one is measurement. We take four to eight quarters of CRM, billing and product usage data, reconcile it against the finance file rather than trusting a dashboard, and interview the founder or chief executive, the revenue leader, product, customer success and two or three real customers where you can introduce us. Customer conversations matter here: teams describe the value proposition they intended, and customers describe the one they actually bought. Week two is economics: acquisition cost, cycle time, win rate, gross and net retention, expansion, support load and lifetime value by segment and by pricing model, plus a rebuilt view of CAC payback and pipeline coverage. Week three is the decision session with the leadership team, covering which segments to concentrate on, what the pricing and packaging decision is, where the go-to-market motion changes and what has to be hired or stopped. The final week produces the written plan: the ICP definition with evidence, the pricing and packaging recommendation with migration risk, the go-to-market plan by segment, a marketing brief any agency or in-house team can be held to, and a monthly scorecard with defined metrics. We do not run campaigns here and we do not act as a fractional operator inside the engagement. Everything is handed over in editable files that stay yours.
03 — What we did
How the engagement actually runs.
Segments rebuilt before opinions, economics before targets, then one written plan the leadership team has already argued through.
Week 1 / Measurement
The customer base rebuilt into segments that behave differently
Acquisition cost, cycle time, retention, expansion and support load, cut by segment and source rather than averaged.

Week 2 / Economics
Pricing and packaging against real consumption
How the value metric, tiers and discounting line up with the way accounts actually expand or stall.

Week 3 / Decisions
Pipeline economics and the leadership decisions
Stage conversion, CAC payback and capacity, then the segment and motion decisions made in one working session.

Weeks 4-6 / Plan
The written plan and a scorecard the company maintains
ICP, pricing recommendation, go-to-market plan by segment, a marketing brief and a short monthly scorecard.

WHAT YOU GET
Six deliverables, all editable, all yours.
all yours
Written for your product, your segments and your stage, in files your team can change without calling us.

Growth plan by segment
Where ARR comes from over the next four quarters, in what order, with a named owner for each workstream.

ICP definition with evidence
The segments that retain and expand, the ones that do not, and the data behind each call rather than a persona document.

Unit economics model
CAC, payback, retention, expansion and lifetime value by segment and pricing model, rebuilt from your own data.

Pricing and packaging recommendation
Value metric, tier structure, discount discipline and the migration risk attached to each option.

Go-to-market and marketing brief
What to buy and build, for which segment, at what payback, written so any team or agency can be held to it.

Monthly revenue scorecard
A short set of defined metrics, from pipeline coverage to net retention, your team maintains without help.
HOW WE WORK
Operating standards, not promises.
Operating standards


Early stage companies searching for repeatability
Where a few good customers exist but nobody can yet say which characteristics predict a customer who stays and expands.
Scaling companies with flat net new ARR
Where the motion worked at one scale and stopped working at the next, and more pipeline is being bought to hide it.
Product-led companies adding a sales motion
Where self-serve and sales-assisted revenue compete for the same accounts and the packaging has not caught up with either.


















Built on trust. Proven by results.
We partner with SMBs and Fortune 500 companies to deliver more than reach — we bring clarity, execution, and measurable outcomes. Every successful partnership starts with a strong culture fit and a shared drive to grow.







CASE STUDIES
Case studies
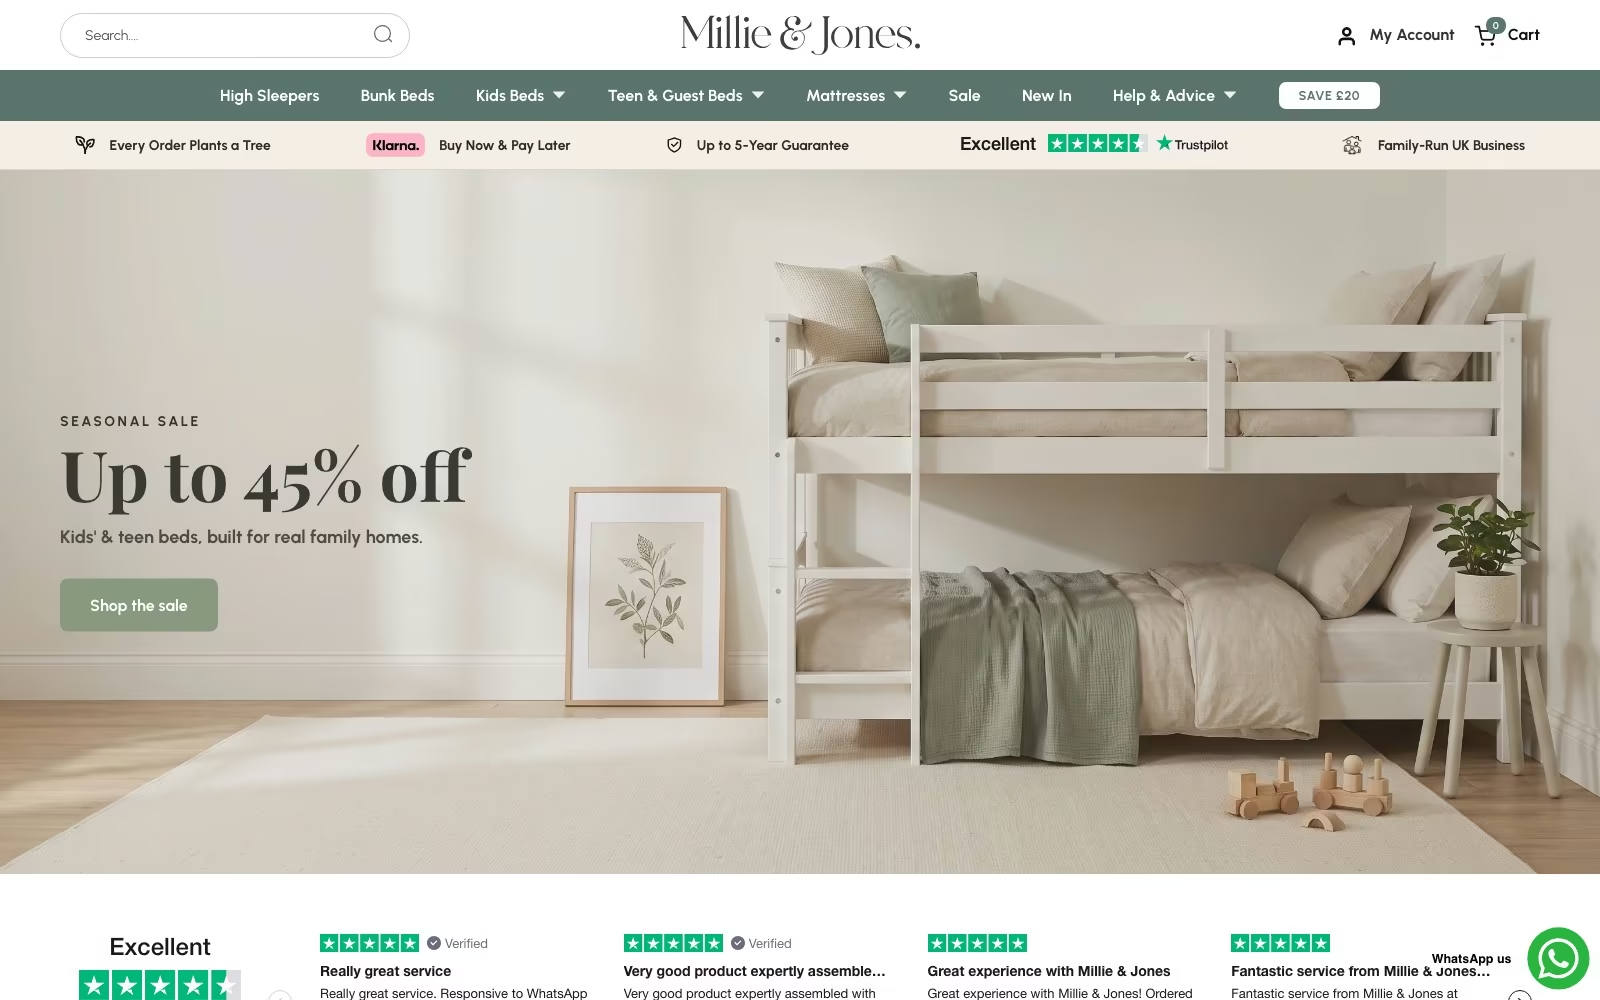
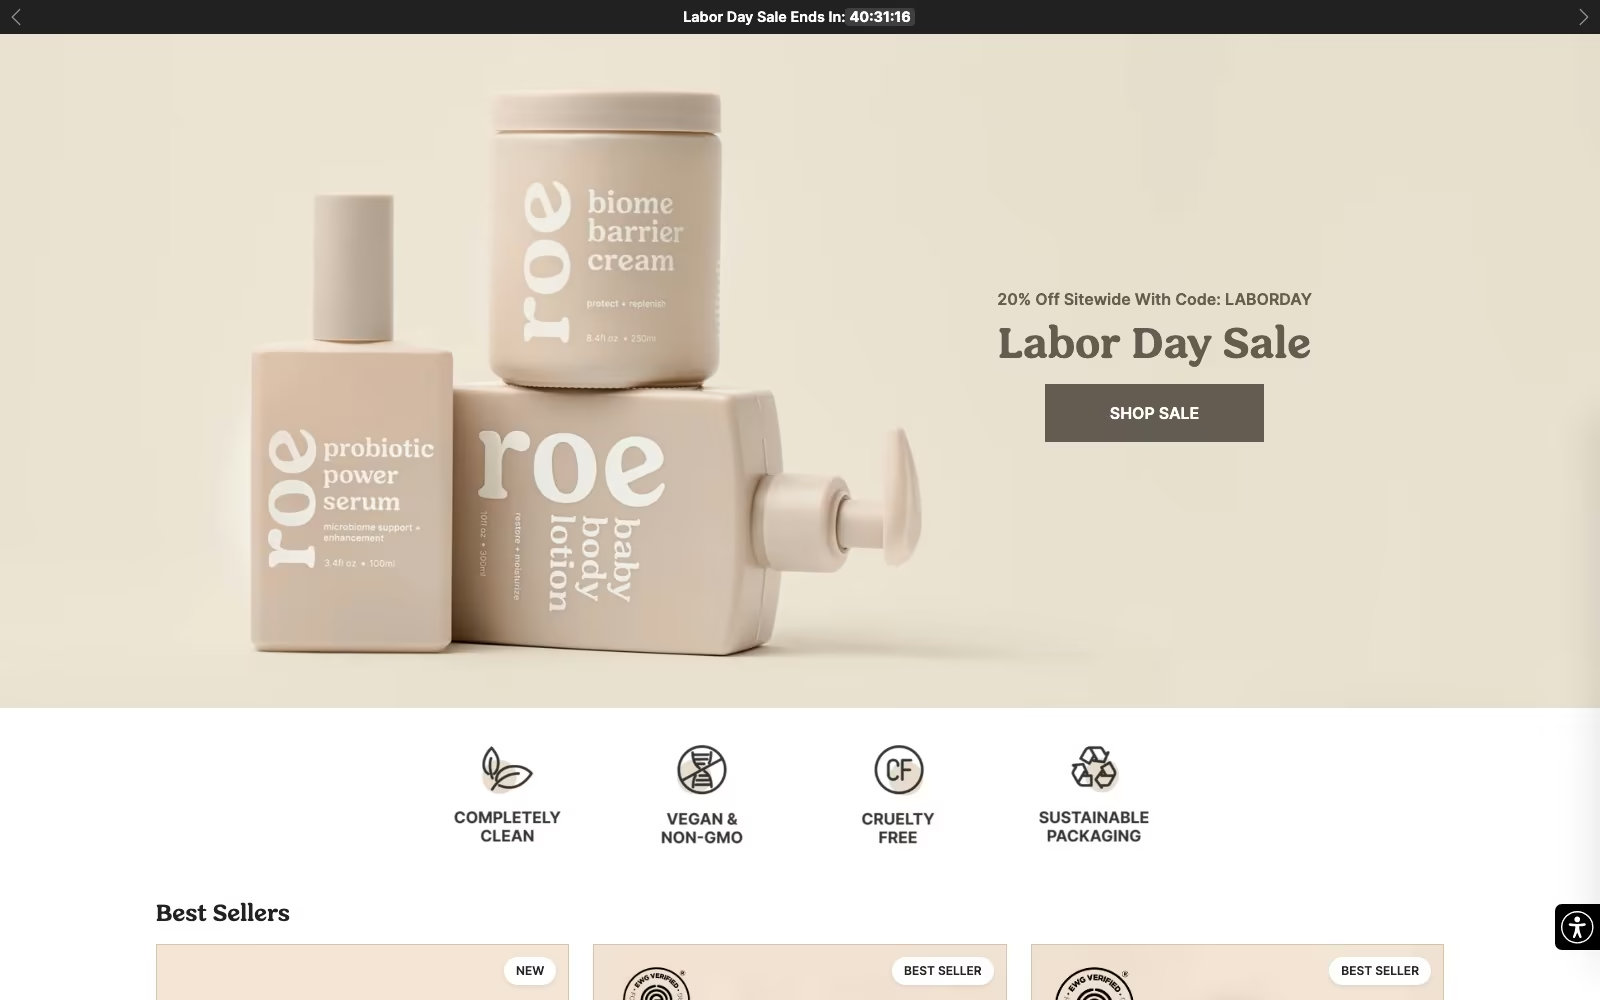
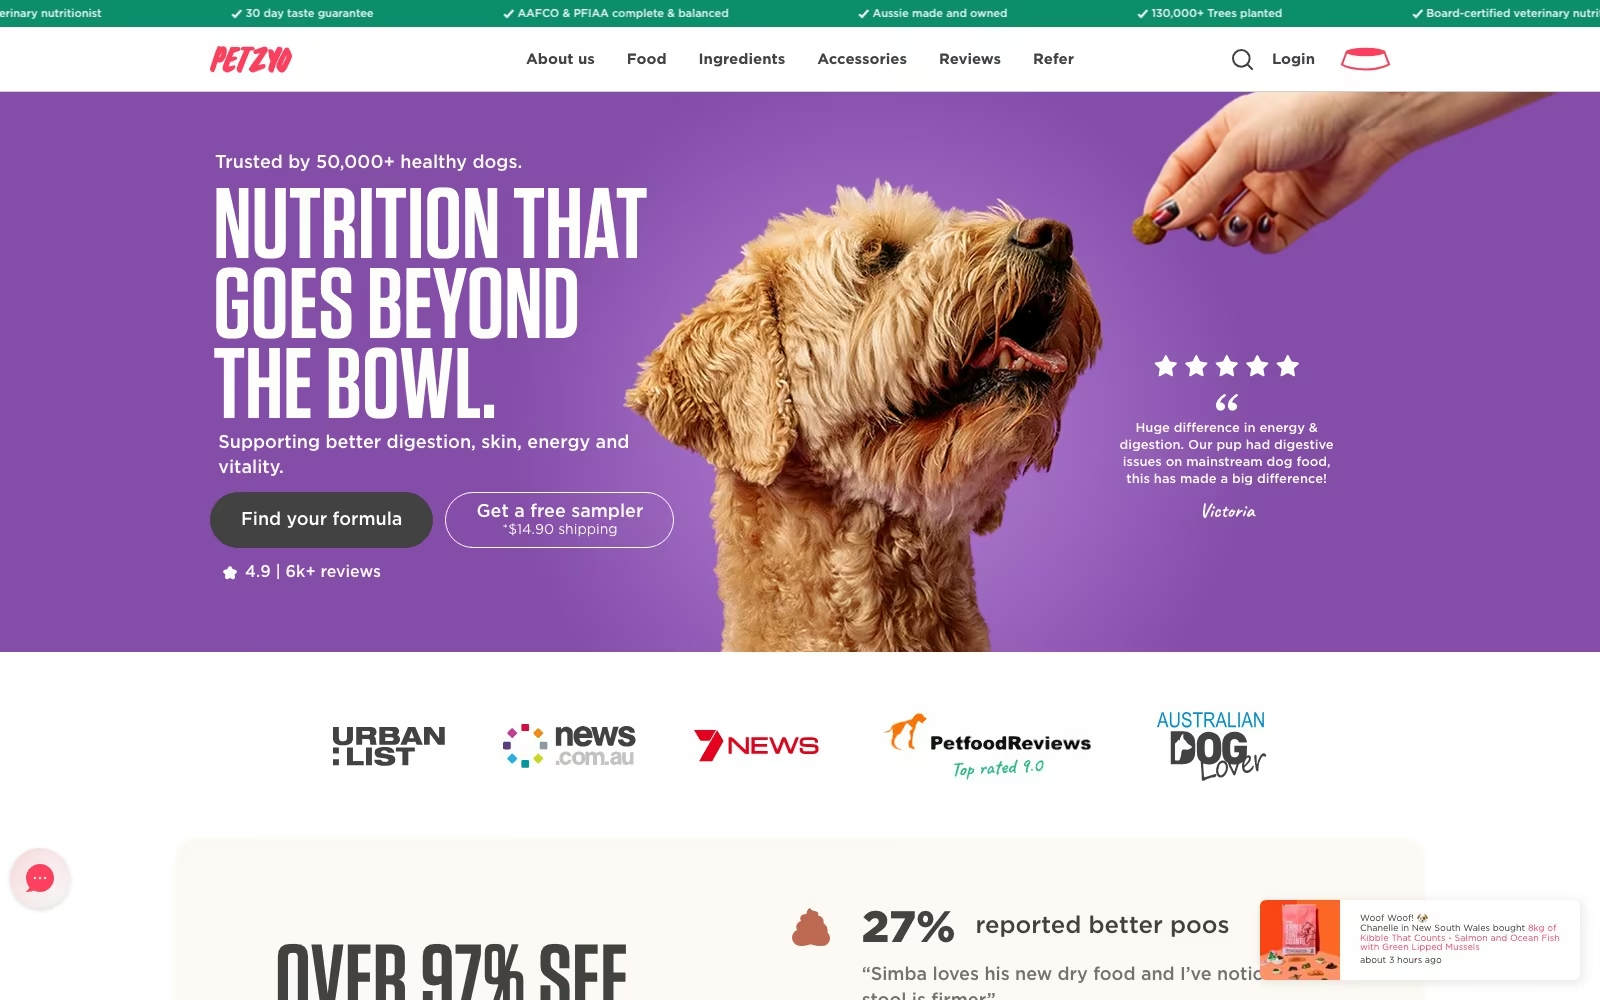
Website Portfolio
Video Ads
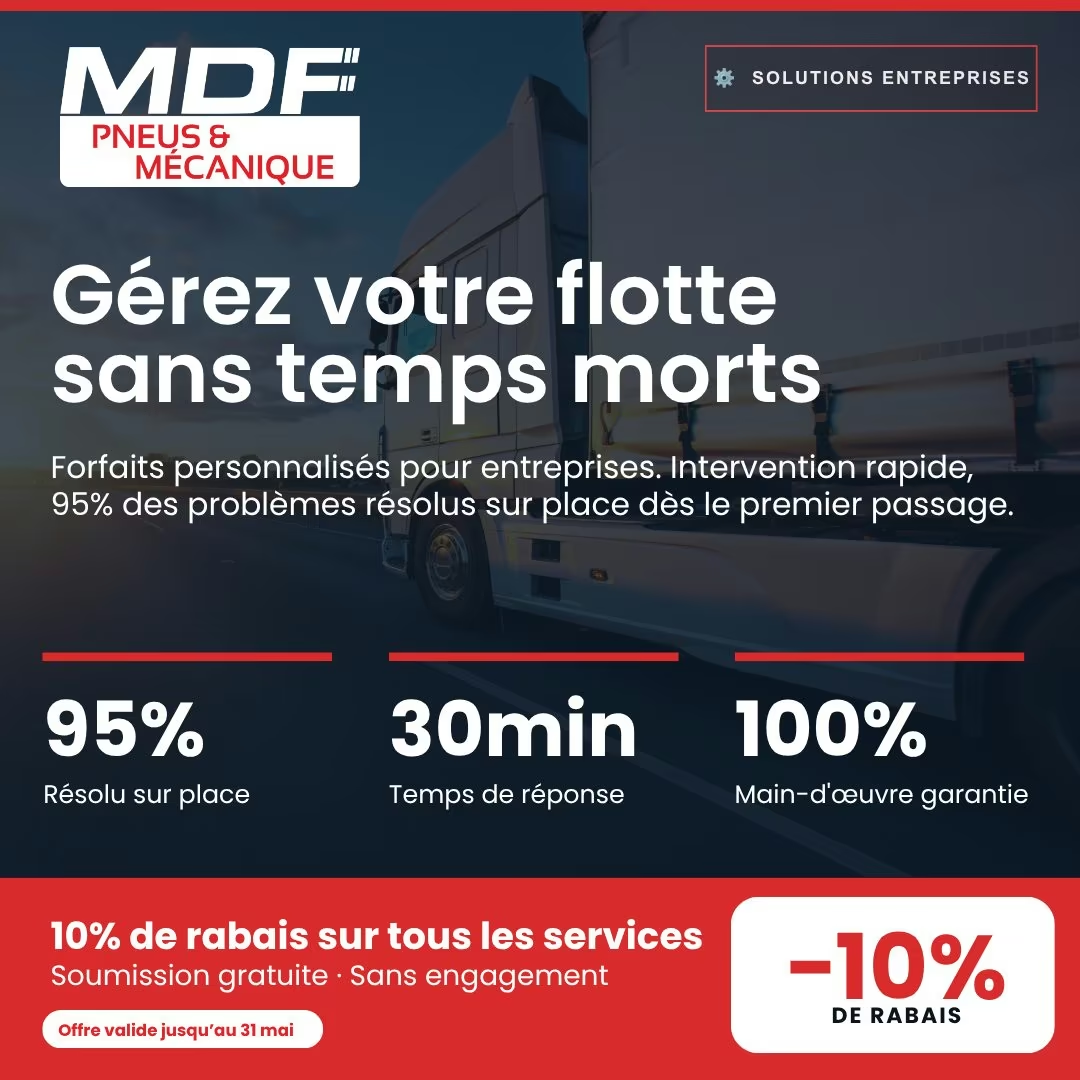
Static Ads



























































EN

EN

EN


FR
FR

FR

FR

FR

FR

FR

FR


EN
FAQ
What SaaS leadership teams ask before buying growth consulting.
What does SaaS growth consulting actually cover?
Four areas and a plan. The ideal customer profile, rebuilt from retention and expansion data rather than from a persona workshop; pricing and packaging, including whether the value metric matches consumption; pipeline and go-to-market efficiency, meaning conversion, cycle time and CAC payback by segment; and retention, meaning why accounts leave and what onboarding does to that. The output is a written plan with owners, a go-to-market brief and a monthly scorecard.
How is this different from hiring a fractional growth leader?
Scope and duration. This is a four to six week project that ends in a plan and hands over. A fractional head of growth is ongoing leadership of the revenue system, and a fractional CMO leads the marketing function. Many companies buy the diagnosis first because it defines what the ongoing role should actually be accountable for, which makes the hire cheaper and faster to judge.
We think our problem is lead volume. Are you going to disagree?
Sometimes, and only after looking. Where pipeline really is the constraint, the plan says so and sizes the investment. The more common finding is that conversion, segment mix or retention explains more of the shortfall than volume does, because a leaky funnel and a weak retention floor make every incremental lead worth less. We would rather tell you that in week two than sell you a demand generation programme that cannot pay back.
What does the engagement cost?
A fixed fee quoted after a scoping call, with deliverables and dates written down before you commit. It varies with ARR scale, how many segments and products are in scope and the state of the data, so publishing a rate would mislead most readers. For budget context, The CMO Survey puts marketing at an average 9.0% of company revenue, with 33.6% of digital activity run by outside agencies. Book a meeting for a scope and a number.
Our CRM data is unreliable. Is that a blocker?
No, and cleaning it is usually part of the value. We work with what exists, reconcile against billing and the finance file, and state plainly which findings are solid and which are directional. 62% of organizations report losing revenue directly because of poor data quality, and only 41% have a dedicated data governance owner. The plan includes the small set of field and process changes that make next quarter's analysis reliable, or marketing operations consulting if the rebuild is larger.
Will you recommend a pricing change?
Only where the evidence supports it, and always with the migration risk attached. Pricing architecture is now a structural determinant of retention: usage-based companies post 108% median net revenue retention against 95% for seat-based ones. That does not mean every company should move to usage pricing. It means the value metric has to match how customers experience value, and the plan sets out what a change would cost in churn risk, revenue timing and sales retraining before you decide.
How do you define our ICP without a large research budget?
Mostly from data you already own. Closed-won and closed-lost records, billing history, product usage, support volume and renewal outcomes are enough to show which customer characteristics predict retention and expansion. We add a small number of customer conversations to explain the pattern, because numbers show what happened and customers explain why. The result is a definition with evidence behind each criterion, not a persona document with a stock photograph.
Do you work with early stage companies before product market fit?
Selectively, and the engagement changes shape. Before repeatability exists there is not enough cohort data to model retention properly, so the work becomes narrower: which of the current customers resemble each other, what hypothesis to test next, and what evidence would settle it. If a company has only a handful of customers, we will say honestly that a four-week diagnosis is premature and what to do instead.
How does this fit with our board and investors?
The plan is written so it can be read by a board without translation: segment economics, the growth model and the assumptions behind it, stated plainly with their sources. Companies preparing for a raise or a diligence process often want the sharper version of this work, which is investor growth advisory. We are not investment advisors and we give no securities advice in either engagement.
Do you touch product roadmap decisions?
We inform them and your product leadership decides. The analysis surfaces where onboarding loses accounts, which use cases predict expansion and where packaging promises something the product does not deliver, all of which is relevant to the roadmap. What we do not do is write your roadmap, run discovery for features or sit in the product organisation. That boundary keeps the growth plan honest.
Who from the company needs to be involved?
The founder or chief executive, the revenue leader, whoever owns marketing, a customer success lead and the person who owns the finance file. Expect a kickoff, a data pull, several short interviews, two or three customer conversations, one decision session and a final review. We take read-only access through your own accounts and never move data out of systems you control.
How long before we see results?
Targeting and funnel changes show within a quarter because conversion and cycle time respond quickly. Pricing and packaging effects take two to four quarters because they arrive through renewals and expansion, and retention improvements are slower still. That is why the scorecard tracks leading indicators such as pipeline coverage, win rate by segment, time to first value and net retention, rather than a single ARR number that reports the outcome long after the decision.
How is this different from a marketing audit?
A marketing audit examines what is currently running and what it returns. This engagement is wider: segments, pricing, the sales motion and retention, which is where software growth is usually decided, and it ends in a plan rather than findings. Companies that want positioning and category work rather than commercial mechanics should look at marketing strategy consulting instead.
What happens after the plan?
Your team runs it, and every workstream has a named owner on your side. Many companies book a review at ninety days to re-measure conversion and retention, which takes half a day and is optional. Where you want the weekly numbers habit installed rather than another project, scorecard advisory is the usual follow-on, and the parent engagement is growth advisory.

.webp)
.webp)


