



A dental group rarely grows by adding patients. It grows by finishing the treatment it already diagnosed.
finishing the treatment it already diagnosed
In a group practice or a DSO the constraint is almost never awareness. It is treatment presented and never accepted, hygiene columns that do not reappoint, a procedure mix that fills chairs without funding the business, and one location whose numbers are carrying the others. We diagnose the commercial mechanics of the group and write a growth plan your leadership owns and runs. Advisory only, no campaigns inside the engagement. Book a meeting and bring twelve months of production, treatment plan and scheduling data.






Tell us a little about your brand and we'll be in touch within 24 hours to lock in a time.



WHAT WE EXAMINE
Four places dental growth actually leaks.
actually leaks
New patient volume matters, and it is not usually the first thing to fix. In the 2026 Catalyst Index benchmarking data, the average practice accepts 42% of presented treatment while the top 10% accept 75%, and average patient retention is 70% against 94%. Closing part of those two gaps is worth more than any increase in enquiry volume, and it costs media spend rather than adding it.
Treatment presentation and acceptance
Hygiene, recall and retention
Procedure mix and new patient economics
Location, provider and capacity comparison
What was diagnosed, what was accepted, and what was actually completed.
We rebuild the treatment funnel from the practice-management data: diagnosed value by provider and location, acceptance by procedure and case size, the gap between acceptance and completion, how financing and payment options are offered, and how unscheduled treatment is followed up. In most groups the presentation script differs by coordinator and nobody has measured which version works.
The platform data is specific about where the loss sits. The industry average case acceptance rate was 58% in 2025 while case completion reached only 47%, up from 42% the year before. Accepted treatment that never gets completed is revenue the group has already paid to create.
- Diagnosed, accepted and completed value by provider
- Acceptance by procedure type and case size
- Unscheduled treatment follow-up measured, not assumed
- Financing and payment options tested against acceptance
42%
average case acceptance rate, against 75% for the top 10% of practices
The column that quietly decides next year's production.
Hygiene is the engine of a stable practice, so we measure it like one: reappointment rate at the chair, active patient count and attrition, recall effectiveness by channel, periodontal diagnosis consistency, and how much of the restorative schedule originates in the hygiene column.
The average hygiene reappointment rate was 63%, up from 60%, while cancellations ran at 12.9% and no-shows at 6.9%. Those three numbers set the ceiling on production before a single new patient is bought, and they respond to process rather than advertising.
- Reappointment rate measured at the chair, by hygienist
- Active patient count, attrition and reactivation
- Cancellation and no-show behaviour by location and hour
- Restorative treatment originating from hygiene
63%
average hygiene reappointment rate across the platform data
Which patients and which procedures fund the group.
Hygiene recalls, restorative work, implants, clear aligners and specialty referrals each carry a different production value, chair time, insurance exposure and follow-on value. We rebuild contribution by procedure category, payer mix and referral source, then set the cost the group can afford to pay for a new patient in each category rather than one blended number.
Volume does compound where the base is healthy. Practices seeing 75 or more new patients a month grow at nearly double the rate of practices seeing fewer than 35, while the average practice sees 46 a month and nearly 40% see fewer than 20. That is the argument for spending, once acceptance and hygiene are not leaking.
- Contribution by procedure category and payer mix
- Affordable acquisition cost per patient type
- Chair time and specialty referral value quantified
- The categories to grow, hold or refer out, named
46
average new patients per month per practice, up from 43
Which practice model deserves to be the group standard.
In a group or a platform the averages hide everything. We cut the same measures by location and provider: production per day, acceptance, hygiene reappointment, schedule utilisation, collections and contribution after local overhead. That usually finds one practice running a model worth standardising and one with a fixable scheduling, coordination or staffing problem.
Average daily production per practice was $8,764, up from $8,436, and $9,419 for orthodontic practices, which makes the spread between your best and worst site easy to price. Where the constraint is chairs, hygienists or associate capacity, the plan sequences hiring before spend. If the real problem is how marketing is organised across sites, marketing team structure advisory is the more useful engagement.
- Production, acceptance and reappointment cut by location
- Schedule utilisation and open chair time compared
- Contribution after local overhead, per practice
- Associate, hygienist and chair capacity sequenced
$8,764
average daily production per practice in the 2026 platform data
Fixed scope with a defined end date, agreed in writing
We measure your real response experience, we do not ask for it
Advisory only, so the plan can recommend spending less
Twelve months of production and treatment plan records
We made the difference for those brands

Food & beverage

Beauty, personal care & wellness

Consumer tech and platforms

B2B software, fintech, insurance

B2B software, fintech, insurance

B2B software, fintech, insurance

Creative, content, arts & culture

Beauty, personal care & wellness

B2B software, fintech, insurance

Healthcare & regulated services

Travel & mobility

B2B software, fintech, insurance

B2B software, fintech, insurance

Apparel and lifestyle

Consumer tech and platforms

Creative, content, arts & culture

Healthcare & regulated services

Creative, content, arts & culture

Beauty, personal care & wellness

Retail & commerce

Apparel and lifestyle

Beauty, personal care & wellness

Consumer tech and platforms

Food & beverage

Beauty, personal care & wellness

Healthcare & regulated services

Home essentials, appliances, kitchen & pet

Beauty, personal care & wellness

Food & beverage

Travel & mobility
01 — The challenge
Production is up, the schedule looks full, and nobody can say which practice is funding the group.
A familiar picture in a group of six to sixty practices: production has grown three years running, two acquisitions were added, marketing spend rose with them, and the leadership team cannot say which location or which procedure category pays for the rest. Marketing reports new patients. The front desk reports a full schedule. Providers report diagnosed treatment. Finance reports collections that moved for reasons nobody can decompose. The referral source field is half empty, and unscheduled treatment has been sitting in the software for a year.
“We are seeing more patients than ever and collections per practice keep sliding.”
The measurement gap is not specific to dentistry. Only 49% of senior marketing and finance leaders say they can measure how marketing drives business outcomes, and 74% have abandoned or scaled back an initiative because they could not measure it. In a group with several brands, one shared call centre and a mix of insurance and fee-for-service work, that gap decides which acquisition looks good on paper and which one actually works.
02 — Our approach
Measure the funnel, model the mix, then a plan the owners own. Four to six weeks.
Fixed scope, one senior advisor in every session, no campaign work inside the engagement. Week one is measurement. We take twelve months of production, treatment plan, scheduling and collections data out of your practice-management system, test your own enquiry and booking experience through the channels a patient would use, and interview the owner or operations lead, a clinical director, a practice manager, a treatment coordinator and whoever handles marketing. The booking test alone often reframes the project, because groups rarely know what happens to a call at six in the evening in their fourth practice. Week two is economics: contribution by procedure category, payer and referral source, acceptance and completion by provider, hygiene reappointment, schedule utilisation, and the cost the group can afford per new patient. Week three is the decision session with leadership, covering the presentation and financing standard, which categories to grow or refer out, what recall should look like, and what has to be hired. The final week produces the written plan: acceptance and presentation standards, the hygiene and recall design, the procedure mix decision, the capacity sequence, a marketing brief any agency can be held to, and a monthly scorecard with defined metrics. We do not run campaigns here, we do not touch clinical protocols and we give no legal, coding or compliance advice. Everything is handed over in editable files that stay yours.
03 — What we did
How the engagement actually runs.
The funnel measured before opinions, economics before targets, then one written plan leadership has already argued through.
Week 1 / Measurement
Presentation and booking tested the way a patient experiences them
Response time by hour and channel, how treatment is presented and financed, and what happens to unscheduled treatment.

Week 2 / Economics
Hygiene, recall and contribution by procedure
What each category earns after chair time and payer mix, and what the group can afford to pay for a new patient in each.

Week 3 / Decisions
Location comparison and the leadership decisions
Which practice model to standardise on, which to repair, and which work the group should refer out rather than chase.

Weeks 4-6 / Plan
The written plan and a scorecard the group maintains
Acceptance standards, recall design, mix decision, hiring sequence, a marketing brief and a short monthly scorecard.

WHAT YOU GET
Six deliverables, all editable, all yours.
all yours
Written for your procedure mix, your providers and your locations, in files your team can change without calling us.

Group growth plan
Where growth comes from over the next four quarters, in what order, with a named owner for each workstream.

Case acceptance analysis
Diagnosed, accepted and completed value by provider and location, with the presentation and financing standard to close the gap.

Hygiene and recall design
Reappointment standards, active patient attrition, reactivation priorities and the restorative flow from hygiene.

Procedure mix economics
Contribution, chair time and affordable acquisition cost by procedure category, payer and referral source.

Marketing brief for your vendors
What to buy, for which practices and procedures, at what cost per patient, written so any agency can be held to it.

Monthly operating scorecard
A short set of defined numbers, from reappointment rate to contribution by practice, your team maintains without help.
HOW WE WORK
Operating standards, not promises.
Operating standards


Multi-location dental groups
Where several practices share a brand and a call centre, and the group average hides which location is funding the business.
DSOs and private equity backed platforms
Where the question is which acquired practice model to standardise on, and what the integration plan should fix first.
Specialty and orthodontic divisions
Where implants, aligners and specialty work compete with general dentistry for the same chairs, and the mix decision has never been made explicitly.


















Built on trust. Proven by results.
We partner with SMBs and Fortune 500 companies to deliver more than reach — we bring clarity, execution, and measurable outcomes. Every successful partnership starts with a strong culture fit and a shared drive to grow.







CASE STUDIES
Case studies
Website Portfolio
Video Ads
Static Ads


























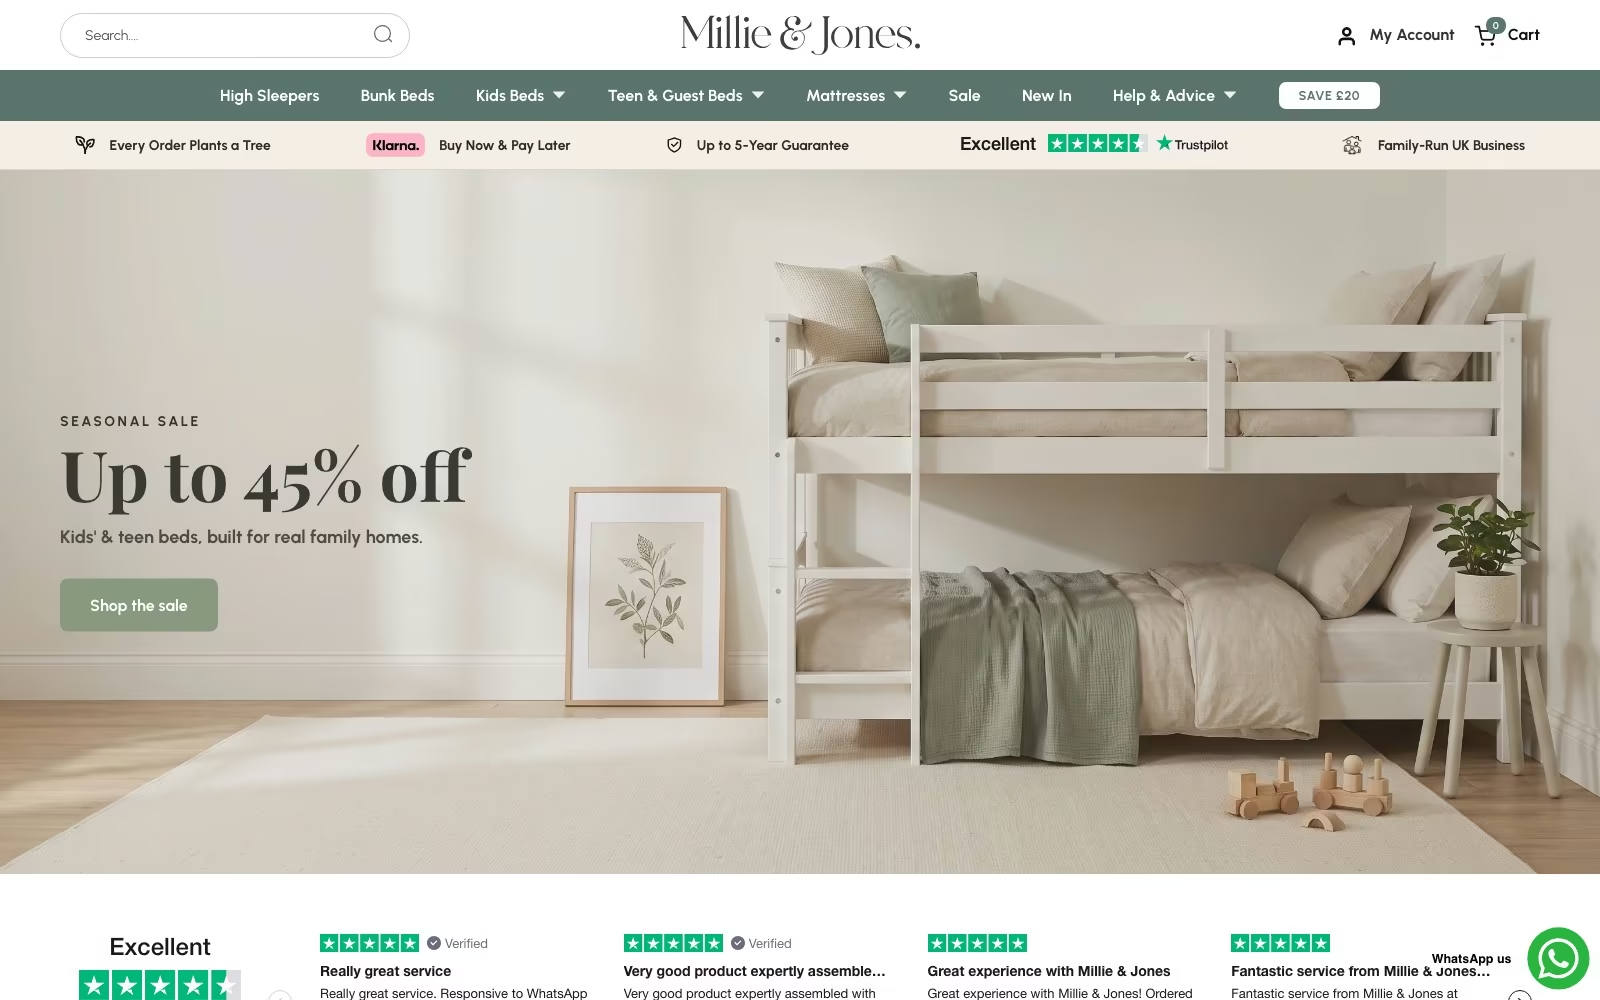

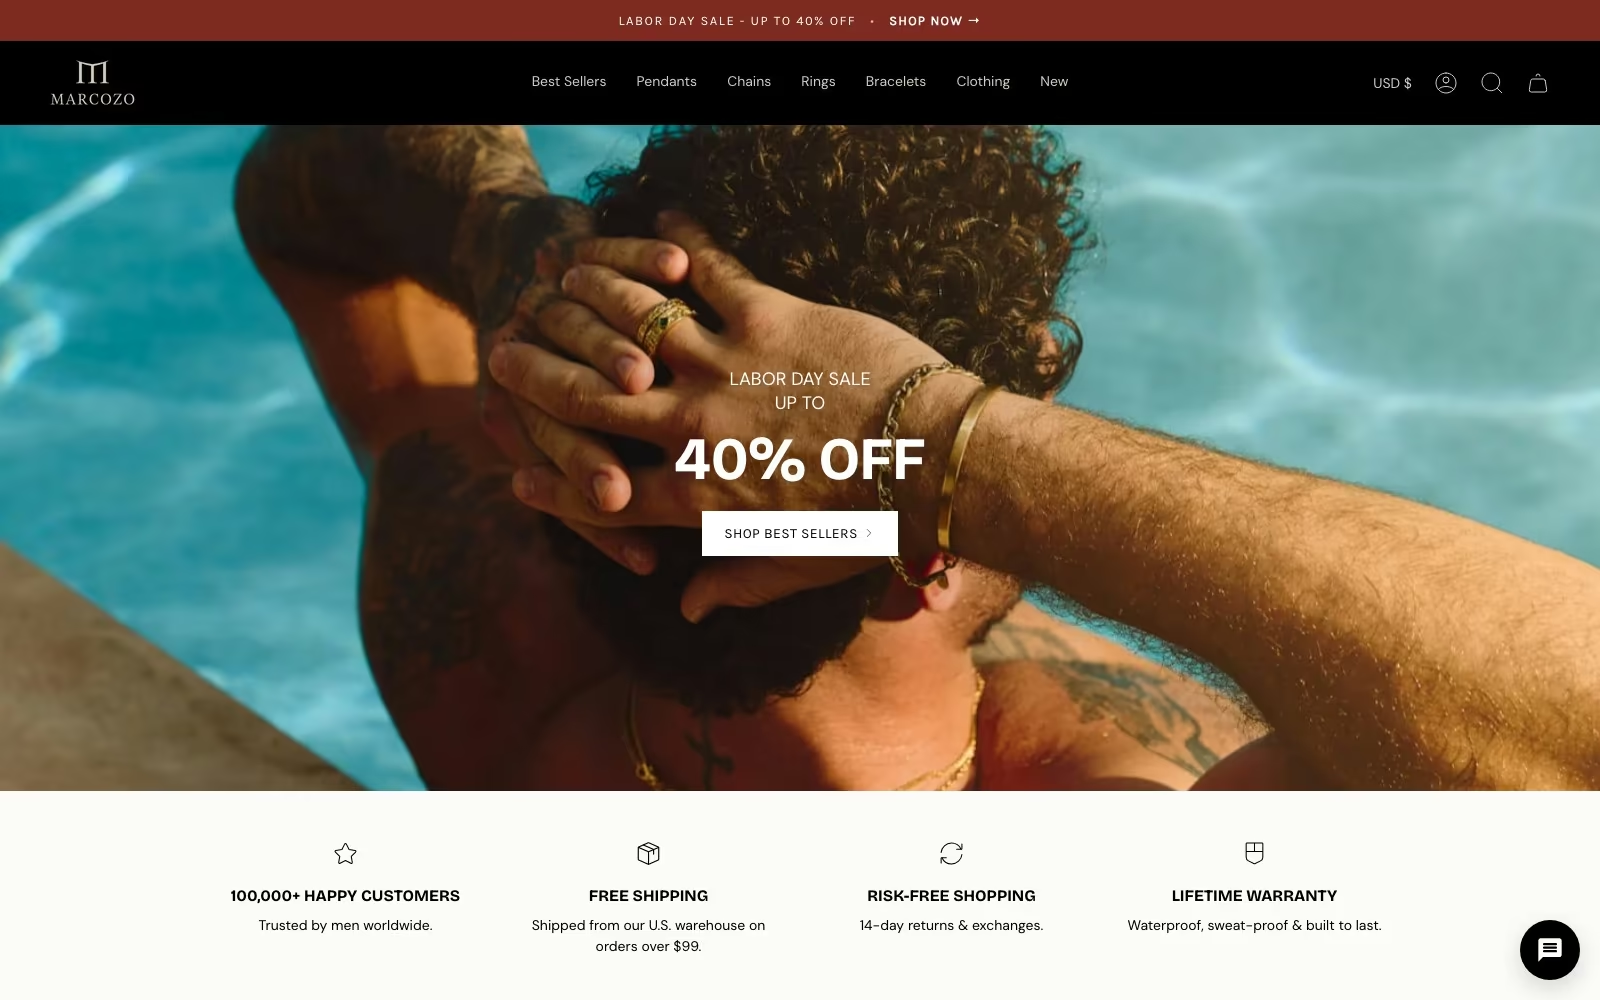













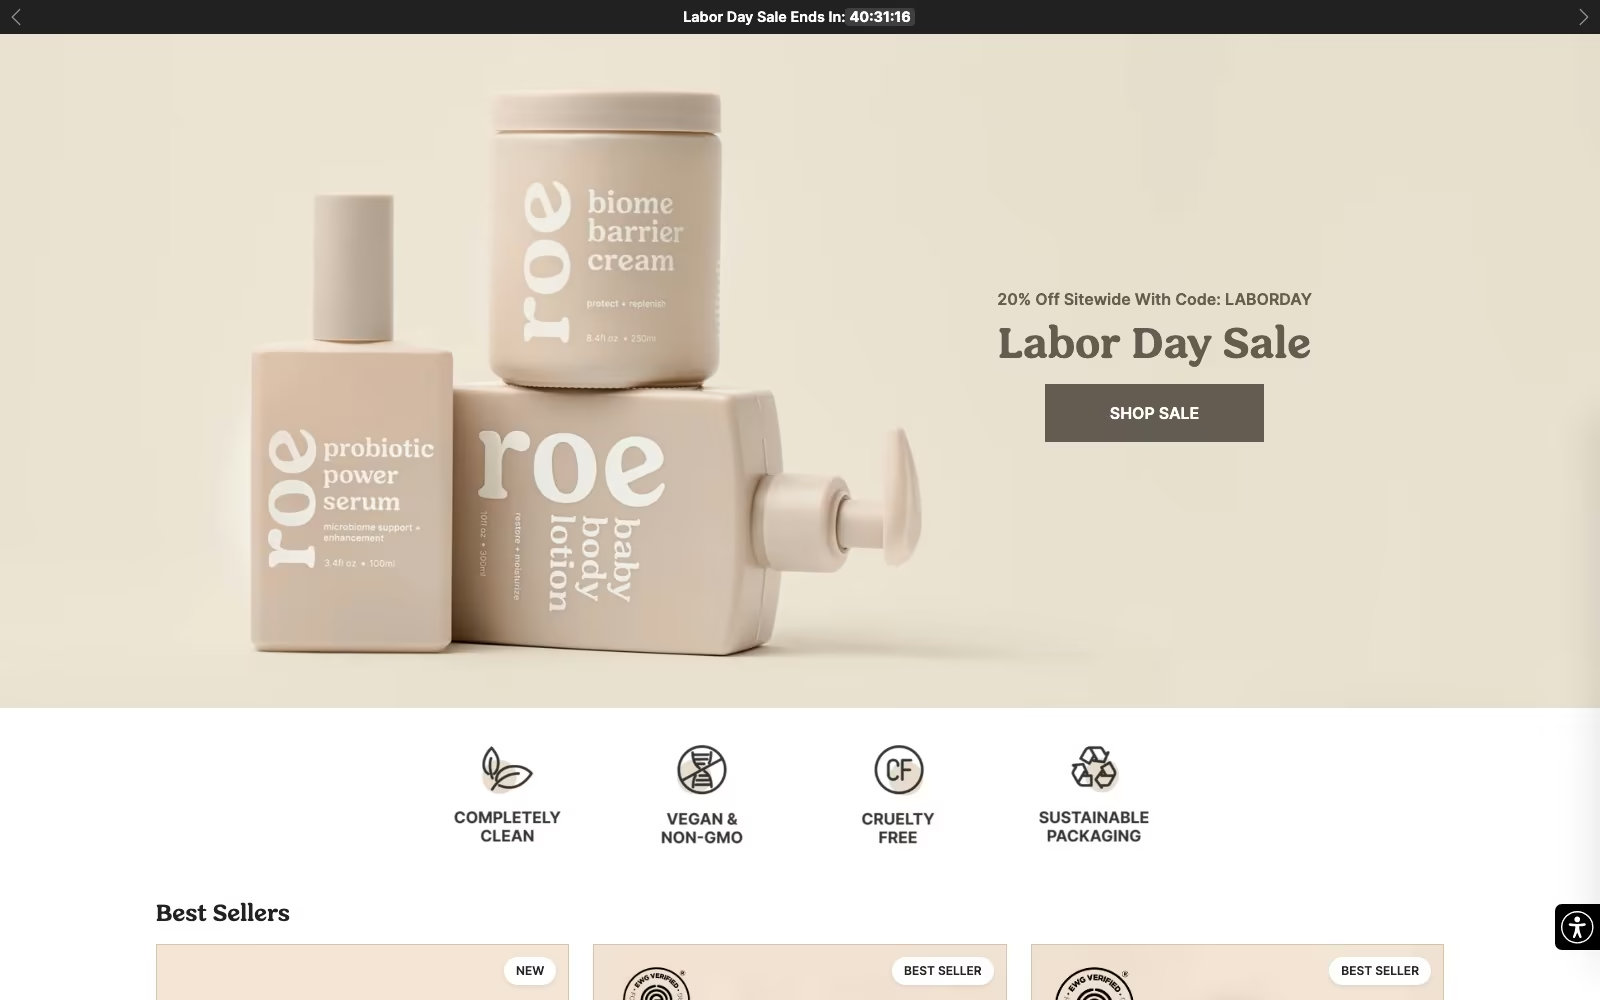

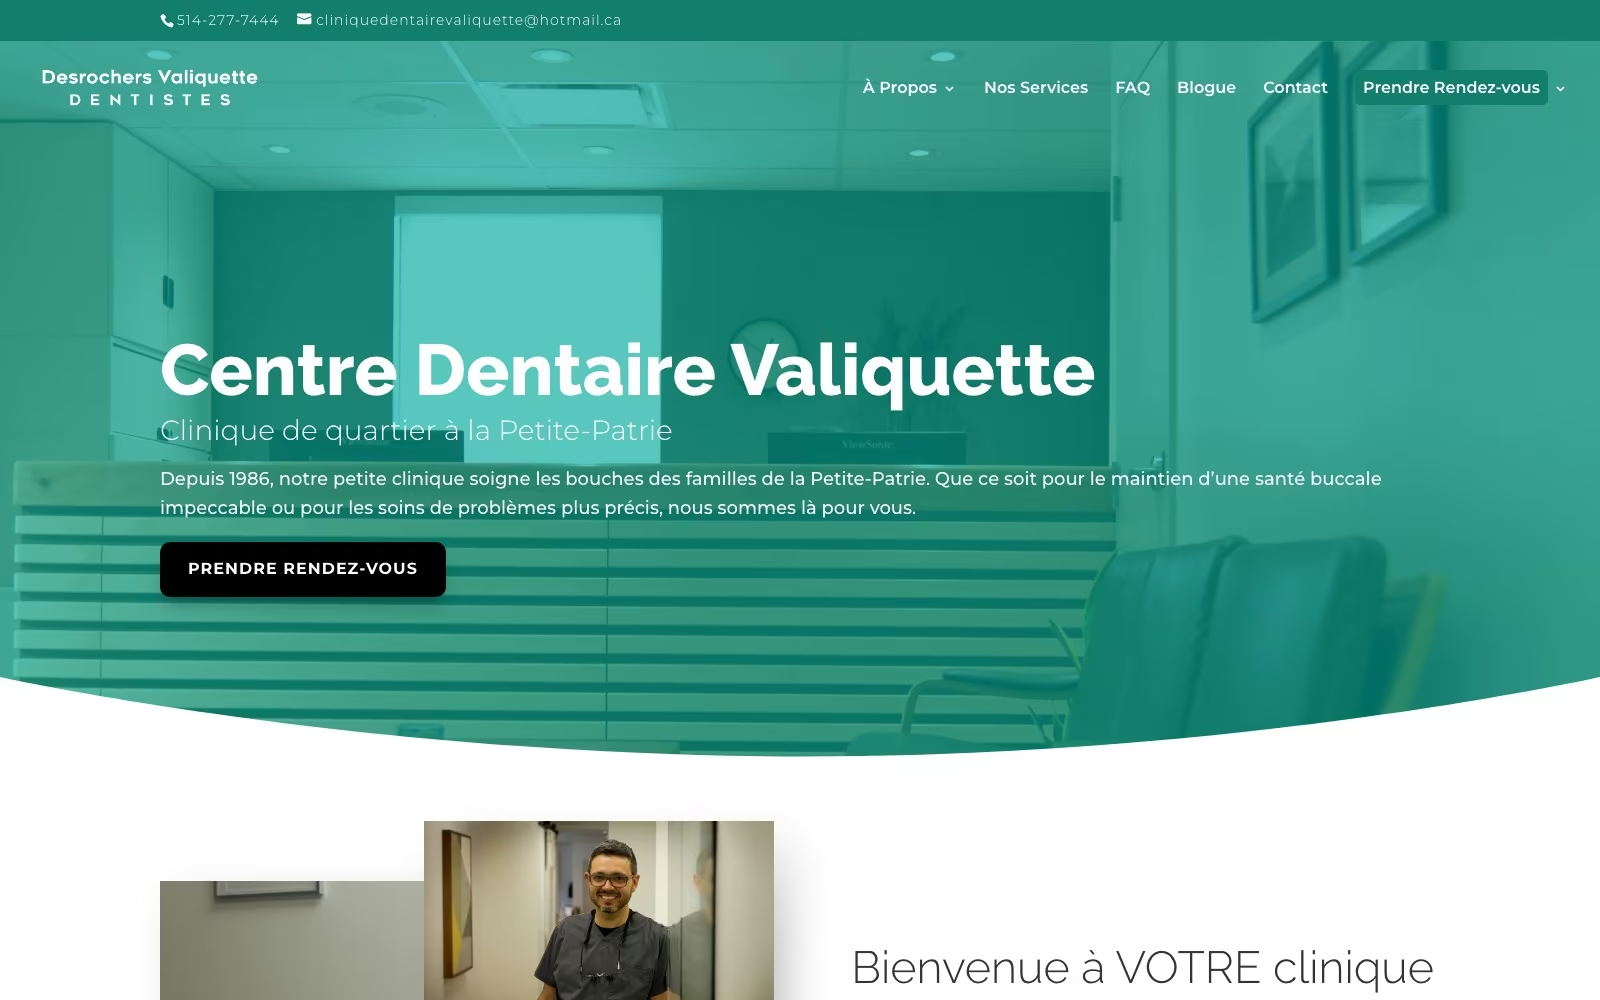
















EN

EN

EN


FR

FR
FR

FR

FR

FR

FR

FR


EN
FAQ
What dental group leaders ask before buying growth consulting.
What does dental growth consulting actually cover?
Four areas and a plan. Treatment presentation and acceptance, meaning diagnosed, accepted and completed value by provider; hygiene, recall and retention, meaning reappointment and attrition measured at the chair; procedure mix economics, meaning contribution and affordable acquisition cost by category and payer; and location capacity, so the growth target matches chairs and clinical hours. The output is a written plan with owners, a marketing brief your vendors can be held to, and a monthly scorecard your team maintains.
How is this different from a dental practice coach?
A coach works with the owner and team over months on leadership, systems and accountability, and good coaching changes practices. This is a shorter, narrower engagement: a data project that produces a commercial diagnosis and a written plan, then ends. We do not run a coaching program, a membership community or a training curriculum. Many groups run both, using the plan as the agenda the coaching then holds people to.
Is this for a single practice or a group?
It is built for groups, DSOs and private equity backed platforms, because the value comes from comparing locations, providers and acquired models against each other. A single practice with one operatory pair and one provider usually gets more from operational coaching and a tighter recall system. Where a single practice has several providers, real specialty volume and a genuine mix question, the analysis still pays, and we will say so at the scoping call.
How is this different from a dental marketing agency?
An agency is paid to buy media and generate new patients. This engagement is paid to find out where the group actually loses production, and in dentistry that is usually acceptance, completion, reappointment or schedule utilisation rather than reach. Because we take no execution work inside the engagement, the plan can conclude that you should spend less and fix the coordinator handoff. If you want execution afterwards it is scoped separately, and the brief is written so any agency, including your current one, can deliver against it.
Do you touch clinical decisions, coding or compliance?
No. Diagnosis, treatment planning standards, coding and regulatory questions belong with your clinical leadership and your own advisors. We stay on the commercial side: presentation and financing process, mix, recall, capacity and the marketing brief. Where a recommendation would touch a clinical or regulated area, the plan flags it and routes it rather than guessing.
What does the engagement cost?
A fixed fee quoted after a scoping call, with deliverables and dates written down before you commit. It varies with the number of practices, how many specialties are in scope and the state of the data, so publishing a rate would mislead most readers. For budget context, The CMO Survey puts marketing at an average 9.0% of company revenue, with 33.6% of digital activity run by outside agencies. Book a meeting for a scope and a number.
Our practice management data is messy. Is that a blocker?
No, and tidying it is usually part of the value. We work with what exists, reconcile production against collections, and state plainly which findings are solid and which are directional. 62% of organizations report losing revenue directly because of poor data quality, and only 41% have a dedicated data governance owner, so this is the norm rather than an embarrassment. The plan includes the field and process changes that make next year's analysis reliable, or marketing operations consulting if the rebuild is larger.
We need more new patients. Why start with acceptance?
Because the arithmetic is usually kinder there. Average case acceptance is 42% while the top 10% of practices reach 75%, and average retention is 70% against 94%, so a group that lifts acceptance and reappointment gets paid on demand it has already bought. New patient acquisition then compounds instead of replacing leakage, and the marketing brief can set a real cost per patient by category.
Does new patient volume actually drive growth?
It does once the base is healthy, and the platform data shows the size of it. Practices seeing 75 or more new patients a month grow at nearly double the rate of practices seeing fewer than 35, while the average practice sees 46 and nearly 40% see fewer than 20. The plan sequences it: fix the leaks that make acquisition expensive, then buy volume against a cost per patient the mix can support.
Can you help with schedule gaps, cancellations and no-shows?
We measure them and recommend the standard; your operations team runs it. Cancellations averaged 12.9% and no-shows 6.9% in the 2026 platform data, both improving year over year, and the average new patient waits 25 days for an appointment against 4.5 days in the top 10%. Those two facts together often explain a stalled practice better than its advertising does.
How do you handle a DSO with several brands?
The same method, run per operating brand and then compared, because that comparison is the point of a platform. Acceptance, completion, reappointment, production per day, schedule utilisation and contribution are cut by practice and by market, which shows which acquired model deserves to become the standard and which integration assumption is not supported. The plan is written so an operating partner can read it and act on it, and the marketing brief is portable across the platform.
Are you M&A advisors? We are being approached by buyers.
No. We are not a broker, an investment bank or a valuation firm, and nothing here is investment, tax or legal advice. What we do is the commercial work underneath those conversations: showing how the group really earns production and margin by practice and category, how much of the growth is repeatable, and what the plan for the next four quarters is. Owners preparing for a process often use that alongside their own financial and legal advisors.
Which numbers do you want before the first call?
Twelve months of production and collections by practice and provider, treatment plans with accepted and completed status, hygiene reappointment, scheduling records including cancellations and no-shows, and new patient counts with source where it exists. If the source field is unreliable, say so and we will work around it. We reconcile against the accounting system rather than taking dashboard totals at face value.
Do you work with other patient-facing practices?
Yes. The mechanics are close enough that the same engagement runs for adjacent categories, with the mix and recall cycles changed. The parent version is growth advisory, and there is a sibling page for medical spa growth consulting, where membership penetration and provider utilisation dominate the analysis instead of case acceptance.
How is this different from a marketing audit?
A marketing audit examines what is currently running and what it returns. This engagement is wider: it covers acceptance, hygiene and recall, procedure mix and location capacity, which is where dental growth is usually decided, and it ends in a plan rather than findings. Groups that want positioning and brand work rather than commercial mechanics should look at marketing strategy consulting instead.
What happens after the plan?
Your team runs it, and every workstream has a named owner on your side. Many groups book a review at ninety days to re-measure acceptance, reappointment and contribution, which takes half a day and is optional. Where you want ongoing marketing leadership rather than a project, a fractional CMO or scorecard advisory is the next engagement, quoted separately.

.webp)
.webp)


