Table of contents

Online sales grow when one of four numbers moves: sessions, conversion rate, average order value or repeat purchase rate. Everything else is a tactic serving one of them.
Key Takeaways
- US retail e-commerce hit $326.7 billion in Q1 2026, 16.9% of total retail sales and up 9.8% year over year, so the category is still growing faster than retail overall.
- Baymard's aggregate of 50 studies puts documented cart abandonment at 70.22%; 17% of US shoppers abandon a purchase because the flow is too long or complicated.
- Global e-commerce conversion sits between 1.6% and 2.95% depending on the panel, and swings from 0.94% in luxury to 6.22% in food and beverage.
- Cart recovery emails claw back 3.33% of lost sales at roughly $3.65 revenue per recipient — the strongest performing email flow.
- Average marketing email open rate is 20.73% with a 2.27% click rate; automated flows run far ahead at 30.63% open and 7.39% click.
- Better checkout design alone is worth an estimated 35.26% conversion lift for a large store — about $260 billion in recoverable US and EU orders.
The four numbers that decide online sales
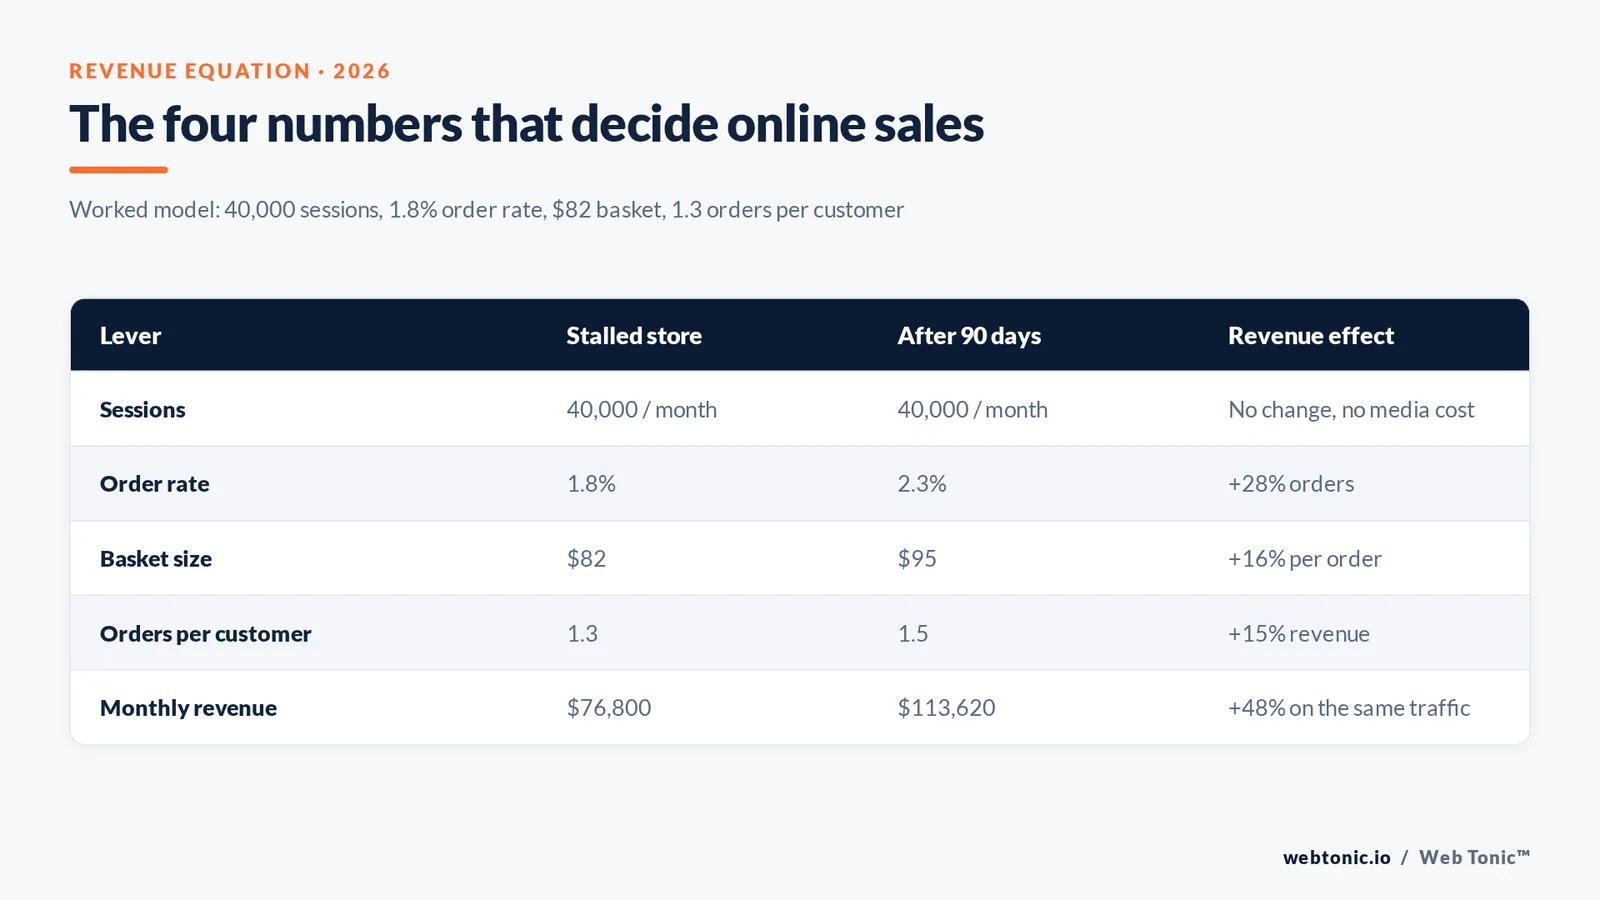
The formula for any shop is sessions × conversion rate × average order value × orders per customer. Treat it as a diagnostic before you treat it as a growth plan: a 10% gain on each of the four multiplies out to a 46% revenue increase, while a 40% traffic push alone gives you 40% at full media cost. That is why cheap wins usually sit to the right of the equation, not at the traffic end.
| Lever | What it means | Where it is measured | Typical drag on a stalled store | Price of moving it 10% |
|---|---|---|---|---|
| Sessions | Qualified visits from search, social media, email and paid ads | GA4 Traffic acquisition | Wrong-intent traffic from broad campaigns | High — scales with media spend |
| Order rate | Orders divided by sessions | GA4 e-commerce purchases | Product page and checkout friction | Low — mostly design and copy work |
| Basket size | Turnover divided by orders | Platform order reports | No bundles, no shipping threshold | Low — merchandising and offers |
| Orders per customer | Repeat purchase rate over 12 months | Cohort or customer report | No post purchase email at all | Low — owned channels |
Run the arithmetic on your own store before choosing tactics. A shop with 40,000 monthly sessions, a 1.8% conversion rate, an $82 average order value and 1.3 orders per customer books about $76,800 a month. Lifting conversion to 2.3% and average order value to $95 — both realistic inside a quarter — produces $113,620 with the same traffic. Our growth marketing team starts every e-commerce engagement with this single calculation, because it decides which of the levers below is worth funding.
Where the money leaks between visit and second purchase
Most stores do not have one problem, they have a stack of small ones. Map the drop-off stage by stage against public benchmarks and the largest leak becomes obvious in an afternoon.
| Funnel stage | Benchmark | Signal that this is your leak | First fix |
|---|---|---|---|
| Landing | Bounce above 60% on paid landing pages | Paid clicks arriving on generic category pages | Match the landing page to the ad promise |
| Item page | Around 1.6–2.95% site-wide conversion | High product views, low add-to-cart | Images, spec table, delivery date, reviews |
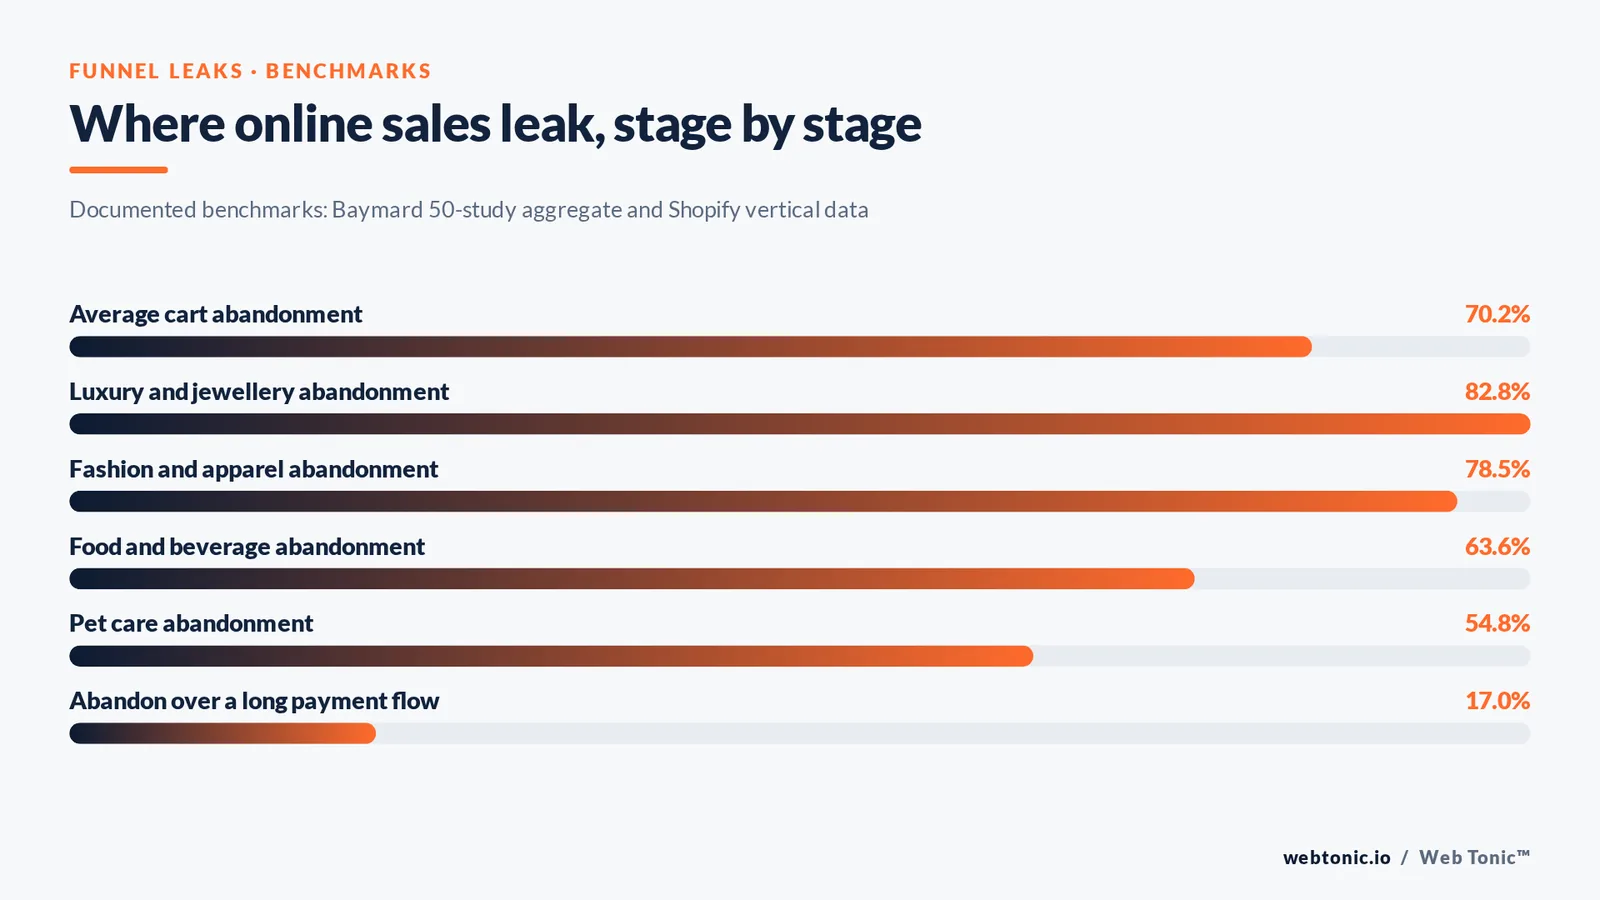
| Basket step | 70.22% average abandonment (Baymard) | Baskets built, few reach payment | Show freight and tax before the payment step |
| Payment flow | 17% abandon over a long or complex flow | Payment step entered, few orders | Cut form fields, allow guest buying, add wallets |
| Payment | Declines and wallet gaps | Payment step exits | Add wallets and buy-now-pay-later |
| After the order | Repeat rate under 20% | One-and-done customers | Three-email post purchase flow |
Read the abandonment reasons honestly. Baymard found 42% of US online shoppers abandoned simply because they were browsing and not ready to buy — that group is a retargeting and email job, not a checkout redesign. The documented reasons for cart abandonment separate the shoppers you can win now from the ones you can only nurture.
34 ways to increase online sales, grouped by lever
Every tactic below maps to exactly one of the four numbers. Pick two per lever per quarter; running thirty at once means you will never know which worked.
Traffic levers — 9 tactics. Buy or earn qualified sessions rather than volume.
| Tactic | How it increases online sales | Effort | Time to first result |
|---|---|---|---|
| Bottom-funnel search ads | Captures shoppers already comparing products | Medium | Days |
| Shopping and product feed ads | Puts price and image in the SERP before the click | Medium | Days |
| Category-level SEO pages | Compounding non-paid sessions on commercial queries | High | 3–6 months |
| Comparison and buyer-guide content | Wins research queries and feeds retargeting pools | Medium | 2–4 months |
| Social media ads with catalogue creative | Dynamic product ads to warm audiences | Medium | Days |
| Organic social media content with product tags | Low-cost demand from existing followers | Medium | Weeks |
| Creator and affiliate partnerships | Third-party credibility at variable cost | Medium | Weeks |
| Marketplace listings | Borrowed demand from Amazon-style intent | Medium | Weeks |
| List growth offers | Builds the cheapest future traffic source you own | Low | Immediate |
Conversion levers — 10 tactics. These are the cheapest points on the board because you already paid for the visit.
| Tactic | How it increases online sales | Effort | Time to first result |
|---|---|---|---|
| Guest buying | Removes the account wall before payment | Low | Immediate |
| Fewer form fields | Directly attacks the 17% complexity abandonment | Low | Days |
| Full price shown up front | Kills the unexpected-shipping exit | Low | Days |
| Digital wallets and one-click pay | Shortens mobile payment to a tap | Low | Days |
| Delivery date on the product page | Answers the biggest pre-purchase question | Low | Days |
| Reviews on item pages | Social proof at the decision point | Low | Weeks |
| Live chat or async messaging | Answers objections that cause silent exits | Medium | Weeks |
| Photography and video | Replaces the in-store inspection | Medium | Weeks |
| Site speed on mobile | Recovers sessions lost before render | Medium | Days |
| Returns policy stated near the button | Removes purchase risk | Low | Immediate |
Average order value levers — 8 tactics. Margin-safe if you gate them behind a threshold.
| Tactic | How it increases online sales | Effort | Watch out for |
|---|---|---|---|
| Free shipping threshold above average order value | Pushes carts up to reach the bar | Low | Setting it too high to reach |
| Bundle and kit builders | Multiple units per order | Medium | Discount stacking |
| Quantity-break offers such as buy 2 save 10% | More units without a sitewide discount | Low | Margin on the top tier |
| Post-add-to-cart upsells | Relevant add-on at peak intent | Low | Interrupting checkout |
| Recommendation blocks | Cross-sells from browsing behaviour | Medium | Irrelevant recommendations |
| Warranty or protection plans | High-margin add-on income | Medium | Fulfilment complexity |
| Subscriptions with a 10–20% perk | Locks in predictable orders | High | Churn management |
| Gift wrapping and personalisation | Small paid add-ons | Low | Operational load |
Retention levers — 7 tactics. The most under-built lever in almost every store we audit.
| Tactic | How it increases online sales | Effort | Benchmark to hold |
|---|---|---|---|
| Recovery flow | Recovers roughly 3.33% of lost sales | Low | $3.65 revenue per recipient |
| Browse flow | Catches shoppers who never reached the cart | Low | Open rate above 30% |
| Education series | Reduces returns and builds trust | Low | 3 emails in 21 days |
| Replenishment reminders | Times the next order to consumption | Medium | Cycle length per product |
| Win-back offers at 90 and 180 days | Reactivates lapsed customers | Low | Contribution margin positive |
| Loyalty or store credit | Raises orders per customer | High | Redemption expense |
| SMS for time-sensitive drops | High-attention channel for launches | Medium | Strict consent |
Item pages carry more weight than the homepage
Nielsen Norman Group's e-commerce research is blunt on this: the only test participants who ignored the product page were the ones who already knew exactly which product they wanted. Everyone else used it to decide. Their usability findings on e-commerce product pages and Shopify's product page guidance agree on the elements that matter.
| Element | Question it answers | Failure mode we see most | Fix that lifts add-to-cart |
|---|---|---|---|
| Primary image set | Is this the thing I pictured | Three low-resolution shots on white | 6–8 images including scale and in-use |
| Spec table | Will it fit or work with what I own | Specs buried in a paragraph | Structured spec table above the fold on mobile |
| Price and promotion | Am I getting a fair deal | Discount without the reference price | Show the offer and the saving in one line |
| Delivery promise | When will it arrive | Shipping revealed only at checkout | Named delivery window on the page |
| Reviews | Do people like me trust this | Star average with no text | Recent, product-specific written reviews |
| Returns | What if it is wrong | Policy linked in the footer only | One line beside the buy button |
| Structured data | Will Google show price and rating | No structured data at all | Markup for price, availability and rating |
Add product structured data while you are in there. It does not change the page for shoppers, but it changes how the listing looks in search, which changes click-through before the visit is even counted.
Basket and payment flow: recovering the 70%
Abandonment is not one behaviour. Split it into the reasons and only two of them are design problems you can fix this week.
| Reason given | Share of US shoppers | Type of problem | What to do |
|---|---|---|---|
| Just browsing, not ready to buy | 42% | Timing | Retarget and capture the email |
| Flow too long or complicated | 17% | Design | Cut fields by 20–60%, add wallets |
| Unexpected extra charges | Long-standing top-three reason | Merchandising | Publish freight and tax early |
| Account creation required | Recurring blocker | Design | Allow guest buying, offer the account after |
| Delivery too slow | Recurring blocker | Operations | Offer a paid express tier |
| Payment method missing | Recurring blocker | Technical | Add wallets and instalments |
Baymard's estimate of the prize is worth quoting to a finance team: solvable usability issues in the payment flow alone represent a 35.26% conversion increase for a large store, equal to about $260 billion of recoverable orders across the US and EU. Cutting a payment flow from twelve fields to eight is a one-sprint job with that kind of upside.
Email and SMS flows that carry the recovery
Campaign email is a broadcast; flows are the revenue. Brevo's benchmark of 175,000 senders shows why: campaigns average 20.73% open and 2.27% click, while automated messages average 30.63% open and 7.39% click. The 2026 email marketing benchmarks are the reference to hold your flows against.
| Flow | Trigger | Timing | Benchmark to expect |
|---|---|---|---|
| Recovery sequence | Payment step entered, no order | 1 hour, 24 hours, 48 hours | 3.33% of lost sales recovered |
| Browse abandonment | Product viewed twice, no cart | 4 hours, 36 hours | Open rate above 30% |
| Welcome series | Email captured | Immediately, day 2, day 5 | Highest open rate of any flow |
| Post purchase | Order placed | Day 1, day 7, day 21 | Fewer support tickets and returns |
| Replenishment | Consumption cycle ends | Product-specific | Repeat orders per customer up |
| Win-back | No order in 90 days | Day 90, day 180 | Contribution margin positive |
Shopify's teardown of abandoned cart emails reports the same 3.33% recovery figure and $3.65 revenue per recipient from Klaviyo data, with a full sequence recovering 3% to 5% of abandoned carts. On a store losing 1,000 carts a month at an $82 average order value, that is $2,460 to $4,100 a month from three automated emails.
Free shipping, bundles and offers without wrecking margin
Every offer has a break-even. Do the arithmetic before it goes live, not after the promotion report.
| Offer | Mechanic | Break-even test | Margin risk |
|---|---|---|---|
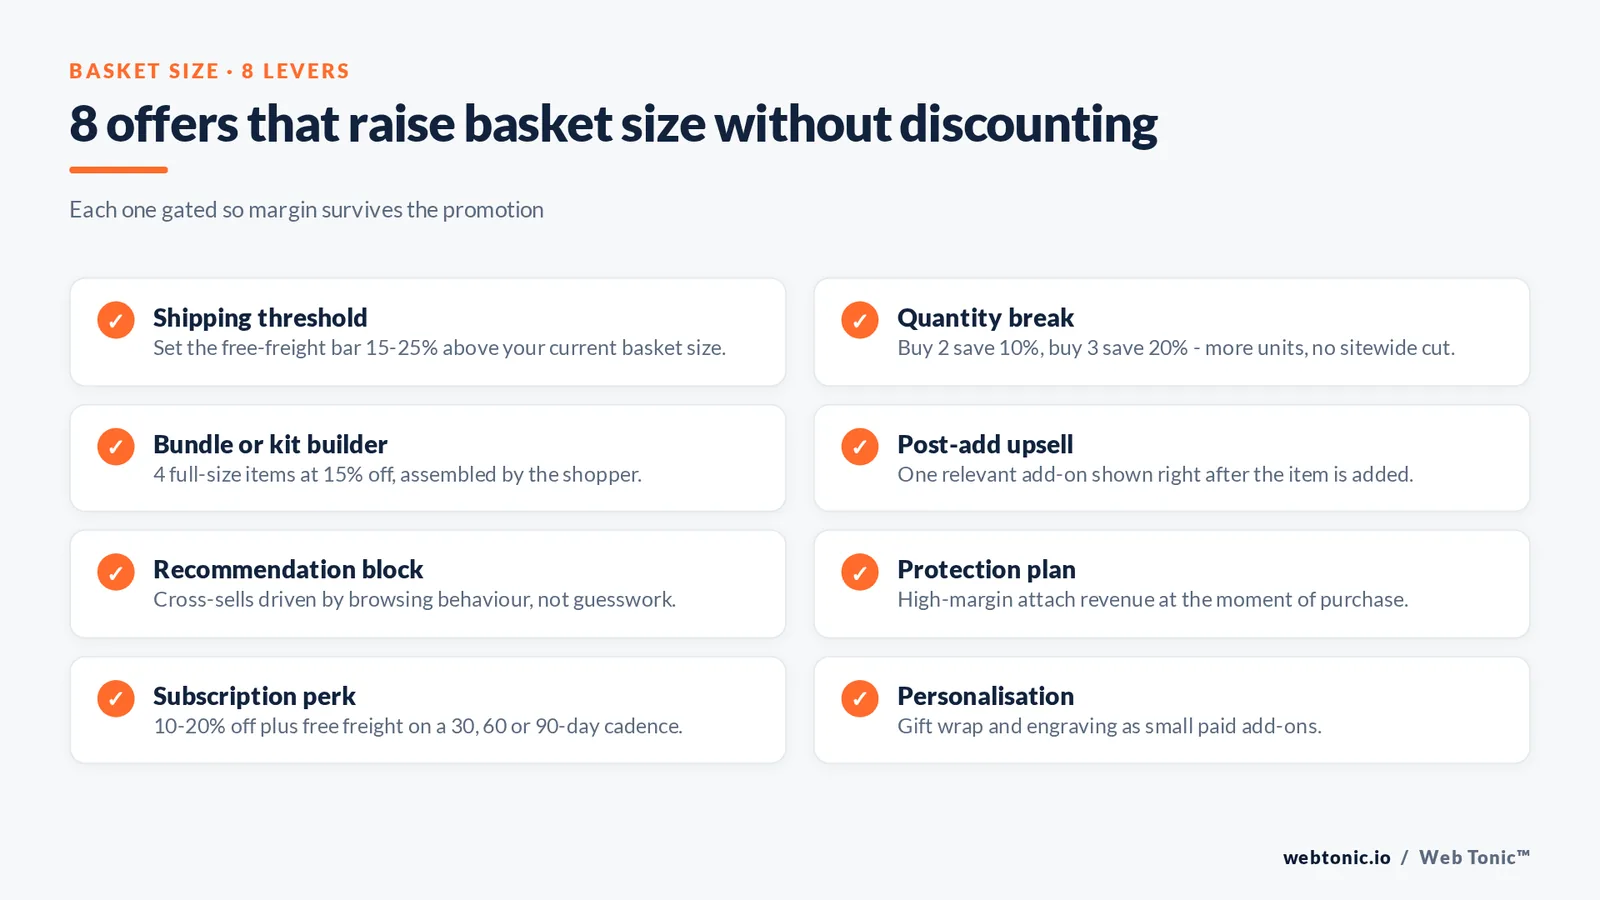
| Shipping threshold | Free over a bar set 15–25% above average order value | Extra units must cover the freight | Low if gated |
| Quantity break | Buy 2 save 10%, buy 3 save 20% | Extra units must beat the discount | Medium at the top tier |
| Bundle or kit | 4 items at 15% off | Bundle margin against single-unit margin | Medium |
| Subscription perk | 10–20% off plus free shipping | Lifetime value against the first-order discount | Medium |
| Countdown event | Time-boxed sitewide event | Pull-forward versus incremental demand | High if repeated |
| Protection plan | Attach as the item is added | Attach rate times plan profit | Low |
Shopify's upselling examples document real mechanics at these levels: tiered bracelet builders unlocking 10%, 15% then 20%, kit builders at 15% off four full-size items, and subscription cadences of 30, 60 or 90 days paired with 10–20% off. One case study reports a warranty partner adding $500,000 in protection plan sales and an 11% conversion lift in a year. For the offer design itself, our guide to sales promotion examples covers the legal guardrails and the measurement plan.
Reviews, social proof and chat remove the last doubt
Trust closes the gap between interest and payment. Shopify's social proof playbook and the consumer review survey both point the same way: recency and specificity beat volume.
| Proof type | Placement that works | Why it converts | Rule to follow |
|---|---|---|---|
| Written reviews | Directly under the buy button | Answers the fit and quality question | Show the most recent, not the best |
| Photo and video proof | Image gallery | Shows the product in a real room | Ask for them in the day-7 email |
| Review count and average | Beside the title | Fast credibility signal | Never suppress low ratings |
| Customer count or units sold | Homepage and category | Herd signal for new visitors | Only if the number is real |
| Third-party trust marks | Checkout | Reduces payment anxiety | Payment and security marks only |
| Live chat or messaging | Product and checkout pages | Handles objections in real time | Publish response-time expectations |
| User-generated social media content | Product page carousel | Proof from people like the buyer | Get written permission |
After delivery: turning one order into three
Acquisition is paid for once; the second and third orders arrive at almost no media spend. Shopify's customer retention guide is a good structural reference, but the operating discipline is simpler than the tooling suggests.
| Window after order | Objective | Action | Metric to watch |
|---|---|---|---|
| Day 0–1 | Confirm and reassure | Order confirmation with real tracking | Support contact rate |
| Day 2–7 | Make the product succeed | Setup or usage email | Return rate |
| Day 8–21 | Collect proof | Review and photo request | Review submission rate |
| Day 22–60 | Cross-sell the obvious next item | Recommendation email | Second-order rate |
| Day 60–120 | Time the replenishment | Reminder at the consumption cycle | Orders per customer |
| Day 120+ | Reactivate | Win-back offer, then suppress | Reactivation margin |
Set a target, not a hope: a store with a repeat purchase rate under 20% has an unfinished retention programme, and moving orders per customer from 1.3 to 1.5 is worth 15% more revenue at zero incremental media spend.
Five mistakes that stall online sales growth
| Mistake | What it looks like | Cost | Correction |
|---|---|---|---|
| Chasing traffic first | Doubling ad spend at a 1.2% conversion rate | You pay full rate for the same leak | Fix conversion before scaling media |
| Sitewide discounting | Permanent 20% off banner | Trains customers to wait and erodes profit | Gate offers behind thresholds |
| Running 30 tests at once | Nothing is isolated | No learning survives the quarter | Two tactics per lever per quarter |
| Ignoring mobile buying | Desktop-only quality assurance | Most sessions land there, worst experience | Buy something on a real phone weekly |
| No owned audience | Paid traffic only | Every order needs paid media | Build the email and SMS list now |
A 90-day plan to increase online sales
This is the sequence we run for e-commerce clients. It front-loads the cheap conversion work so later media spend lands on a store that converts.
| Weeks | Focus | Deliverables | Success measure |
|---|---|---|---|
| 1–2 | Measure | GA4 e-commerce events verified, funnel benchmarked, revenue equation modelled | Trustworthy baseline |
| 3–5 | Checkout | Field count cut, guest buying, wallets, full price up front | Payment completion up |
| 6–8 | Product pages | Images, spec tables, delivery promise, reviews, structured markup | Basket-add rate up |
| 9–10 | Flows | Cart recovery, browse abandonment, welcome, post purchase live | Flow revenue share above 20% |
| 11–12 | Average order value | Shipping threshold, one bundle, one post-cart upsell | Average order value up 8–15% |
| 13 | Scale | Reallocate budget to the channels that now convert | Blended return on ad spend holds while spend rises |
Measuring whether the sales growth is real
Half the reported lifts we review are tracking artefacts. Confirm the measurement before you claim the win, using GA4 e-commerce event documentation as the specification.
| Metric | Definition | Where it lives | Trap |
|---|---|---|---|
| Conversion rate | Orders divided by sessions | GA4 e-commerce report | Comparing a paid-only rate to a site-wide benchmark |
| Average order value | Revenue divided by orders | Platform reports | Discounts and shipping counted inconsistently |
| Flow completion | Orders divided by payment-step entries | GA4 funnel exploration | Missing begin_checkout tag |
| Flow revenue share | Flow-attributed sales divided by total | Email platform | Attribution window differences |
| Repeat rate | Customers with 2+ orders divided by all customers | Cohort report | Guest orders splitting one buyer in two |
| Margin per order | Order value minus goods, freight and media spend | Finance model | Growing revenue while margin falls |
Context matters as much as the metric. Statista panel data puts global e-commerce conversion at 1.6% in Q3 2025 while Dynamic Yield reports 2.95%, and industry spreads run from 0.94% in luxury and jewellery to 6.22% in food and beverage per Shopify's conversion rate benchmarks. Cart abandonment splits the same way: 82.84% in luxury against 54.78% in pet care. Compare yourself to your own vertical, then to your own last quarter. For the testing discipline behind these numbers, see our conversion rate optimization guide, and our breakdown of average click-through rates if paid traffic is the lever you are funding.

FAQ
What is the fastest way to increase online sales?
Fix the payment flow. Cutting form fields, allowing guest buying and showing the full price with freight before payment attacks the 17% of shoppers who walk away from a complicated flow, and it ships in days rather than months. Turning on a three-email cart recovery flow is the second fastest move, recovering roughly 3.33% of lost sales.
How can social media increase ecommerce sales?
Two ways, and they are measured differently. Paid social media ads with catalogue creative sell directly to warm audiences and are judged on return on ad spend. Organic social media content and creator partnerships build the audience and the retargeting pool that make those ads cheap, and are judged on assisted revenue and email list growth rather than last-click orders.
Which email marketing tactics convert visitors into customers?
Automated flows, not campaigns. Cart recovery, browse abandonment, welcome and post purchase sequences average 30.63% open and 7.39% click against 20.73% and 2.27% for broadcast campaigns. Build those four flows before you plan another newsletter.
What is a good ecommerce conversion rate in 2026?
Global averages land between 1.6% and 2.95% depending on the data panel, but the industry spread matters more: 0.94% is normal in luxury and jewellery while food and beverage averages 6.22%. Benchmark against your own vertical and your own trailing quarter.
How do I raise average order value without discounting?
Use thresholds and bundles instead of price cuts. Set a free shipping bar 15–25% above your current average order value, add one bundle or kit builder, and place a single relevant upsell right after the item is added. Each raises units per order while leaving your list price intact.
Sources
Baymard Institute cart abandonment statistics 2026 · US Census Bureau Quarterly Retail E-Commerce Sales, Q1 2026 (released 18 May 2026) · Shopify e-commerce conversion rate, product page, abandoned cart email, upselling, social proof and customer retention guides · Brevo 2026 Marketing Orchestration Benchmark · Nielsen Norman Group e-commerce product page research · Unbounce Conversion Benchmark Report · Google Analytics 4 e-commerce measurement documentation · Google Search Central product structured data documentation · BrightLocal Local Consumer Review Survey. All figures verified August 2026.