Table of contents
Average CTR depends entirely on the channel: roughly 4–6% on Google Search ads, 2.27% on marketing email, well under 1% on display, and about 28% for the first organic result. A single "good CTR" number does not exist — only a good CTR for your channel, industry and intent.
Key Takeaways
- CTR is clicks ÷ impressions. Five clicks on 100 impressions is a 5% click-through rate, per Google's own definition.
- Paid search averages 4–6%; display advertising sits an order of magnitude lower because it captures passive rather than active intent.
- Marketing email averages a 2.27% CTR, with the top 10% of senders at 5.22% and automated or transactional email at 7.39%.
- Organic click rates collapse with position: about 28% at rank one, 15% at two, 11% at three and under 1% anywhere on page two.
- Industry swings are larger than most channel gaps — email CTR ranges from 1.78% in North America to 3.53% in government and public administration.
- A rising CTR with flat conversions is a targeting problem, not a win. Judge CTR next to cost per click, conversion rate and CPA, never on its own.
What CTR actually measures (and what it does not)
Click-through rate is a ratio of interest, not of value. Google defines it plainly: CTR is the number of clicks an ad receives divided by the number of times it was shown. Nothing in that formula knows whether the click produced revenue.
Average CTR adds one layer: instead of a single ad, it aggregates clicks and impressions across a campaign, an ad group, a keyword or a whole account for a date range. That is why an account-level average CTR can look healthy while a third of the keywords inside it are dragging Quality Score down.
The metric also gets confused with four neighbours that measure different things. Getting the definitions straight is the difference between a real benchmark and a false alarm.
| Metric | Formula | What it answers | Where it is reported |
|---|---|---|---|
| CTR (click-through rate) | clicks ÷ impressions | Did the creative earn attention from everyone who saw it? | Google Ads, Meta, LinkedIn, Search Console, display and DSPs |
| Average CTR | total clicks ÷ total impressions across a set | How does the campaign, keyword set or account perform overall? | Campaign, ad group and account rollups |
| CTOR (click-to-open rate) | unique clicks ÷ unique opens | Did the people who opened the email find something worth clicking? | Email platforms; typical range 10–20% |
| Engagement rate | interactions ÷ followers or impressions | Did organic social content provoke any reaction at all? | Native social analytics and social listening tools |
| VTR / view rate | views ÷ impressions | Did the video hold attention before any click existed? | YouTube and video campaign reporting |
One structural point matters before any benchmark: impressions are not equal. A search ad appears after somebody typed a commercial query. A display banner appears next to unrelated content. Nielsen Norman Group's long-running research on banner blindness found that users systematically avoid looking at anything that resembles advertising, which is why comparing a display CTR against a search CTR is meaningless in both directions.
Average CTR by channel: the master benchmark table
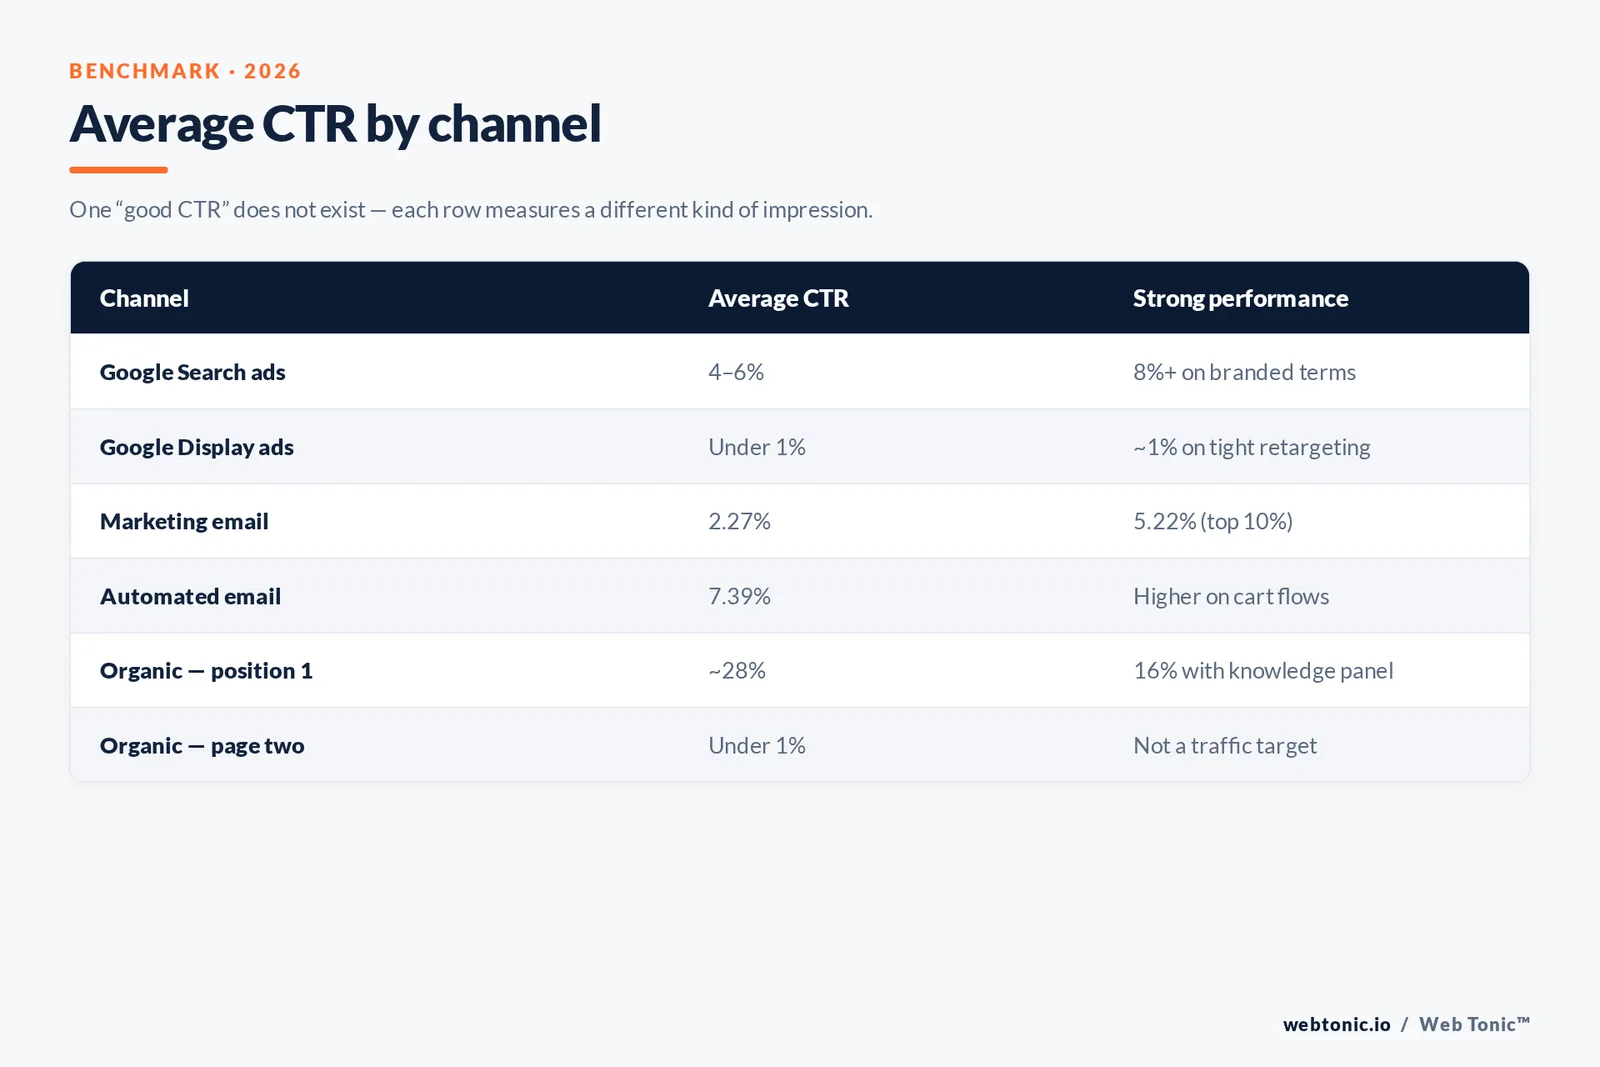
These are the figures to anchor on. Each row cites the source that published it, and each one measures a different kind of impression.
| Channel | Average CTR | Strong performance | Source |
|---|---|---|---|
| Google Ads — Search Network | 4–6% | 8%+ on branded and tightly matched terms | WordStream benchmark data |
| Google Ads — Display Network | Well below 1% | ~1% on tight retargeting pools | WordStream: display CTR is consistently lower than search |
| Marketing email | 2.27% | 5.22% (top 10% of senders) | Brevo 2026 benchmark |
| Automated / transactional email | 7.39% | Higher still on cart and post-purchase flows | Brevo 2026 benchmark |
| Organic search — position 1 | ~28% | Falls to 16% when a knowledge panel is present | Advanced Web Ranking study reported by Search Engine Journal |
| Organic search — page two | Under 1% per position | Not a realistic traffic target | Same study |
| Organic social posts | Fractions of a percent | Engagement rate is the honest metric here | Socialinsider 2026 benchmarks: 2.60% TikTok engagement, 0.15% Facebook |
Rule 1 — compare like with like. A 0.8% display CTR is not a failure and a 6% search CTR is not automatically a success. Benchmark inside the channel, then inside the industry, then against your own trailing 90 days.
Google Ads: why search and display split so hard
WordStream's analysis of its client base found that while display buys cheaper clicks, search delivers the higher CTR, the higher conversion rate and the lower CPA — the channel that captures existing intent wins on every efficiency metric except raw cost per click. Their own average CTR reference puts paid search at 4–6% across accounts, with the caveat that industry variance is wide enough to make the aggregate figure a weak target.
CTR is not just a scorecard inside Google Ads — it is an input. Expected click-through rate feeds Ad Rank, which decides whether an ad shows at all and where. Low CTR therefore compounds: worse position, fewer impressions, higher cost for the same visibility. That feedback loop is the practical reason to care.
| Campaign type | Typical CTR band | Why it lands there | What to optimise first |
|---|---|---|---|
| Branded search | 10–25% | The searcher already wants you | Protect it; do not judge the account by this number |
| Non-brand exact match | 4–8% | High intent, high competition | Ad copy relevance and pinned headlines |
| Non-brand broad match | 2–4% | Query drift pulls in weak matches | Negative keywords and search term review |
| Shopping / product listings | 0.6–1.5% | Grid layout, many competing tiles | Feed titles, imagery and price competitiveness |
| Display prospecting | 0.05–0.15% | Passive intent plus banner blindness | Placement exclusions, not headline tweaks |
| Display retargeting | 0.3–1% | Warm audience, small pool | Frequency caps and creative refresh cadence |
| Video / in-stream | 0.1–0.6% | The click is a secondary action | View rate and completion first, CTR second |
Format also caps what is achievable. The IAB ad portfolio and the Better Ads Standards both constrain how intrusive display creative can be — one reason display CTR has stayed structurally low rather than trending up with better tooling.
Email: the channel with the cleanest benchmarks
Email reporting is the most standardised of the lot, so the numbers travel well. Brevo's 2026 benchmark across its sending base puts the overall marketing-email click-through rate at 2.27%, with the top decile at 5.22% and unsubscribes averaging 0.46%.
| Segment | Open rate | Click-through rate | Read this as |
|---|---|---|---|
| All marketing email | 20.73% | 2.27% | The baseline to beat |
| Top 10% of senders | 44.02% | 5.22% | What disciplined segmentation looks like |
| Automation and transactional | 30.63% | 7.39% | Timing beats copy |
| Europe | 22.83% | 2.29% | Consent-first lists engage more |
| North America | 17.32% | 1.78% | Higher volume, more inbox fatigue |
| APAC | 17.56% | 1.46% | Mobile-first, shorter attention |
| LATAM | 14.72% | 1.21% | Passive but loyal: 0.23% unsubscribes |
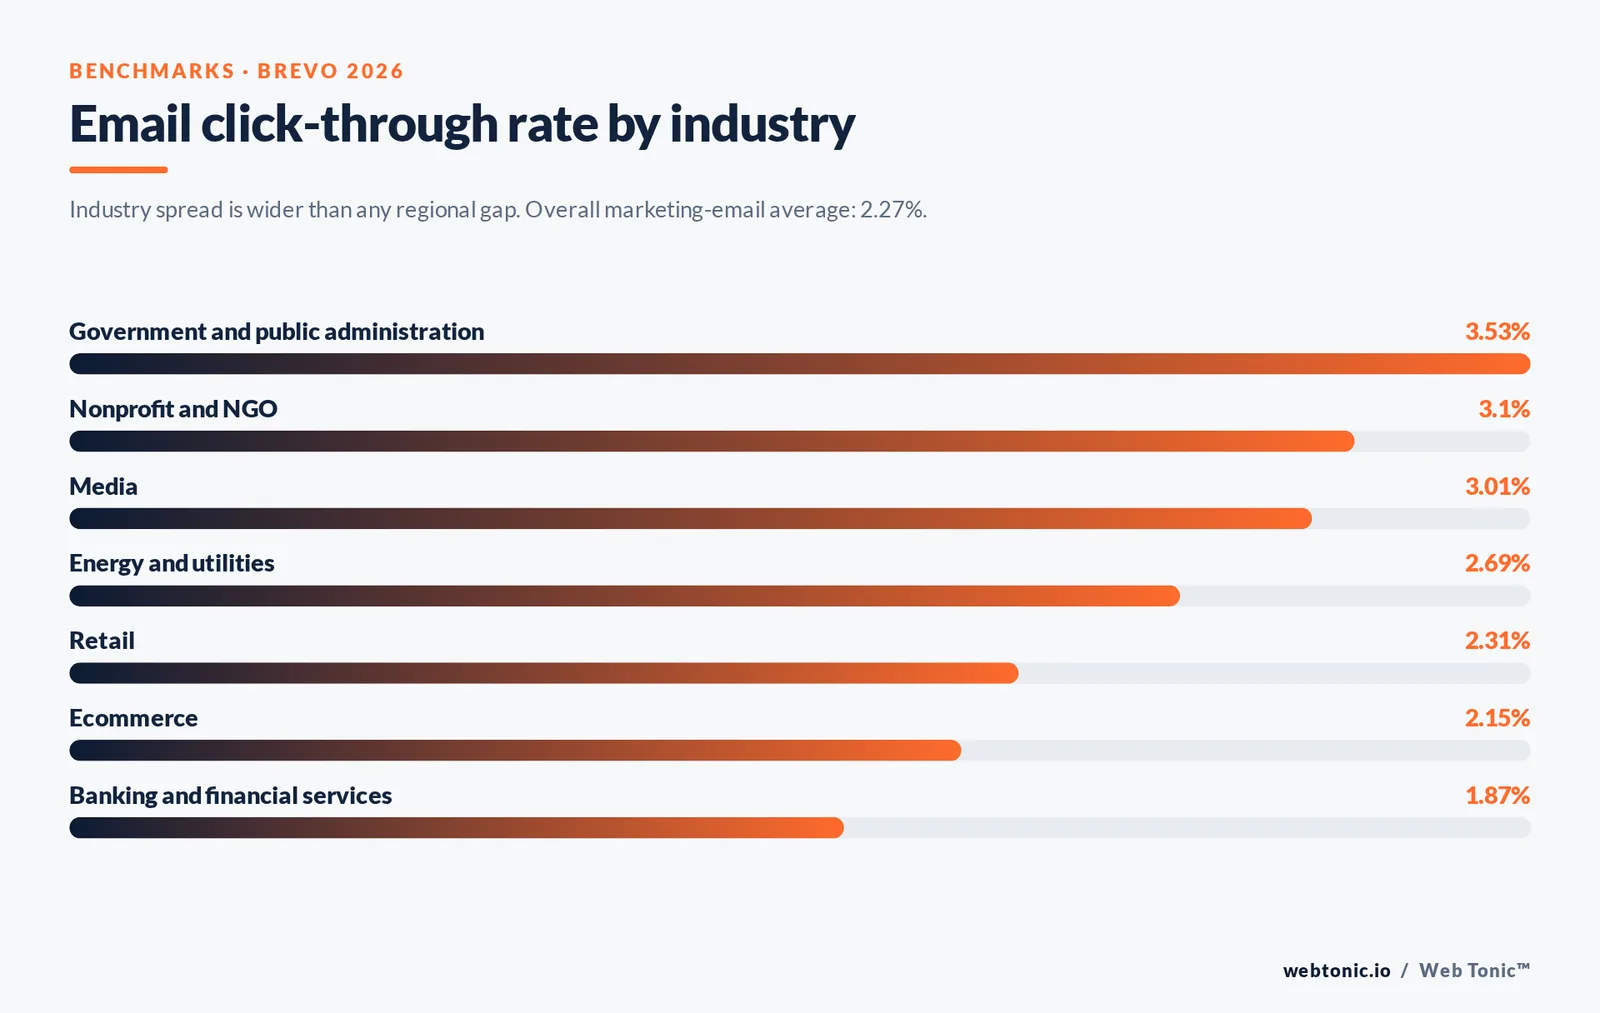
Industry spread inside email is wider than the gap between regions, which is the strongest argument against chasing a single average.
| Industry | Email CTR | Open rate | Unsubscribe rate |
|---|---|---|---|
| Government & public administration | 3.53% | 34.19% | 0.20% |
| Nonprofit & NGO | 3.10% | 27.03% | 0.30% |
| Media | 3.01% | 21.29% | 0.31% |
| Energy & utilities | 2.69% | 24.72% | 0.45% |
| Telecommunications | 2.53% | 21.49% | 0.35% |
| Education | 2.38% | 22.25% | 0.37% |
| Retail | 2.31% | 16.67% | 0.48% |
| Ecommerce | 2.15% | 15.50% | 0.46% |
| Marketing & advertising | 1.98% | 19.69% | 0.43% |
| Banking & financial services | 1.87% | 21.30% | 0.34% |
Two measurement caveats sit under those open rates. Apple's Mail Privacy Protection pre-fetches images, which inflates opens — the same dataset reports 33.87% opens when MPP activity is included versus 20.73% when it is stripped out. And deliverability sets the ceiling: 87.2% of Brevo-tracked mail reached the Gmail inbox versus 75.6% at Microsoft, so a CTR gap between audiences is sometimes a spam-folder gap. Work through the return-on-investment framing in Litmus's email marketing ROI research before you spend a quarter chasing 0.3 points of CTR.
Organic search: CTR is a function of position and SERP shape
Organic click rates are the steepest curve in marketing. The Advanced Web Ranking dataset reported by Search Engine Journal found the top result taking roughly 28% of clicks, position two 15% and position three 11%, with every position on page two under 1%.
Trap 2 — the SERP layout moves your CTR without you touching anything. When a knowledge panel renders, the same study saw first-position CTR drop from 28% to 16%. AI answers, local packs, shopping carousels and featured snippets all take clicks off the organic curve. Since Google holds roughly 90% of global search market share, its layout changes are effectively the whole market's CTR changes.
| SERP feature present | Effect on organic CTR | What to do about it |
|---|---|---|
| Knowledge panel | Position 1 drops from ~28% to ~16% | Target queries where you can own the entity, not just the page |
| Featured snippet | Snippet holder gains, positions 2–5 lose | Write a 40–60 word direct answer near the top |
| AI-generated answer | Fewer clicks distributed across all positions | Chase queries that need a decision, a tool or a quote |
| Local pack | Map results absorb commercial intent | Invest in the profile, not only the page |
| Four paid slots above the fold | Organic CTR compresses on commercial terms | Budget paid coverage for the money keywords |
What counts as a good CTR: bands and actions
A benchmark is only useful if it triggers a decision. Use this band table with your own channel figures instead of a single global target.
| Where you sit | Diagnosis | Action this week |
|---|---|---|
| Below 50% of channel average | Targeting or match-type problem, rarely a copy problem | Audit search terms and placements; add negatives |
| 50–90% of channel average | Creative relevance gap | Rewrite headlines to mirror the query and the offer |
| At channel average | Healthy but unremarkable | Test one structural variable, not five wording tweaks |
| 1.5–2x channel average | Strong relevance — verify it converts | Check conversion rate and CPA before scaling budget |
| 3x+ channel average, weak conversions | Clickbait or brand-term cannibalisation | Qualify the ad copy; add price or eligibility to filter clicks |
Rule 3 — a 40% CTR on 60 impressions is not a benchmark. Below a few thousand impressions the number is noise. Wait for volume or roll the segment up before you act on it.
The seven factors that move average CTR
When a CTR moves, it is almost always one of these. Fix them in order of leverage, not order of ease.
| Factor | Typical CTR swing | How to test it |
|---|---|---|
| Intent match between query and offer | Largest single lever, often 2x+ | Split high-intent and research queries into separate ad groups |
| Ad position or inbox placement | Position 1 to 3 halves organic CTR | Compare top vs absolute-top impression rate |
| Audience temperature | Retargeting runs 3–6x prospecting on display | Report prospecting and retargeting separately, always |
| Creative fatigue | 20–40% decay over 6–8 weeks on tight pools | Plot CTR against frequency, not against date |
| Offer clarity (price, guarantee, timing) | 10–30% | Add one concrete number to the headline |
| Device and placement mix | Mobile and in-app skew clicks, including accidental ones | Segment by device before drawing conclusions |
| Seasonality and competitive pressure | Visible on any Q4 retail account | Compare year-over-year, not month-over-month |
Nine ways to raise CTR without buying junk clicks
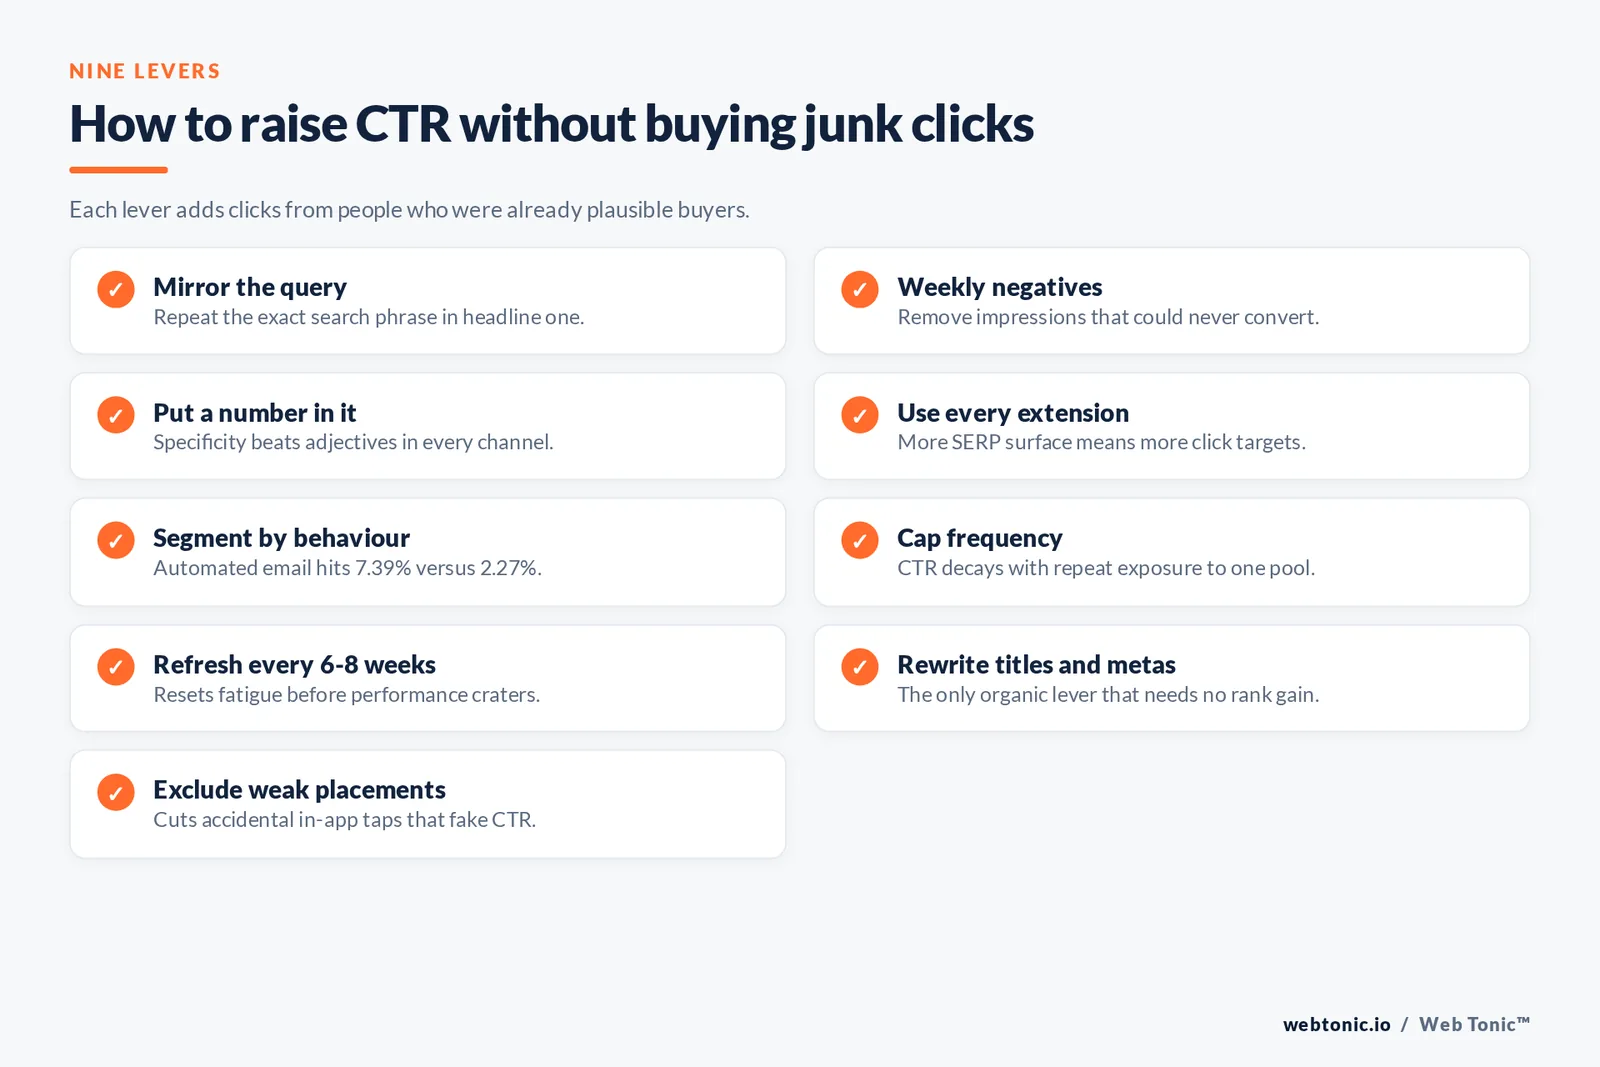
Every lever below raises clicks from people who were already plausible buyers. That distinction is what separates a CTR improvement from a wasted-spend increase.
| Lever | Channel | Effort | Why it works |
|---|---|---|---|
| Mirror the exact query in headline one | Paid search | Low | Relevance is the strongest documented CTR signal |
| Add negative keywords weekly | Paid search | Low | Removes impressions that could never click |
| Put a number in the creative | All | Low | Specificity outperforms adjectives |
| Use every available ad extension | Paid search | Medium | More surface area on the SERP, more click targets |
| Segment the email list by behaviour | Medium | Automated flows hit 7.39% versus 2.27% for broadcasts | |
| Cap frequency on retargeting | Display, social | Low | CTR decays with repeated exposure to the same pool |
| Refresh creative every 6–8 weeks | Display, social, video | Medium | Resets the fatigue curve before performance craters |
| Rewrite title tags and meta descriptions | Organic search | Medium | The only organic CTR lever that does not require ranking gains |
| Exclude apps and low-quality placements | Display | Medium | Removes accidental clicks that inflate CTR and waste budget |
Claims in the creative have to be defensible, not merely clickable — the FTC's advertising guidance for small businesses is the baseline for anything comparative or superlative. Our growth marketing team reviews CTR alongside cost per acquisition in every account, and the performance creative side handles the refresh cadence that keeps display and social CTR from decaying.
Four ways a higher CTR makes performance worse
Trap 4 — optimising CTR in isolation. These are the failure patterns worth naming out loud.
| Pattern | What you see | What is actually happening | Fix |
|---|---|---|---|
| Curiosity-gap copy | CTR up 60%, conversion rate down 50% | Clicks from unqualified readers | Put price, audience or eligibility in the ad |
| Brand-term rollup | Account CTR "improves" month over month | Branded spend grew as a share of the mix | Report brand and non-brand separately |
| In-app accidental clicks | Display CTR above 1%, bounce above 90% | Fat-finger taps on mobile app inventory | Exclude app categories and monitor bounce by placement |
| Narrow retargeting only | Excellent CTR, flat revenue | You are re-buying demand you already had | Fund prospecting and accept its lower CTR |
The honest reporting frame is a small stack, not a single metric: impressions, CTR, cost per click, conversion rate, CPA and revenue. Our data intelligence work builds that stack once so CTR stops being argued about in isolation, and there is more channel-level analysis across the Web Tonic blog.

FAQ
What is a good average CTR?
There is no universal figure. Aim for 4–6% or better on Google Search ads, above 2.27% on marketing email, above 0.5% on display retargeting, and treat anything on page two of Google as a ranking problem rather than a CTR problem. The only benchmark that fully applies to you is your own trailing 90 days in the same channel and industry.
How do you calculate CTR?
Divide clicks by impressions and multiply by 100. Google's example is exact: 5 clicks on 100 impressions equals a 5% CTR. For email, distinguish CTR (clicks ÷ delivered) from click-to-open rate (clicks ÷ opens), which typically runs 10–20% and removes non-openers from the denominator.
Why is display CTR so much lower than search CTR?
Because the impressions are not comparable. A search impression follows an active query; a display impression interrupts unrelated content, and users have learned to ignore anything that looks like an ad. WordStream's benchmark data shows search beating display on CTR, conversion rate and CPA simultaneously, with display's only advantage being a cheaper click.
Does CTR affect what I pay for ads?
Yes. Expected click-through rate is a component of ad quality, which feeds Ad Rank and therefore both eligibility and position in Google's auction. A persistently low CTR means worse placement for the same bid, so CTR is a cost lever and not only a performance report.
Can my CTR be too high?
It can be misleadingly high. A 3x-average CTR paired with weak conversion rates usually means the creative over-promises, the traffic is mostly branded, or accidental mobile taps are being counted. Always read CTR next to conversion rate and cost per acquisition before scaling anything.
Sources
Google Ads Help — Clickthrough rate (CTR): definition; About Ad Rank. WordStream — Average click-through rate reference and Google Ads benchmarks analysis. Brevo — 2026 Marketing Orchestration Benchmark (open rate, CTR, unsubscribe and deliverability figures by region and industry). Search Engine Journal — reporting on the Advanced Web Ranking organic CTR study. Nielsen Norman Group — banner blindness research. Socialinsider — 2026 social media benchmarks (70M posts). StatCounter Global Stats — search engine market share. IAB — new ad portfolio guidelines. Coalition for Better Ads — Better Ads Standards. Litmus — email marketing ROI. FTC — advertising FAQs for small business. All figures checked August 2026.