Table of contents
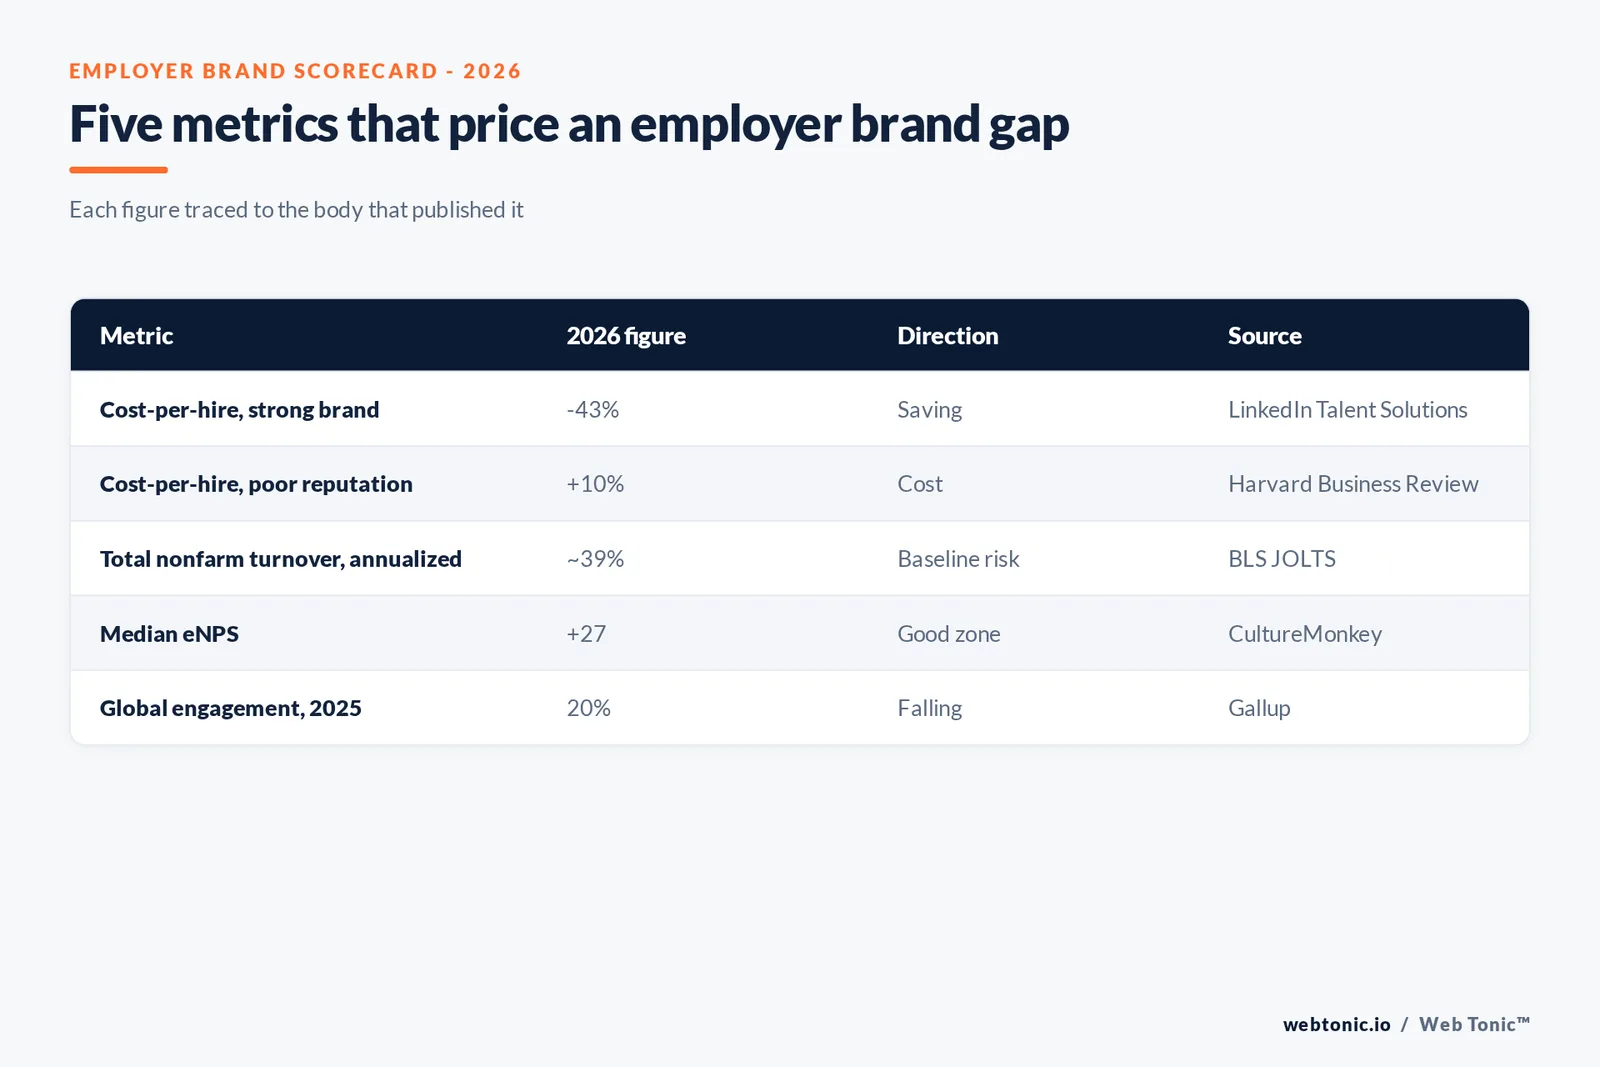
LinkedIn's own advertiser data shows a strong talent brand cuts cost-per-hire by 43% - and the turnover, replacement-cost and eNPS data below explains why that saving compounds every year rather than paying off once.
Key Takeaways
- Strong talent brands cut LinkedIn cost-per-hire by 43%.
- A poor reputation adds at least 10% to cost-per-hire.
- US total nonfarm separations ran 3.2% monthly in May 2026.
- That annualizes to roughly 39% total turnover.
- Arts, entertainment and recreation runs about 69% annualized turnover.
- Government runs about 17% annualized turnover.
- Replacing an employee costs 50% to 200% of annual salary.
- C-suite and specialist mis-hires can reach 213% of salary.
- US voluntary turnover costs the economy about USD 1 trillion a year.
- The median eNPS benchmark is +27 in Q2 2026.
- The top eNPS quartile clears +44.
- Energy leads industries on eNPS at +56.
- Education is lowest on eNPS at -24.
- Global employee engagement fell to 20% in 2025.
- That decline costs an estimated USD 10 trillion worldwide.
- Manager engagement fell from 31% to 22% since 2022.
- A 0.5-star Glassdoor rating gain lifts job clicks by 20%.
- The same gain lifts application starts by 16%.
- 86% of candidates research reviews before applying.
The headline business case: what employer brand saves on cost-per-hire
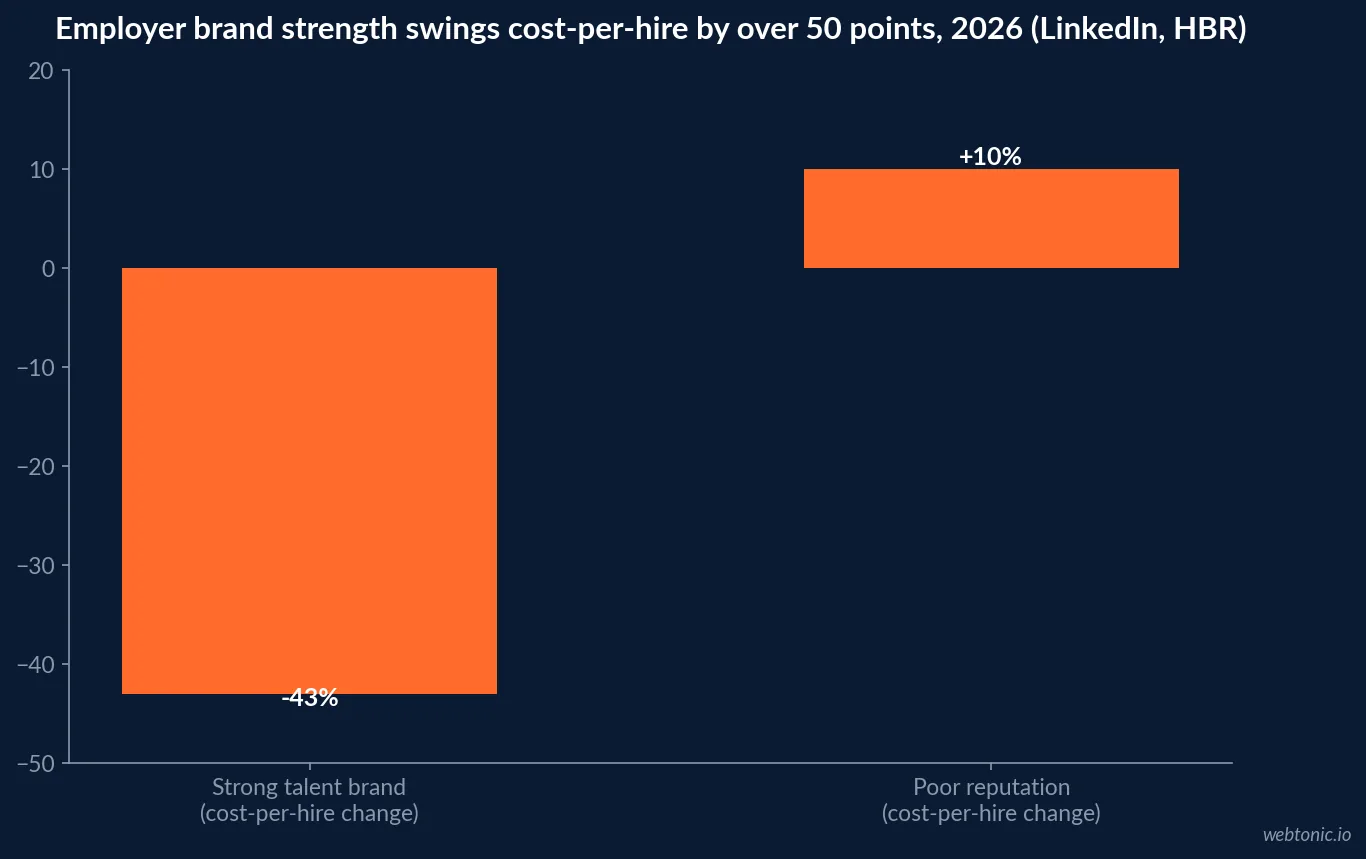
The number every employer brand business case leads with is cost-per-hire. LinkedIn's own analysis of its advertiser base compared customers with a strong Talent Brand Index against customers with a weak one and found the strong-brand group spends 43% less to make a hire on LinkedIn. The cost of getting it wrong is documented from an independent source: a 2016 Harvard Business Review analysis, still cited across current employer brand research, found a bad employer reputation costs a company at least 10% more per hire. Between a strong and a weak reputation, that is a swing of more than 50 percentage points on one recruiting line item alone.
A 2026 research playbook from Charter and Welcome to the Jungle adds a harder-to-fake data point: in a study of over 800 US workers evaluating 20 technology and finance companies from the Russell 1000, companies with more positive worker sentiment - including Salesforce, HP and Alphabet in the sample - showed stronger revenue growth and stock-market returns over a 10-year window, a correlation the researchers are careful to label correlation rather than proven causation.
| Employer brand metric | Figure | Source |
|---|---|---|
| Cost-per-hire reduction, strong talent brand | 43% | LinkedIn Talent Solutions |
| Cost-per-hire increase, poor reputation | at least 10% | Harvard Business Review, 2016 |
| 0.5-star Glassdoor rating gain -> job clicks | +20% | Glassdoor, via Pin 2026 study |
| 0.5-star Glassdoor rating gain -> application starts | +16% | Glassdoor, via Pin 2026 study |
Reviews now filter the funnel before a recruiter sees a resume
A 2026 study on the "Glassdoor Effect" reports that 86% of job seekers research a company's reviews and ratings before applying, citing Glassdoor's own US site survey, and finds the average candidate forms an opinion after reading about six reviews. The rating moves the funnel in both directions: a 0.5-star rating increase drives about 20% more job clicks and 16% more application starts, according to Glassdoor's data. Below three stars, the drop-off is severe enough that separate 2017 CareerArc research, still referenced in 2026 employer brand coverage, found only one in five candidates would apply to a one-star-rated company.
Turnover by industry: the range that decides where retention spend goes first
The US Bureau of Labor Statistics' JOLTS report for May 2026 puts the total nonfarm separations rate at 3.2% for the month, unchanged from April, on 5.1 million total separations including 3.1 million voluntary quits. Multiplying a rolling 12-month average monthly rate by 12 gives a rough annualized comparison tool across industries - not an exact probability any one employee leaves within a year, but a workable benchmark for planning.
The spread across sectors is wide. Industries with high customer-facing, hourly staffing - arts/entertainment/recreation and accommodation/food services - run annualized separations near 69% and 67% respectively, while government, with its longer tenure norms, runs closer to 17%. That is a more than fourfold difference in how often an organization has to rebuild its workforce, and it is the single biggest driver of how large an employer branding budget is defensible.
| Industry (12-mo avg through May 2026) | Monthly separations rate | Rough annualized rate | Source |
|---|---|---|---|
| Arts, entertainment, recreation | 5.76% | ~69% | BLS JOLTS |
| Accommodation and food services | 5.59% | ~67% | BLS JOLTS |
| Professional and business services | 4.48% | ~54% | BLS JOLTS |
| Retail trade | 3.85% | ~46% | BLS JOLTS |
| Total nonfarm (all industries) | 3.27% | ~39% | BLS JOLTS |
| Government | 1.44% | ~17% | BLS JOLTS |
What one departure actually costs
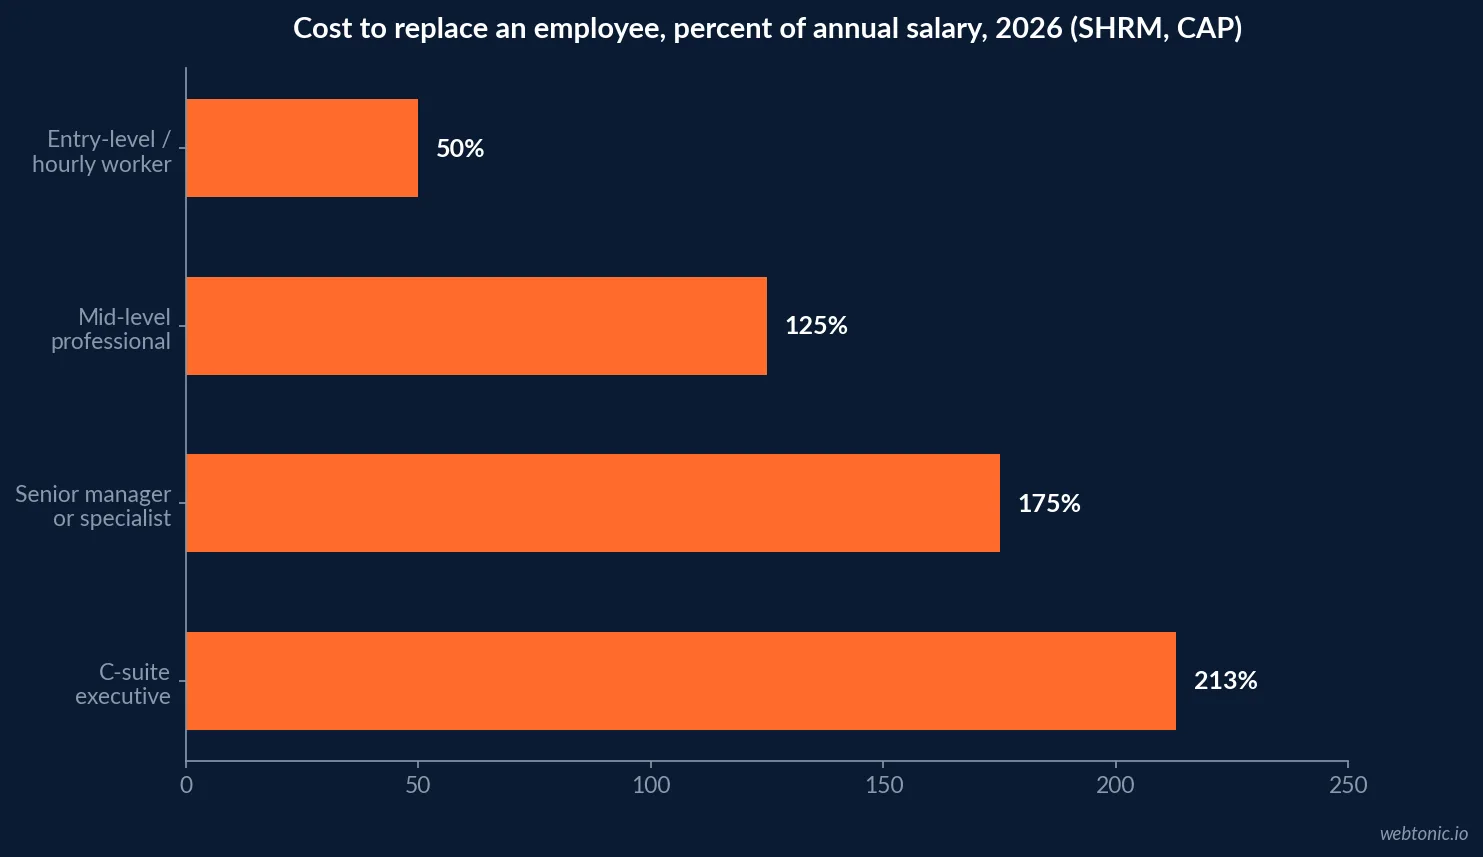
SHRM's benchmarking research, cited across HR industry reporting, puts the cost of replacing a single employee at 50% to 200% of that employee's annual salary, depending heavily on role complexity and seniority. At the top end, the Center for American Progress has documented cases of C-suite and highly specialized mis-hires reaching 213% of salary once search fees, onboarding time and lost productivity during the vacancy are included.
Scaled to the whole economy, Gallup's State of the Global Workplace research puts the cost of voluntary turnover in the United States at roughly USD 1 trillion a year, a figure that accounts for both direct replacement spend and the productivity drag of operating understaffed while a role sits vacant.
| Role type | Estimated replacement cost | Source |
|---|---|---|
| Entry-level or hourly worker | ~50% of annual salary | SHRM |
| Mid-level professional | 100-150% of annual salary | SHRM |
| Senior manager or specialist | 150-200% of annual salary | SHRM |
| C-suite executive | up to 213% of annual salary | Center for American Progress |
eNPS: the retention-side metric employer brand programs still under-track
While cost-per-hire measures the recruiting funnel, employee Net Promoter Score measures whether the people already inside the organization would recommend working there. CultureMonkey's Q2 2026 benchmark puts the median eNPS at +27 on the -100 to +100 scale, squarely in the "good" zone (10 to 30), with the top quartile clearing +44. Industry variation is dramatic: Energy leads at +56 (excellent zone), while Education sits at -24, meaning detractors outnumber promoters in that sector.
Regionally, APAC leads at +32 and Europe trails at +7, and by company size, mid-market organizations (500-2,000 employees) lead at +30 while micro companies under 100 employees trail at +19 - evidence that eNPS benchmarking needs a same-size, same-region comparison to mean anything.
| eNPS segment, Q2 2026 | Score (-100 to +100) | Zone | Source |
|---|---|---|---|
| Energy (highest industry) | +56 | Excellent | CultureMonkey |
| All benchmark companies, median | +27 | Good | CultureMonkey |
| Top quartile, all companies | +44 | Strong/Excellent | CultureMonkey |
| Education (lowest industry) | -24 | Detractor-heavy | CultureMonkey |
| APAC (leading region) | +32 | Strong | CultureMonkey |
| Europe (lowest region) | +7 | Neutral | CultureMonkey |
The engagement backdrop is getting worse, not better
Gallup's State of the Global Workplace 2026 report finds global employee engagement fell to 20% in 2025, the lowest level since 2020 and a second consecutive annual decline, costing the world economy an estimated USD 10 trillion in lost productivity. The decline is not evenly distributed: manager engagement fell from 31% in 2022 to 22% in 2025, a steeper drop than the roughly flat trend among individual contributors (20% to 19%), meaning the group most responsible for translating employer brand promises into daily experience is itself the most disengaged.
Glassdoor's own research, cited in the 2026 Charter and Welcome to the Jungle employer brand analysis, identifies culture, senior leadership and career opportunities as the three most important workplace factors for employee satisfaction - and notes those three factors have stayed broadly stable since before the pandemic, meaning the fix is not novel, just consistently underfunded.
| Engagement metric, 2025-26 | Figure | Source |
|---|---|---|
| Global employee engagement, 2025 | 20% | Gallup State of the Global Workplace 2026 |
| Global cost of low engagement | USD 10 trillion | Gallup State of the Global Workplace 2026 |
| Manager engagement, 2022 | 31% | Gallup State of the Global Workplace 2026 |
| Manager engagement, 2025 | 22% | Gallup State of the Global Workplace 2026 |
| Individual contributor engagement, 2022 to 2025 | 20% to 19% | Gallup State of the Global Workplace 2026 |
Where recruiting spend concentrates against a tight labor market
SHRM's 2026 Recruiting Executives Benchmarking data, drawn from over 4,600 organizations, finds executive cost-per-hire increasing substantially in 2026 while non-executive cost-per-hire stayed relatively stable - a divergence that tracks with more than 2 in 3 organizations reporting active struggles filling open positions this year. That gap is exactly where the 43% employer-brand saving documented above matters most: applied to an executive search that already costs far more than an hourly role, the same percentage saving is a materially larger dollar amount than it would be on entry-level hiring.
The Charter and Welcome to the Jungle playbook adds a tracking framework worth copying: connecting a campaign through website visit, application and successful hire, then costing each stage of that funnel, is the only way to separate employer-brand effect from market conditions. Teams that track only applications and blended cost-per-hire cannot make that separation.
Most organizations invest but can't prove it worked
The measurement gap behind these benchmarks is well documented. A 2025 Conference Board report, still the reference study cited into 2026 planning cycles, finds 78% of surveyed organizations invest in employer branding, with 87% citing attracting top talent as the reason and only 6% citing cost-of-hire reduction directly. Yet just 18% of those organizations say they can clearly communicate the ROI of that investment to their own leadership - meaning most of the spend behind the cost-per-hire and turnover numbers on this page is happening without the internal case this article is built to support.
Budget commitment itself is stable rather than growing: 49% of investing organizations plan to hold spend flat into the next cycle, 23% plan to increase it, and 15% plan to cut it - a distribution that rewards teams who can show the ROI case, since flat-budget environments fund the programs that can prove their number.
| Employer brand investment, Conference Board | Figure | Source |
|---|---|---|
| Organizations investing in employer branding | 78% | The Conference Board, 2025 |
| Citing talent attraction as the reason | 87% | The Conference Board, 2025 |
| Citing cost-of-hire reduction as the reason | 6% | The Conference Board, 2025 |
| Able to clearly communicate ROI | 18% | The Conference Board, 2025 |
| Planning flat budget into next cycle | 49% | The Conference Board, 2025 |
AI search is now part of the candidate journey too
A 2026 Built In survey of 162 talent acquisition and HR leaders, 93% of them at North American mid-to-large organizations, finds 91% say AI tools now significantly influence how candidates discover and evaluate employers. Only 33% believe their own employer brand is accurately reflected in AI-generated results, and 73% are actively worried those tools are surfacing outdated or inaccurate information. The same survey finds AI search tends to prioritize third-party sources, employee reviews and community content over a company's own career pages - which means the Glassdoor and review-site data earlier on this page now double as inputs to how AI describes an employer, not just how human candidates see it.
Putting the benchmarks to work
The pattern across every figure on this page is the same: the industries and companies with the worst turnover, the lowest eNPS and the weakest engagement are also the ones with the most to gain from closing the cost-per-hire gap LinkedIn's own data documents. Benchmark your own turnover against the BLS industry table above, your own eNPS against CultureMonkey's median, and treat any gap as the size of the employer-brand investment case, not a fixed cost of doing business.
Our growth marketing team and creative practice build the employer brand campaigns this data points to, and our overview of how Web Tonic approaches brand work is a useful next read. Talk to us if your recruiting funnel looks like the "poor reputation" column above rather than the "strong brand" one.
Frequently Asked Questions
How much does a strong employer brand actually save on hiring?
LinkedIn's own analysis of its advertiser base, comparing customers with a strong Talent Brand Index against those with a weak one, finds strong-brand customers spend 43% less to make a hire on LinkedIn. The inverse cost is also documented from a different source: Harvard Business Review's 2016 analysis, still cited across 2026 employer brand research, found a poor employer reputation adds at least 10% to cost-per-hire. Between a strong and a weak reputation, that is a swing of over 50 percentage points on one recruiting line item.
What is the average employee turnover rate in 2026?
The US Bureau of Labor Statistics' JOLTS data puts the total nonfarm separations rate at 3.2% for May 2026, which annualizes to roughly 39%. That average hides very wide variation by sector: arts, entertainment and recreation runs close to 5.76% monthly (about 69% annualized), while government runs under 1.5% monthly (about 17% annualized) - a more than fourfold gap between the highest and lowest turnover industries.
How much does it cost to replace an employee?
SHRM's benchmarking puts the range at 50% to 200% of the departing employee's annual salary depending on role complexity and seniority, with the Center for American Progress documenting cases up to 213% of salary for C-suite and highly specialized roles. Separately, Gallup's State of the Global Workplace research puts the cost of voluntary turnover across the entire US economy at roughly USD 1 trillion a year, once lost productivity during the vacancy is added to direct replacement cost.
What counts as a good eNPS score in 2026?
CultureMonkey's Q2 2026 benchmark, covering a wide industry sample, puts the median employee Net Promoter Score at +27 on the -100 to +100 scale, which sits in the 'good' zone (10 to 30). The top quartile clears +44. Scores vary enormously by industry - Energy leads at +56 while Education runs negative at -24, so an employer should benchmark against its own sector median rather than the cross-industry figure.
Is employee engagement actually improving or declining in 2026?
Declining. Gallup's State of the Global Workplace 2026 report finds global employee engagement fell to 20% in 2025, its lowest level since 2020 and a second consecutive annual drop, at an estimated cost of USD 10 trillion in lost productivity worldwide. The decline is concentrated among managers, whose engagement fell from 31% in 2022 to 22% in 2025, a steeper drop than the roughly flat trend among individual contributors.
Sources
LinkedIn Talent Solutions - LinkedIn Data Proves the Impact of a Strong Talent Brand
Harvard Business Review - A Bad Reputation Costs a Company at Least 10% More Per Hire
Pin - The Glassdoor Effect 2026: How Employer Reviews Drive Drop-Off
Charter and Welcome to the Jungle - Employer Branding ROI: What the Data Actually Says in 2026
US Bureau of Labor Statistics - Job Openings and Labor Turnover, May 2026
SHRM - 2026 Recruiting Executives Benchmarking: Attracting Critical Talent
Gallup - State of the Global Workplace 2026
CultureMonkey - eNPS Benchmarks 2026
The Conference Board - Show Me the ROI: Only 18% of Companies Communicate Impact of Employer Branding
Built In for Employers - 2026 State of Employer Reputation and Visibility