Table of contents

A new business faces a 22.1% chance of closing within its first year, per US Bureau of Labor Statistics cohort data, and that single number sits at the center of nearly every other figure a founder needs before starting, funding or scaling a company in 2026.
Key Takeaways
- US business applications were 531,728 in August 2026 alone.
- Only 28,501 of those are projected to become payroll businesses.
- 22.1% of new establishments fail within their first year.
- 77.9% survive to their first anniversary.
- 48.6% fail within five years.
- 65.3% fail within ten years.
- There are 36.2 million small businesses in the US.
- Small businesses are 99.9% of all US businesses.
- Small businesses employ 62.3 million people.
- That is 45.9% of the private-sector workforce.
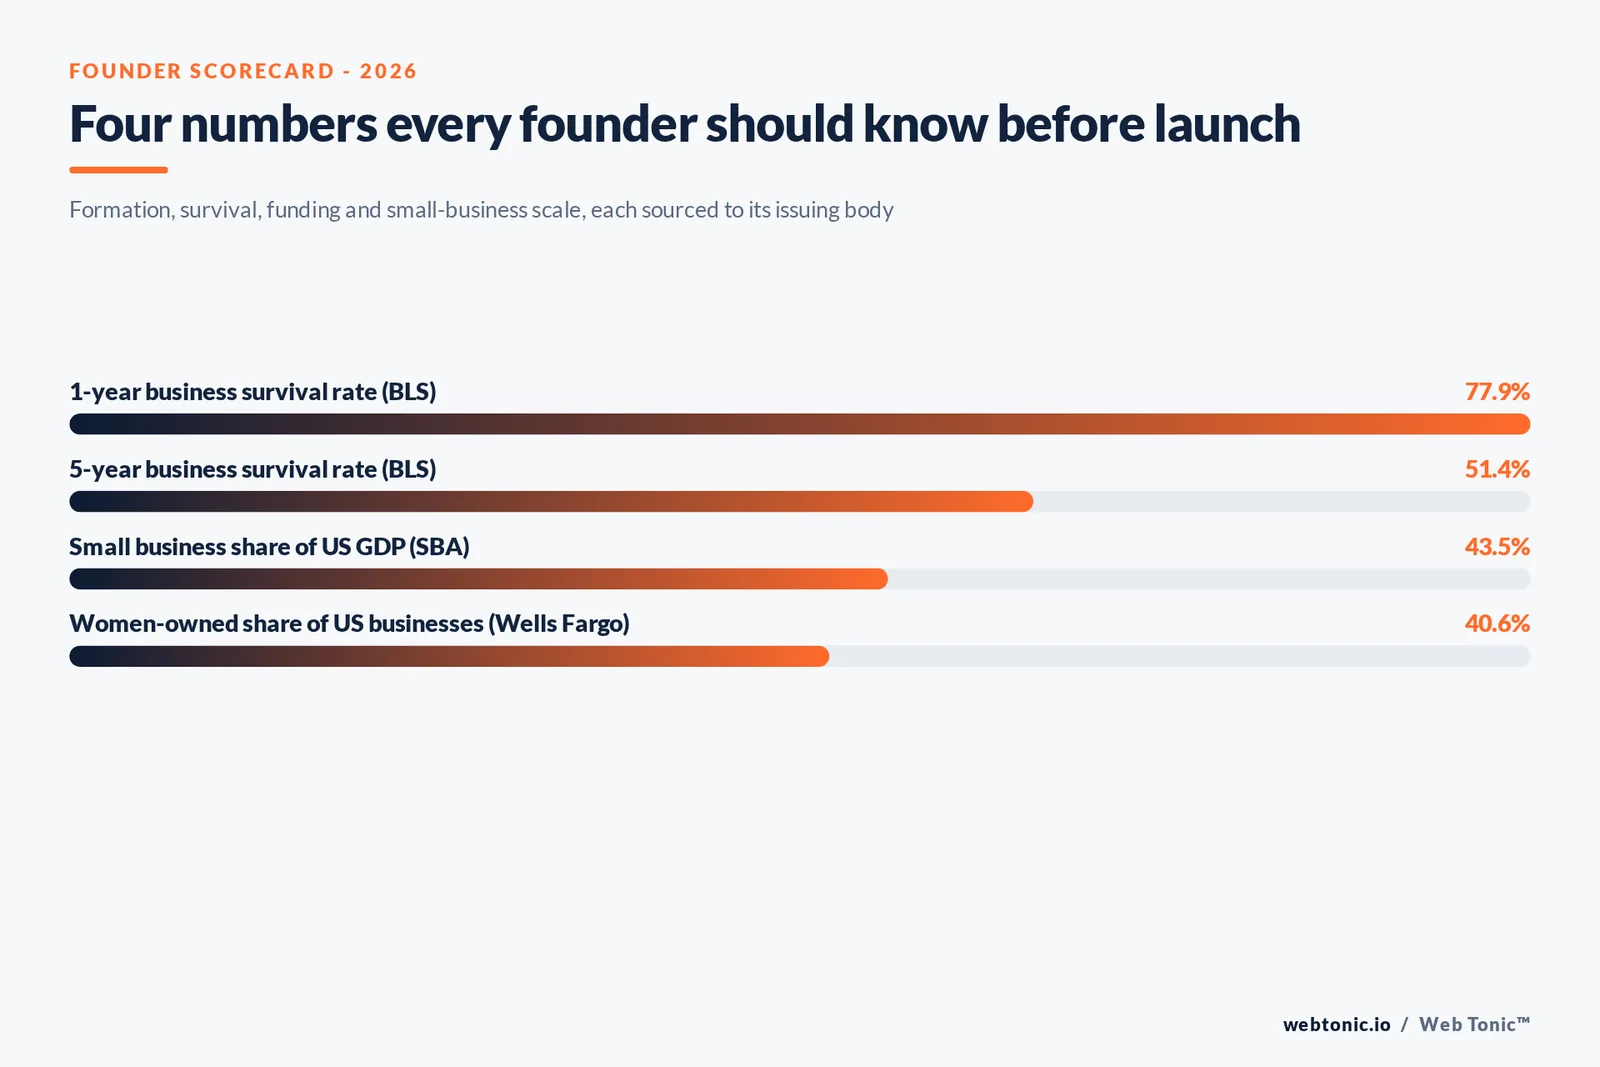
- Small businesses generate 43.5% of US GDP.
- 82.3% of small businesses have no employees.
- Global VC investment hit USD 227.4 billion in Q2 2026.
- A single AI raise reached USD 65 billion in the same quarter.
- Women own 15.7 million US businesses, 40.6% of the total.
- Women-owned businesses generate USD 2.8 trillion in revenue.
- That is just 9.1% of total US business revenue.
- US business applications fell 7.8% month over month in August 2026.
How many businesses are actually starting right now
The US Census Bureau's Business Formation Statistics release for August 2026 reports 531,728 seasonally adjusted business applications, down 7.8% from July 2026. Applications are the leading indicator, not the outcome: the Bureau's own model projects only 28,501 of that month's applications will become actual business formations with payroll tax liability within four quarters, a 4.6% decrease from the July projection.
The gap between 531,728 applications and 28,501 projected payroll formations is not a measurement error - most applications are sole proprietorships, side businesses, or entities that never hire, and the Bureau's projection isolates the subset expected to become employer businesses specifically.
| Business formation metric, August 2026 | Figure | Month-over-month change | Source |
|---|---|---|---|
| Business applications, seasonally adjusted | 531,728 | -7.8% | US Census Bureau BFS |
| Projected business formations (payroll, 4-quarter) | 28,501 | -4.6% | US Census Bureau BFS |
The real survival curve, cohort by cohort
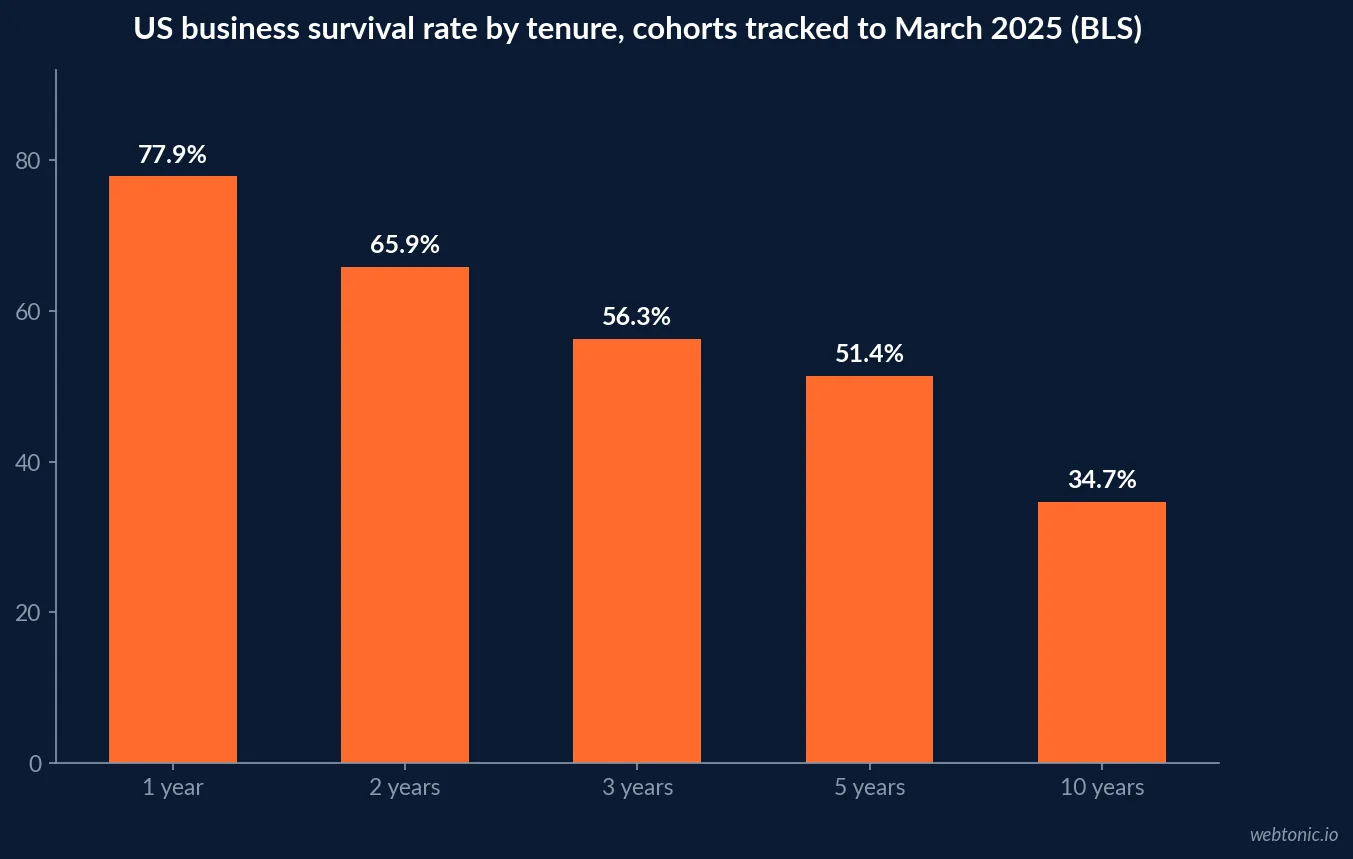
The US Bureau of Labor Statistics' Business Employment Dynamics program runs the only continuous, census-grade record of American business survival, tracking every private-sector establishment born in a given year through to March 2025. The headline figures: 22.1% of establishments fail within their first year, rising to 34.1% at two years, 43.7% at three years, 48.6% at five years and 65.3% at ten years.
The shape of that curve matters more than any single number: the failure rate roughly doubles from year one to year two, then decelerates meaningfully - the jump from five to ten years is 16.7 percentage points over five years, against a 12 percentage-point jump in the first two years alone. A business that survives its first 24 months has cleared the steepest part of the curve.
| Tenure (birth cohort tracked to March 2025) | Survival rate | Failure rate | Source |
|---|---|---|---|
| 1 year | 77.9% | 22.1% | BLS Business Employment Dynamics, Table 7 |
| 2 years | 65.9% | 34.1% | BLS Business Employment Dynamics, Table 7 |
| 3 years | 56.3% | 43.7% | BLS Business Employment Dynamics, Table 7 |
| 5 years | 51.4% | 48.6% | BLS Business Employment Dynamics, Table 7 |
| 6 years | 46.8% | 53.2% | BLS Business Employment Dynamics, Table 7 |
| 10 years | 34.7% | 65.3% | BLS Business Employment Dynamics, Table 7 |
The small business economy those founders are joining
The SBA Office of Advocacy's February 2026 report counts 36,207,130 small businesses in the United States, representing 99.9% of all US businesses against just 21,041 large businesses. Of those small businesses, 82.3% (29.8 million) are nonemployer firms with no paid staff, and 17.7% (6.4 million) carry employees - the nonemployer count has nearly doubled since 1997, when it stood at 15.4 million.
Collectively, small businesses employ 62.3 million people, or 45.9% of the private-sector workforce, and generate 43.5% of US GDP - meaning the sector most founders are entering is not a marginal part of the economy but close to half of both its jobs and its output.
| US small business metric, 2026 | Figure | Source |
|---|---|---|
| Total small businesses | 36,207,130 | SBA Office of Advocacy |
| Share of all US businesses | 99.9% | SBA Office of Advocacy |
| Nonemployer firms (no paid staff) | 82.3% | SBA Office of Advocacy |
| Employer firms | 17.7% | SBA Office of Advocacy |
| Small business employees | 62.3 million (45.9% of private sector) | SBA Office of Advocacy |
| Small business share of GDP | 43.5% | SBA Office of Advocacy |
Funding is real, but concentrated in a handful of megadeals
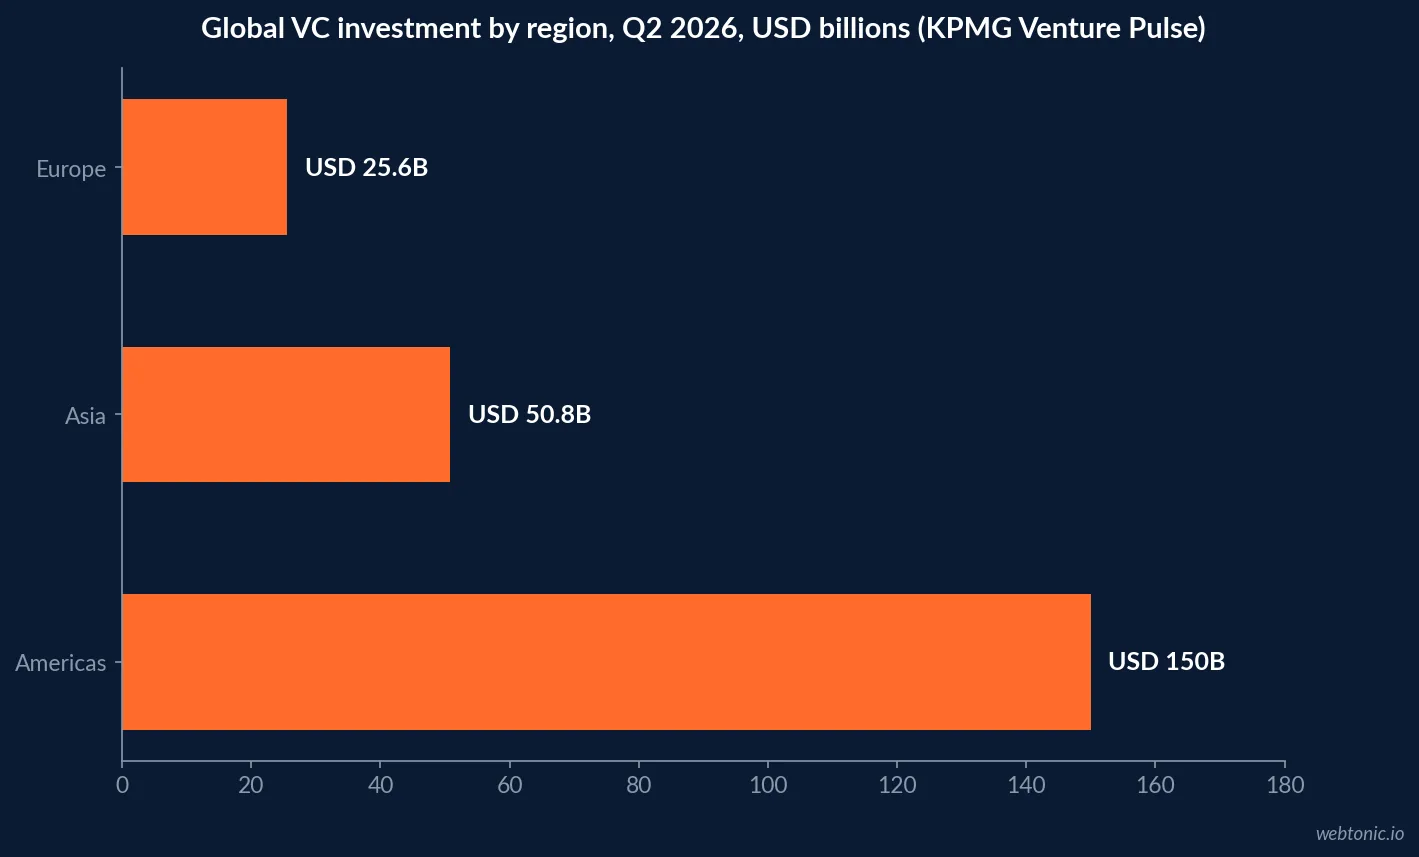
KPMG's Venture Pulse Q2 2026 report puts global VC investment at USD 227.4 billion across 8,440 deals for the quarter - the second highest quarterly total ever, though down from Q1 2026's record USD 332.9 billion. The scale of concentration at the top is striking: a single USD 65 billion raise by Anthropic in Q2 2026 is larger than the entire European VC market for the same period (USD 25.6 billion), and the Americas alone captured USD 150 billion across just 3,999 deals.
For a founder outside the AI infrastructure sector specifically, these totals describe a market whose headline number is shaped by a small number of very large rounds rather than typical seed or Series A fundraising conditions - a distinction worth making explicitly before benchmarking any single raise against the quarterly aggregate.
| VC funding, Q2 2026 | Figure | Source |
|---|---|---|
| Global VC investment | USD 227.4 billion | KPMG Venture Pulse Q2 2026 |
| Global VC deal count | 8,440 deals | KPMG Venture Pulse Q2 2026 |
| Americas VC investment | USD 150 billion | KPMG Venture Pulse Q2 2026 |
| Europe VC investment | USD 25.6 billion | KPMG Venture Pulse Q2 2026 |
| Largest single raise (Anthropic) | USD 65 billion | KPMG Venture Pulse Q2 2026 |
| Prior quarter record (Q1 2026) | USD 332.9 billion | KPMG Venture Pulse Q2 2026 |
Who is founding: the women-owned business gap
The Wells Fargo 2026 Impact of Women-Owned Businesses report finds women own 15.7 million US businesses, or 40.6% of all US businesses, employing 12.6 million people and generating USD 2.8 trillion in revenue. The gap the report itself highlights: that USD 2.8 trillion is only 9.1% of total US business revenue, meaning women's share of business count runs roughly four and a half times ahead of women's share of business revenue - most women-owned businesses are smaller by revenue than the overall business population.
The report attributes part of the post-pandemic surge in women's entrepreneurship to remote work and generative AI lowering the barrier to starting a nonemployer business, the same category that makes up 82.3% of all US small businesses in the SBA data above.
| Women-owned business metric, 2026 | Figure | Source |
|---|---|---|
| Women-owned businesses | 15.7 million (40.6% of all US businesses) | Wells Fargo IWOB Report 2026 |
| People employed | 12.6 million | Wells Fargo IWOB Report 2026 |
| Revenue generated | USD 2.8 trillion | Wells Fargo IWOB Report 2026 |
| Share of total US business revenue | 9.1% | Wells Fargo IWOB Report 2026 |
Who is actually starting these businesses now
A 2026 Gusto survey of 1,051 founders who started a business in 2025 finds a generational shift alongside the funding one: for the first time, Gen Z entrepreneurs started more businesses than Baby Boomers, accounting for 9% of new business starts against 5% for Boomers. AI adoption tracks the same generational split - 71% of Gen Z founders used AI to help launch their business, against 42% of Baby Boomer founders, and Gen Z founders were roughly five times more likely to say they likely would not have started the business at all without AI.
Financing patterns held closer to historical norms: 78% of new business owners in the Gusto survey needed some form of startup financing in 2025, with personal savings remaining the most common source - a reminder that the venture totals in the previous section describe a small, visible slice of how most new businesses are actually capitalized.
NBER research on immigrant entrepreneurship adds a demographic finding worth citing alongside the age data: immigrants account for roughly a quarter of new employer businesses in the US despite being a smaller share of the working-age population, and immigrant-founded firms show a higher propensity to patent and innovate that is only partly explained by education levels.
| Founder demographics, 2025-26 | Figure | Source |
|---|---|---|
| Gen Z share of new business starts, 2025 | 9% | Gusto 2026 New Business Formation Report |
| Baby Boomer share of new business starts, 2025 | 5% | Gusto 2026 New Business Formation Report |
| Gen Z founders who used AI to launch | 71% | Gusto 2026 New Business Formation Report |
| Baby Boomer founders who used AI to launch | 42% | Gusto 2026 New Business Formation Report |
| New owners needing startup financing | 78% | Gusto 2026 New Business Formation Report |
| Immigrant share of new US employer businesses | ~25% | NBER |
Are people starting businesses by choice or by necessity
The Ewing Marion Kauffman Foundation's 2025 National Report on Early-Stage Entrepreneurship, published May 2026, tracks the "opportunity share" of new entrepreneurs - the percentage who started a business to pursue an opportunity rather than out of necessity. That share rose to 83.3% in 2025, up from a pandemic low of 69.8% in 2020, but still below the 86.9% pre-pandemic level recorded in 2019. The rate of new entrepreneurs itself - 0.36%, meaning roughly 360 out of every 100,000 adults became new entrepreneurs in a given month in 2025 - also increased year over year and remains above pre-pandemic levels.
The report's own historical comparison is telling: the 2019-to-2020 pandemic shock cut the opportunity share by 17.1 percentage points in a single year, more than double the 6.9 percentage-point decline recorded during the 2008-2009 Great Recession - evidence that the 2020 disruption pushed a larger share of people into necessity-driven entrepreneurship than the last major recession did.
Reading the formation and survival numbers together
Put the Census and BLS data side by side and a specific planning window emerges: hundreds of thousands of applications are filed every month, roughly a fifth of the businesses that actually form from that pool will not see a second year, and the businesses that make it past year two face a much flatter risk curve for the rest of the decade. That structure - a steep early cliff followed by a long plateau - should shape how a founder sequences funding asks, hiring and marketing spend: heavy investment in the first 24 months needs to be defensible against a genuinely higher failure rate than investment made in year three or beyond.
Where the venture and small-business tracks diverge
The KPMG and SBA data above describe two different populations that get conflated in casual "entrepreneurship" conversation. Venture-backed founders are a tiny fraction of the 36.2 million small businesses counted by the SBA, concentrated in the AI, biotech and fintech sectors KPMG's report highlights, while the vast majority of the 82.3% nonemployer businesses will never raise a venture round and were never trying to. Benchmarking a bootstrapped service business against megadeal-driven VC totals, or a Series A software company against nonemployer survival curves, both produce the wrong read on risk.
What this means for planning a launch
The data above supports a specific sequencing: treat the first 24 months as the highest-risk window the BLS curve describes, size any funding ask against the realistic Q2 2026 environment KPMG documents rather than its megadeal-skewed headline total, and benchmark growth spend against the 45.9%-of-workforce, 43.5%-of-GDP small business economy the SBA counts, not against venture media coverage. Our growth marketing practice and data and analytics team build that early-stage instrumentation, and our guide on building a Google Ads strategy is a practical next step once the first survival milestones are behind you. Talk to us if you are past the launch window and ready to scale acquisition.
Frequently Asked Questions
How many new businesses are started each year in the US?
The Census Bureau's Business Formation Statistics reported 531,728 seasonally adjusted business applications in August 2026 alone. Not every application becomes an operating business with payroll: the Bureau's own projection model expects 28,501 of that month's applications to become actual business formations with payroll tax liability within four quarters - a useful reminder that the widely quoted applications number and the number of businesses that actually open are two different figures.
What percentage of new businesses fail in the first year?
22.1%, according to the US Bureau of Labor Statistics' Business Employment Dynamics data, which tracks every private-sector establishment born in a given year through to March 2025. That means roughly 77.9% of businesses born in the year ending March 2024 were still operating twelve months later. The failure rate then climbs to 34.1% at two years, 48.6% at five years and 65.3% at ten years - a curve that flattens meaningfully after the first few years rather than continuing to climb at the same rate.
How many small businesses are there in the United States?
36,207,130, according to the SBA Office of Advocacy's 2026 report on the small business economy. Small businesses make up 99.9% of all US businesses, employ 62.3 million people (45.9% of the private-sector workforce), and contribute 43.5% of GDP. Of those, 82.3% are nonemployer firms with no paid staff, and 17.7% carry employees.
Is venture funding concentrated in a small number of deals in 2026?
Yes, heavily. KPMG's Venture Pulse Q2 2026 report puts global VC investment at USD 227.4 billion across 8,440 deals for the quarter, but a handful of megadeals dominate the total - a single USD 65 billion raise by Anthropic in the quarter is larger than the entire European VC market for the same period (USD 25.6 billion). For most founders, the headline VC totals describe a market shaped by a small number of very large AI-sector rounds, not the typical fundraising experience.
How much of US business ownership is women-owned?
Women own 15.7 million businesses, or 40.6% of all US businesses, according to the Wells Fargo Impact of Women-Owned Businesses 2026 report. Those businesses employ 12.6 million people and generate USD 2.8 trillion in revenue - but that revenue represents just 9.1% of total US business revenue, meaning women's share of business count is far ahead of women's share of business revenue.
Sources
US Census Bureau - Business Formation Statistics, August 2026
US Bureau of Labor Statistics - Establishment Age and Survival Data
SBA Office of Advocacy - Frequently Asked Questions About Small Business, February 2026
KPMG - Venture Pulse Q2 2026
Wells Fargo - The Impact of Women-Owned Businesses 2026 Report
Gusto - 2026 New Business Formation Report
NBER - Immigrant Entrepreneurship: New Estimates and a Research Agenda
Ewing Marion Kauffman Foundation - National Report on Early-Stage Entrepreneurship 2025