Table of contents
Conversion rate optimization (CRO) is the practice of increasing the share of website visitors who complete a desired action — buy, book, subscribe, call — without buying more traffic. It is the cheapest growth lever most marketing teams own, and in 2026 it is also the most urgent: conversion rates fell 5.1% year on year across measured sites.
Key Takeaways
- The median landing page conversion rate across industries is 6.6%, but the range runs from 3.8% to 12.3% depending on sector, so a single "good" number does not exist.
- Conversion rates dropped 5.1% in the last year while average order value rose 6% — revenue is holding on spend per customer, not on more customers.
- Email is the highest-converting traffic channel at 19.3%, converting 77% better than paid search visitors.
- 83% of landing page visits happen on mobile, yet mobile converts 8% worse than desktop — the biggest single-fix opportunity in most accounts.
- 17% of US shoppers abandon an order because checkout is too long or complicated, and most checkouts can cut 20–60% of their form fields.
- Readability is a conversion variable: difficult words correlate with conversion at −24.3%, a correlation 62% stronger than in 2020.
What conversion rate optimization means in marketing
A conversion rate is one number: conversions divided by total visitors, multiplied by 100. If 2,000 website visitors produce 60 purchases, the conversion rate is 3%. Conversion rate optimization is the structured, evidence-led process of raising that percentage by changing what visitors see, read and are asked to do — not by changing how many arrive.
That distinction matters commercially. Doubling traffic usually doubles media cost. Moving a landing page from 1% to 2% is a 100% performance increase at zero extra media spend, as Unbounce's benchmark analysis puts it. CRO is therefore a margin exercise as much as a marketing one, which is why it sits inside data intelligence work rather than in creative alone.
Two vocabulary points prevent most confusion. A macro conversion is the commercial outcome (purchase, qualified lead). A micro conversion is a step towards it (add to cart, video watched to 75%, pricing page viewed). Optimizing only macro conversions gives you too little data to test; optimizing only micro conversions produces pages that feel busy and sell nothing. Mature CRO programs track both, as Optimizely's definition and VWO's CRO framework both stress.
What a good conversion rate looks like in 2026
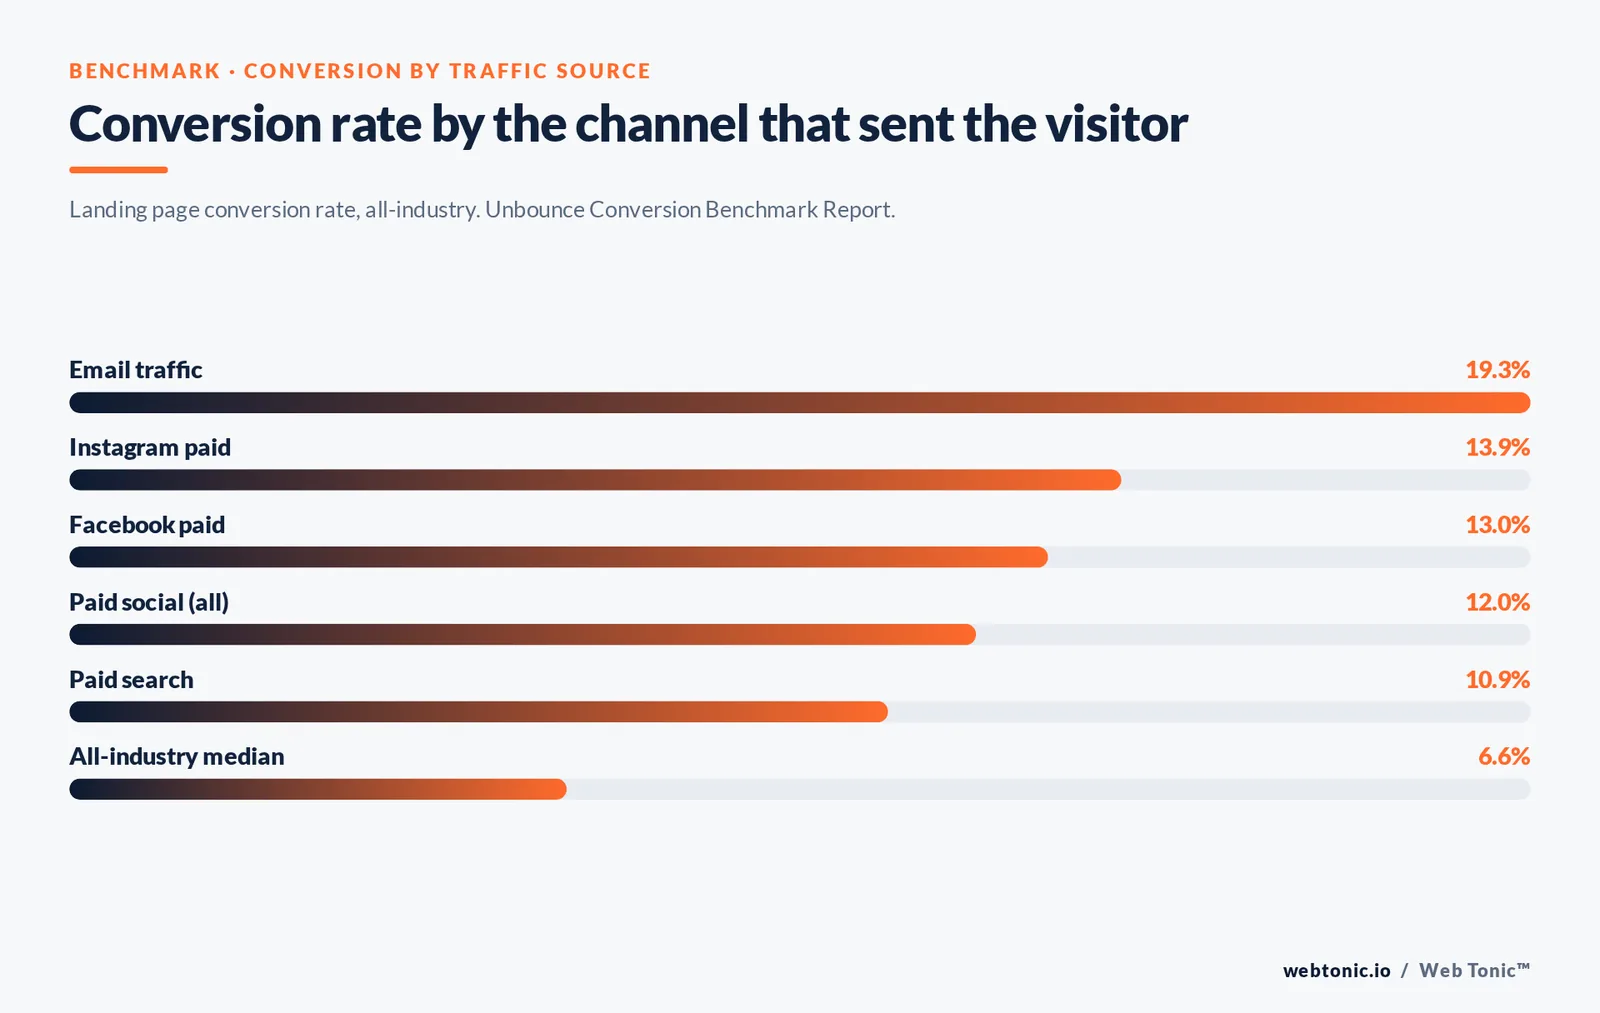
Before testing anything, calibrate. The benchmark table below is the single most useful reference in a CRO program because it stops teams from optimizing a page that is already outperforming its channel.
| Benchmark | Rate | What it tells you |
|---|---|---|
| All-industry median (landing pages) | 6.6% | The baseline any dedicated page should clear |
| Industry range | 3.8%–12.3% | Sector matters more than page craft |
| Email traffic | 19.3% | Owned audiences convert best; prioritise list growth |
| Paid social traffic | 12% | Converts about 10% better than paid search |
| Paid search traffic | 10.9% | Under 10% on PPC pages means room to grow |
| Instagram / Facebook paid | 13.9% / 13% | Highest-converting paid social placements |
| YouTube, TikTok, X paid | 6–9% | Discovery channels need a softer offer |
| Year-on-year conversion change | −5.1% | Flat performance is quietly above trend |
| Average order value change | +6% | Revenue is protected by basket size, not volume |
| Return visitors within 30 days | 13% | First-visit clarity carries almost all the weight |
Contentsquare's digital experience benchmark adds two numbers worth pinning to the wall: visits fell 3.8% and engagement fell 10% year on year, while bounce rates for AI-referred traffic improved 5%. Sessions are shorter and more intent-driven. Pages written for a browsing visitor in 2019 are being read by a decisive visitor in 2026 — and that alone explains a lot of underperformance.
The six-step CRO process
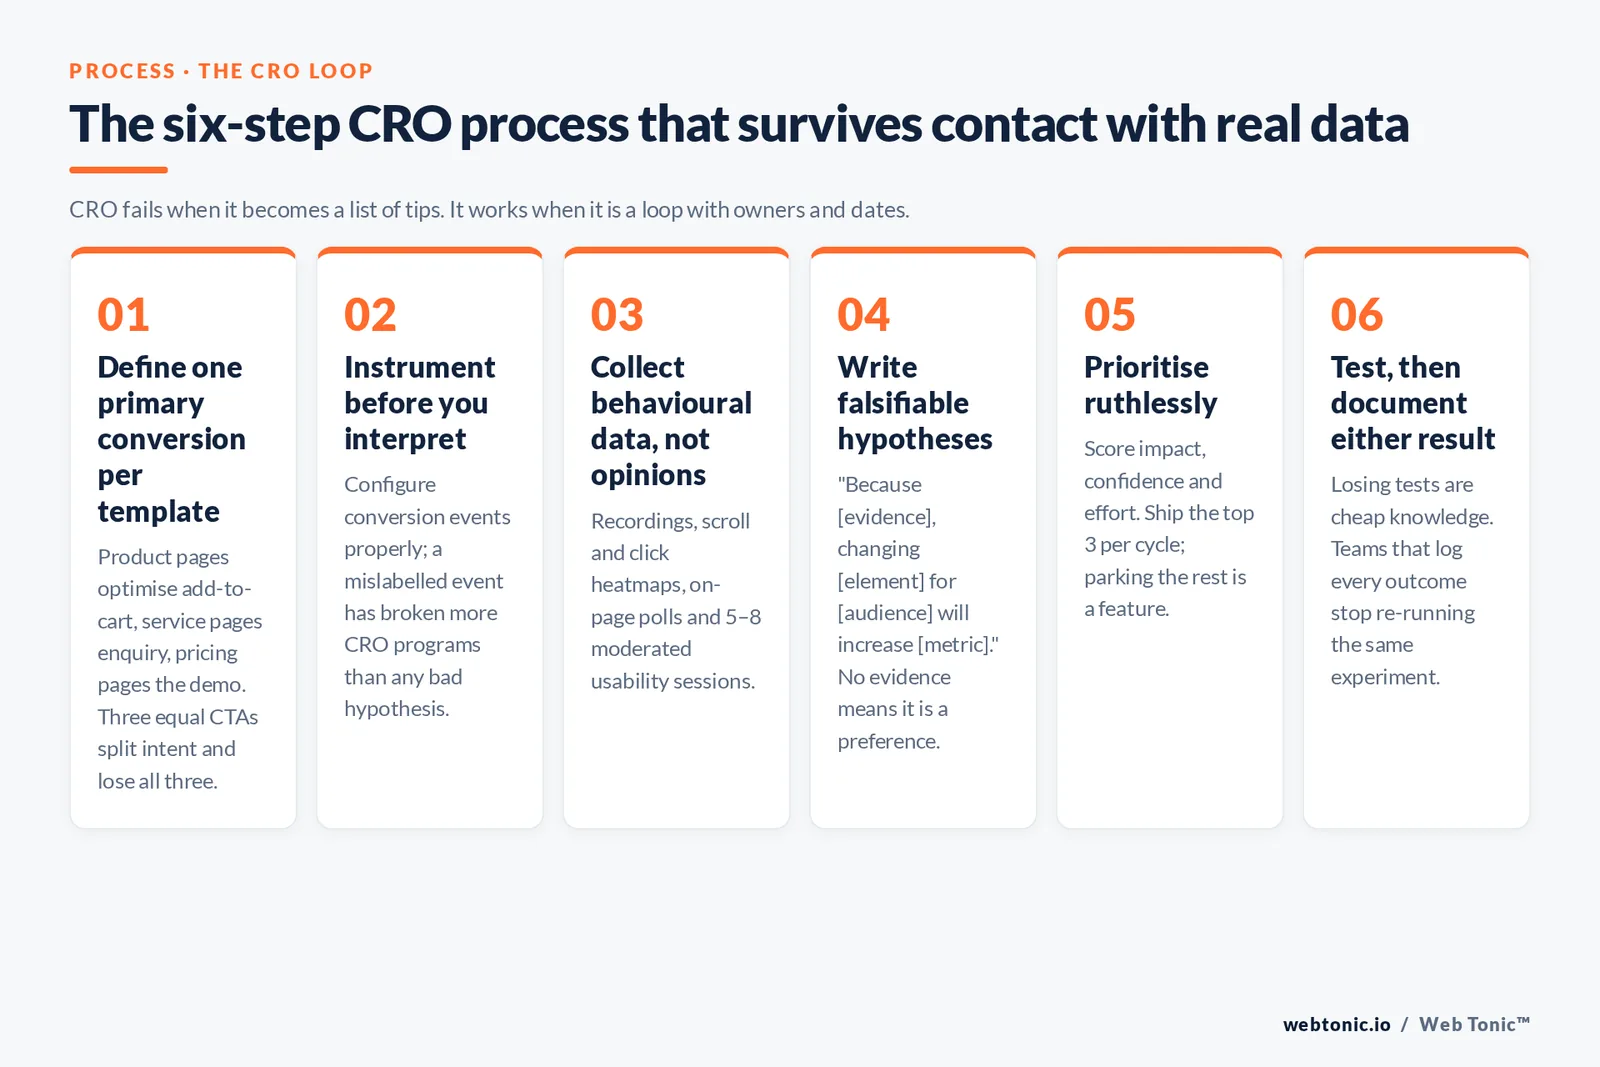
CRO fails when it becomes a list of tips. It works when it is a loop. Each step below is deliberately labelled so it can be assigned to an owner and a date.
Step 1 — Define one primary conversion per template. Product pages optimise add-to-cart, service pages optimise enquiry, pricing pages optimise the demo request. Pages with three equal calls to action typically split intent and lose all three.
Step 2 — Instrument before you interpret. Configure conversion events properly in analytics; a mislabelled event has broken more CRO programs than any bad hypothesis. Google's own documentation on marking events as key events is the reference point, and funnel exploration reports are where the leak becomes visible.
Step 3 — Collect behavioural data, not opinions. Session recordings, scroll and click heatmaps, on-page polls and 5 to 8 moderated usability sessions. Nielsen Norman Group's usability testing guidance is blunt about this: a handful of observed sessions surfaces most severe issues.
Step 4 — Write falsifiable hypotheses. Format: "Because [evidence], changing [element] for [audience] will increase [metric]." A hypothesis without evidence attached is a preference.
Step 5 — Prioritise ruthlessly. Score each idea on expected impact, confidence and effort. Ship the top 3 per cycle; parking the rest is a feature, not a failure.
Step 6 — Test, then document either result. Losing tests are cheap knowledge. Teams that log 100% of outcomes stop re-running the same experiment every eighteen months.
Where conversions actually leak
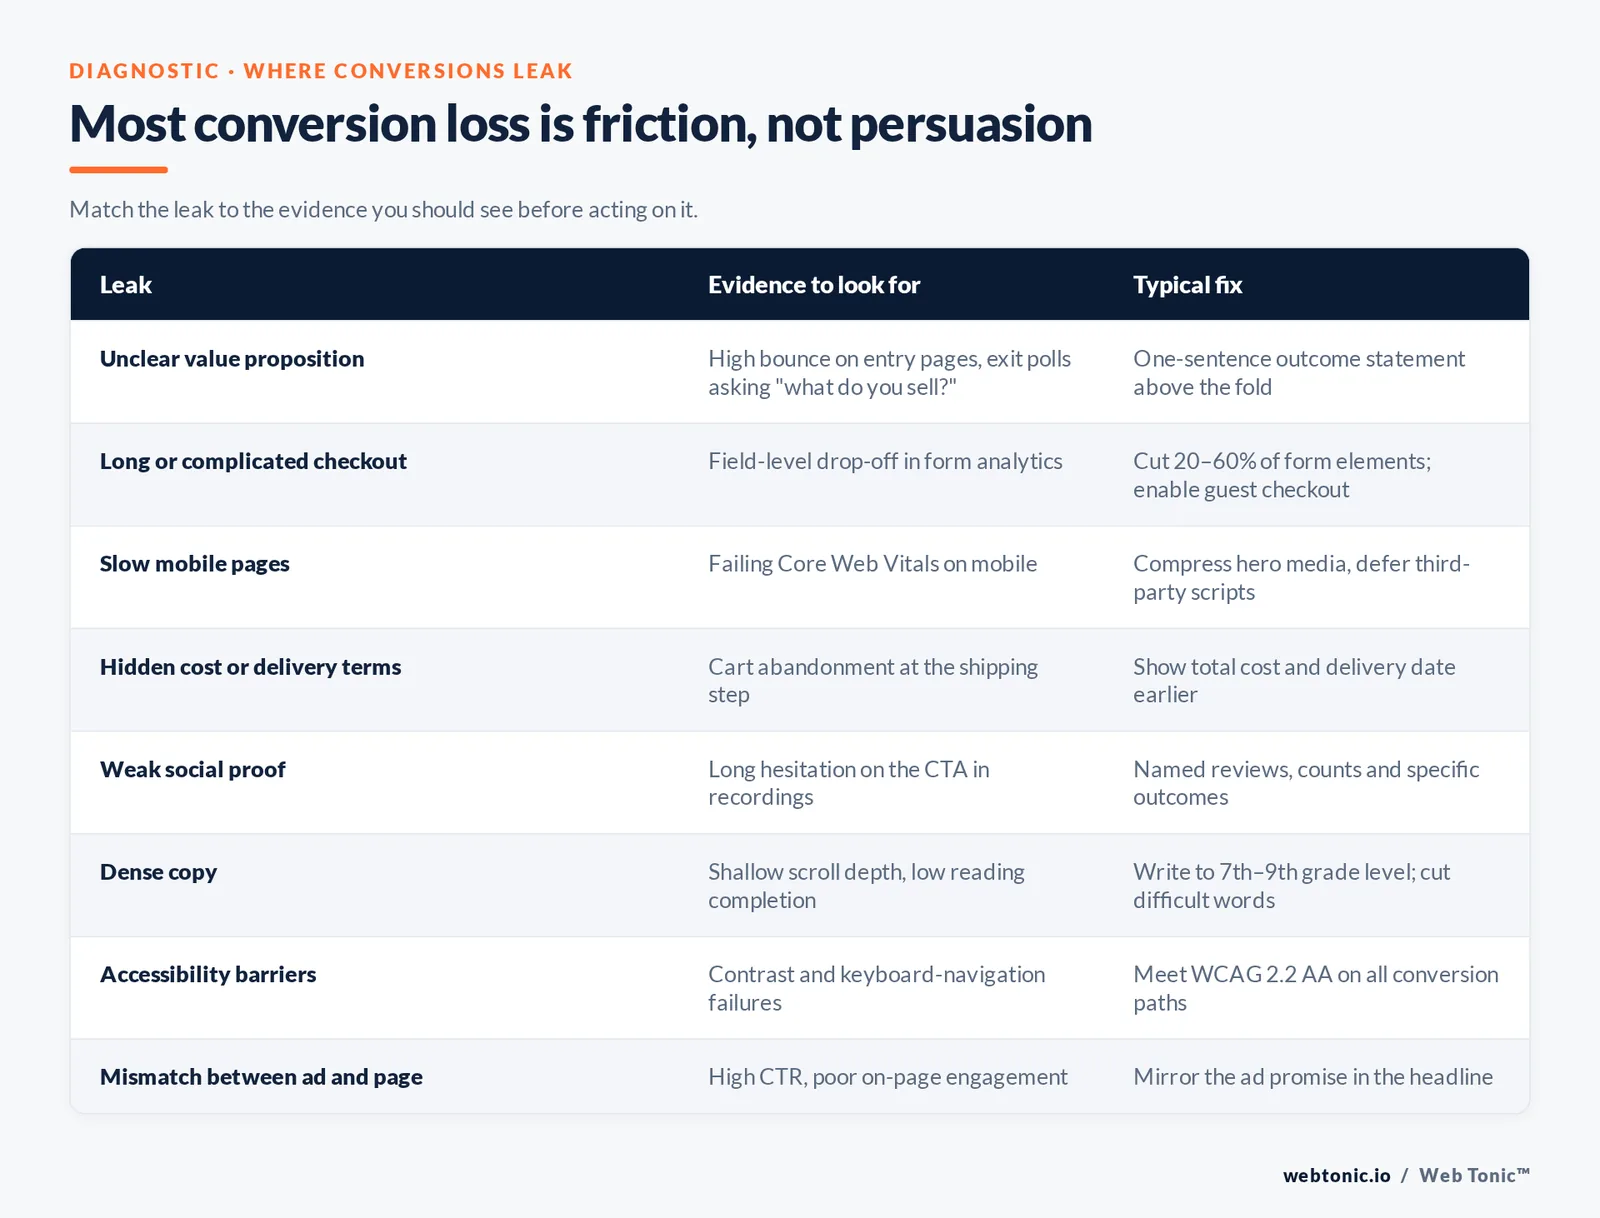
Most conversion loss is friction, not persuasion. The table maps the leak to the evidence you should see before you act on it.
| Leak | Evidence to look for | Typical fix |
|---|---|---|
| Unclear value proposition | High bounce on entry pages, exit polls asking "what do you sell?" | One-sentence outcome statement above the fold |
| Long or complicated checkout | Field-level drop-off in form analytics | Cut 20–60% of form elements; enable guest checkout |
| Slow mobile pages | Failing Core Web Vitals on mobile | Compress hero media, defer third-party scripts |
| Hidden cost or delivery terms | Cart abandonment at the shipping step | Show total cost and delivery date earlier |
| Weak social proof | Long hesitation on the CTA in recordings | Named reviews, counts and specific outcomes |
| Dense copy | Shallow scroll depth, low reading completion | Write to 7th–9th grade level; cut difficult words |
| Form asking too much | Starts high, completions low | Ask only what sales genuinely needs |
| Accessibility barriers | Contrast and keyboard-navigation failures | Meet WCAG 2.2 AA on all conversion paths |
| Mismatch between ad and page | High CTR, poor on-page engagement | Mirror the ad promise in the headline |
Two of those rows are backed by unusually hard data. Baymard Institute's abandonment research finds 42% of US online shoppers abandon simply because they were browsing, while 17% abandon over checkout complexity — and Baymard reports checkout redesigns delivering a 26% conversion increase. On speed, Google's Core Web Vitals documentation and the practical thresholds on web.dev give you pass/fail targets instead of vague "make it faster" tickets. Accessibility is the third: the W3C WCAG standard defines the contrast and navigation minimums that quietly gate conversion for a meaningful share of visitors.
Testing methods compared
| Method | Use it when | Traffic needed | Main risk |
|---|---|---|---|
| A/B test | One clear variable, decent volume | Moderate | Calling it early on noise |
| Multivariate test | Several elements interact | High | Never reaching significance |
| Split URL test | Whole-page or template redesign | Moderate | Tracking and canonical errors |
| Sequential (before/after) | Low traffic, no other option | Low | Seasonality contaminates the result |
| Painted-door test | Validating demand for something unbuilt | Low | Trust damage if handled badly |
| Moderated usability test | You need the "why", fast | 5–8 users | Over-reading one participant |
Statistical discipline is where most in-house programs slip. NN/g's guidance on A/B testing is a good corrective: a test needs a pre-declared metric, a fixed duration covering full business cycles, and enough conversions per variant to mean anything. A practical floor used by most CRO teams is roughly 250–400 conversions per variant and at least 2 full weeks of runtime.
CRO by business type
The same process yields very different priorities depending on how you make money.
| Business type | Primary conversion | Highest-leverage first move |
|---|---|---|
| Ecommerce (high volume) | Purchase | Checkout field reduction and cost transparency |
| Ecommerce (considered purchase) | Purchase or saved cart | Comparison content and review depth on PDPs |
| B2B SaaS | Trial or demo | Pricing clarity and shorter demo forms |
| Local service business | Call or booking | Click-to-call, service-area proof, response time |
| Lead gen (high ticket) | Qualified enquiry | Qualification questions plus trust signals |
| Subscription / media | Sign-up | Value-before-wall and one-field registration |
| Marketplace | Two-sided action | Search and filter usability on mobile |
For paid-heavy accounts, CRO and media buying must be run as one loop — the page and the auction share a budget. That coupling is exactly why growth marketing and web development should not be separate workstreams, and why Shopify's merchant guidance and Semrush's CRO overview both start with measurement rather than design.
CRO tools, and what each one is actually for
| Tool category | Free tier | Strength | Limitation |
|---|---|---|---|
| Web analytics (GA4) | Yes | Funnel and segment analysis at no cost | Says where, never why |
| Heatmaps and recordings | Usually limited | Reveals hesitation and dead clicks | Sampling bias; time-consuming to watch |
| Experimentation platform | Rarely | Proper randomisation and reporting | Flicker and page-speed cost if misdeployed |
| Form analytics | Sometimes | Field-level abandonment detail | Needs careful PII handling |
| On-page surveys | Usually | Cheap qualitative signal at scale | Self-reported, not observed |
| Speed and vitals tooling | Yes | Objective pass/fail thresholds | Lab data can flatter real devices |
Practical starting stack for a team of one: GA4 plus one recording tool plus one survey widget. That combination costs little and answers 80% of first-year questions. Hotjar's CRO resources, VWO's blog, Crazy Egg and HubSpot's CRO guide are the four vendor libraries worth reading; treat their case studies as directional, not as benchmarks.
Metrics that prove a CRO program is working
| Metric | Why it matters | Review cadence |
|---|---|---|
| Conversion rate by template | Isolates the page, not the traffic mix | Weekly |
| Conversion rate by device | Exposes the 8% mobile gap | Weekly |
| Revenue per visitor | Stops discount-driven false wins | Weekly |
| Average order value | Where 2026 growth is actually coming from | Monthly |
| Micro-conversion rate | Early signal on low-volume pages | Weekly |
| Lead quality / close rate | Protects against cheap, useless leads | Monthly |
| Tests shipped and win rate | Measures the program, not just the site | Quarterly |
Set the expectation early: a healthy program wins roughly 1 test in 3. If your reported win rate is 90%, the tests are being called too early. And because mobile carries 83% of landing page traffic while Pew Research and StatCounter's platform share data both confirm the phone-first reality, every test should be reviewed by device before it is declared a winner.
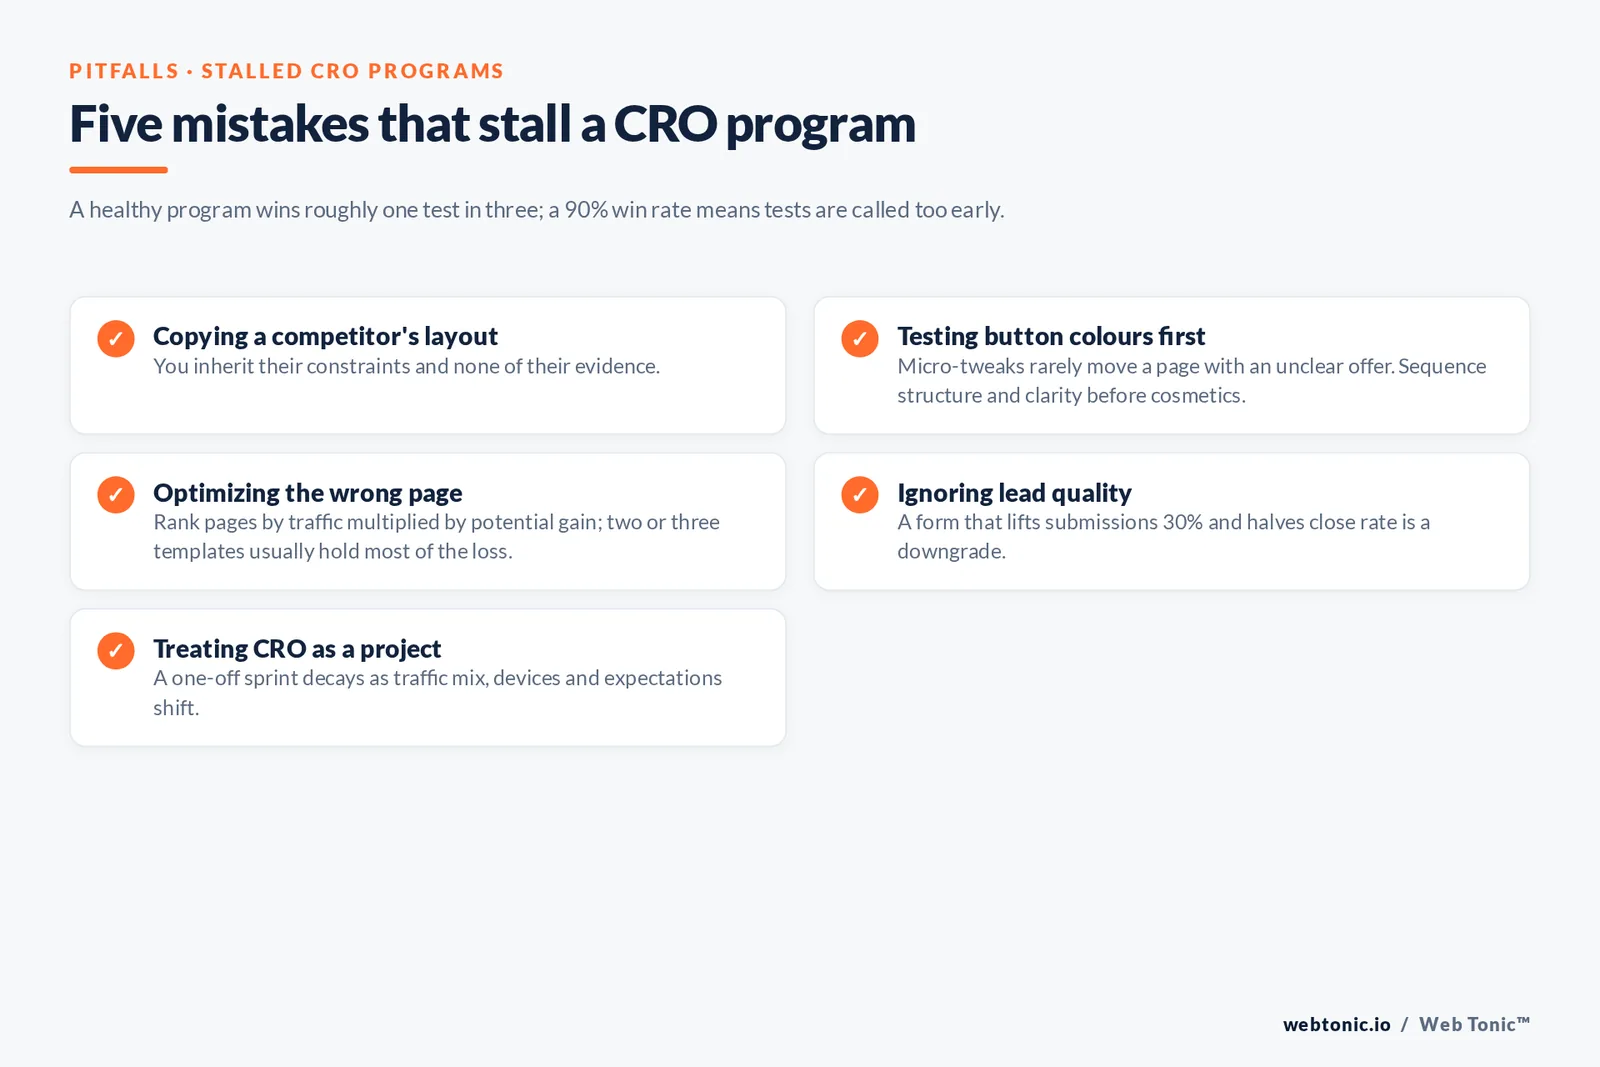
Five mistakes that stall CRO programs
Mistake 1 — Copying a competitor's layout. You inherit their constraints and none of their evidence.
Mistake 2 — Testing button colours first. Micro-tweaks rarely move a page that has an unclear offer; sequence structure and clarity before cosmetics.
Mistake 3 — Optimizing the wrong page. Rank pages by traffic multiplied by potential gain; 2 or 3 templates usually account for most of the loss.
Mistake 4 — Ignoring lead quality. A form that lifts submissions 30% and halves close rate is a downgrade.
Mistake 5 — Treating CRO as a project. A one-off sprint decays; page performance is a moving target as traffic mix, devices and expectations shift.
Average conversion rates by industry and page template
Conversion rate optimization decisions get easier when you compare like with like. A product page, a lead form and an ecommerce checkout are three different conversion problems, and the average conversion rate for each sits at a different level. Read the table below as a sanity check on your own site data before you write a single test hypothesis.
| Page template | Typical conversion rate | Primary desired action | What usually improves it |
|---|---|---|---|
| Ecommerce product page | 2–5% of visitors | Add to cart, then purchase | Better product data, reviews, delivery clarity |
| Ecommerce checkout | 40–60% of cart starts | Completed purchase | Fewer form fields, guest checkout, visible total cost |
| PPC landing page | 6–12% of traffic | Lead form or call | Message match with the ad, one clear CTA |
| SaaS pricing page | 3–8% of website visitors | Trial or demo request | Transparent pricing, shorter forms, social proof |
| Local service page | 5–15% of users | Phone call or booking | Click-to-call CTAs, service-area proof, fast response |
| Blog or SEO content page | 0.5–2% of readers | Micro conversion or subscribe | Relevant in-content CTAs and next-step offers |
| Email-driven landing page | Up to 19.3% | Purchase or booking | Continuity between email promise and page copy |
| Whole-site ecommerce average | 1.5–3% of site traffic | Purchase | Search, navigation and mobile page speed |
Notice how wide the spread is. An ecommerce conversion rate of 2% on a product page is normal; the same 2% on a paid landing page is a serious problem, because the median landing page converts at 6.6%. This is why a CRO program reports conversion rates per template, per traffic source and per device rather than one site-wide number that hides every real insight.
How to read your conversion data without fooling yourself
Behavioral data is what separates conversion optimization from redesign-by-opinion. But raw analytics numbers mislead in predictable ways, and knowing the traps saves months.
Trap 1 — Averaging across intent. Branded traffic converts several times better than cold display traffic. If you report one blended conversion rate, a change in traffic mix looks like a change in page performance. Segment by source before you conclude anything about the site.
Trap 2 — Watching recordings for entertainment. Session recordings are a sampling tool, not a report. Watch 10 sessions of one specific broken step with one question in mind, and stop when the pattern repeats.
Trap 3 — Believing a heatmap over a funnel. Click maps tell you what was noticed. Funnel reports tell you where users left. Use heatmaps to explain a drop that the funnel already proved exists.
Trap 4 — Ignoring new versus returning visitors. With only 13% of visitors returning within 30 days, first-visit clarity carries most of the revenue and should be tested first.
Trap 5 — Reading survey answers as facts. Customers report what they can articulate, which is rarely the real friction. Pair every survey insight with observed behavior from recordings or usability tests before you build a test around it.
Trap 6 — Treating micro conversions as wins. More add-to-cart events with the same number of purchases is a redistribution, not an improvement. Always report the macro conversion and revenue per visitor alongside the micro conversion you moved.
A 90-day CRO program you can actually run
Most teams do not need a bigger CRO tool stack; they need a cadence. This plan assumes one marketer with part-time developer support and a site with moderate traffic.
| Phase | Focus | Deliverable | Success signal |
|---|---|---|---|
| Days 1–15 | Measurement setup | Verified conversion events, funnels per template | Analytics numbers reconcile with back-office data |
| Days 16–30 | Research | Heatmaps, 20 recordings, 5 usability sessions, exit survey | A ranked list of friction points with evidence |
| Days 31–40 | Prioritisation | Scored backlog of 15–25 hypotheses | Top 3 tests agreed with commercial owners |
| Days 41–60 | First test wave | 2–3 tests on the highest-traffic template | Each test reaches its pre-declared sample size |
| Days 61–75 | Quick technical wins | Mobile speed, form field cuts, accessibility fixes | Core Web Vitals pass on mobile templates |
| Days 76–90 | Second wave and reporting | Test log, revenue impact, next-quarter roadmap | Documented win rate and a funded backlog |
Two habits make the difference between a program and a burst of activity. First, every test gets a written result — win, loss or inconclusive — stored where the next marketer will find it. Second, the CRO backlog is reviewed in the same meeting as media budget, because a 20% conversion improvement and a 20% budget increase produce similar revenue with very different cost structures. Teams that connect the two conversations stop treating optimization as a design opinion and start treating it as a growth channel.
Conversion rate optimization best practices, by page element
These are the practices that survive contact with real test data across ecommerce, SaaS and local service sites. Treat the table as a checklist to audit against, not a redesign brief — each row is a hypothesis to test on your own visitors.
| Page element | Best practice | Common failure | Metric it moves |
|---|---|---|---|
| Headline | State the outcome the customer buys, in their words | Clever wordplay that hides the product | Bounce rate, scroll depth |
| Primary CTA | One dominant action per page, repeated 2–3 times | Competing CTAs of equal visual weight | Conversion rate |
| CTA copy | Verb plus outcome ("Get my quote") | Generic "Submit" on every form | Click-through to form completion |
| Forms | Ask only for fields sales genuinely uses | 10-field forms for a first enquiry | Form completion rate, lead quality |
| Social proof | Specific named results near the CTA | Anonymous five-star quotes in the footer | Conversion rate on hesitant users |
| Product imagery | Show the product in use, plus scale and detail | One low-resolution supplier photo | Add-to-cart rate |
| Pricing | Show a price or a real range | "Contact us for pricing" on every tier | Qualified leads per visitor |
| Copy readability | Write at 7th–9th grade reading level | Professional-level prose (5.3% conversion) | Conversion rate, time on page |
| Mobile layout | Thumb-reachable CTAs, no horizontal scroll | Desktop layout squeezed into 390px | Mobile conversion rate |
| Page speed | Pass Core Web Vitals on mobile first | Unoptimised hero video and tag bloat | All conversion metrics |
| Trust and risk | Return policy, guarantees and contact detail visible | Terms buried three clicks away | Checkout completion |
| Navigation | Remove distractions from single-purpose pages | Full site nav on a paid landing page | Conversion rate per session |
The readability row deserves a note because it is the least intuitive. Unbounce's correlation analysis found difficult words associated with conversion at −24.3%, and pages written at professional level converting at only 5.3% — well under the 6.6% median. Simplifying copy is the cheapest CRO test most teams have never run.
Turning CRO insights into a repeatable growth loop
The final maturity step is connecting conversion optimization to the rest of the marketing system, so that each insight is reused rather than rediscovered.
Loop 1 — Feed winning copy back into ads. A headline that lifts landing page conversion by 15% usually lifts ad click-through too, because it resolves the same objection earlier in the journey.
Loop 2 — Feed friction findings into product. If 17% of shoppers abandon on checkout complexity, that is a product backlog item, not a marketing test.
Loop 3 — Feed search data into page structure. The questions users type before they arrive tell you which sections a page needs; this is where CRO and content strategy genuinely overlap.
Loop 4 — Feed test results into forecasting. Once you know a template converts at 8% with a known variance, traffic plans become revenue plans instead of hopeful spreadsheets.
Loop 5 — Feed lead quality back into targeting. Track close rate by landing page and by campaign; the page that produces the most leads is often not the page that produces the most customers.
Run that loop for two quarters and conversion optimization stops being a project with a start date. It becomes the mechanism by which every other marketing investment — SEO, paid media, email, creative — gets measurably more efficient. If you want that built and run properly, that is exactly what our team does with clients every quarter.
FAQ
What is a good conversion rate for a website?
Use the median of 6.6% for a dedicated landing page and compare within your industry band of 3.8% to 12.3%. Whole-site ecommerce rates are typically much lower than landing page rates, so never compare the two directly. The more useful question is whether your rate is improving against your own baseline by device and template.
How do you calculate conversion rate?
Divide the number of conversions by the total number of visitors in the same period, then multiply by 100. Use sessions or users consistently — mixing them is the most common reporting error. For paid campaigns, calculate per landing page and per device so averages do not hide a failing segment.
How much traffic do you need to run an A/B test?
Aim for roughly 250 to 400 conversions per variant and at least two full weeks of runtime so weekday and weekend behaviour are both represented. Below that, use qualitative methods such as usability testing and session recordings, or test on higher-traffic templates instead of single pages.
Is CRO better than buying more traffic?
They compound rather than compete, but CRO usually has better unit economics because it improves every future visit at no extra media cost. Moving a page from 1% to 2% doubles output from the same spend. Most teams underinvest in CRO relative to media because the work is less visible.
How long before CRO shows results?
Expect measurable gains within one to three months on high-traffic templates, and treat the first month as instrumentation and research. Programs that skip the measurement setup usually spend the same time later re-running invalid tests.
Sources: Unbounce Conversion Benchmark Report; Contentsquare Digital Experience Benchmark; Baymard Institute cart abandonment research; Nielsen Norman Group; Google Analytics Help; Google Search Central Core Web Vitals; web.dev; W3C WCAG; Pew Research Center; StatCounter; Optimizely; VWO; Shopify; Semrush; HubSpot; Hotjar; Crazy Egg.