



Table of contents

Word of mouth has no single universal conversion rate: the evidence measures trust, sharing behavior and customer value in different ways. This 2026 page keeps those units separate so operators can benchmark advocacy without treating every recommendation as a trackable referral.
Key Takeaways
- 88% of global respondents trusted recommendations from people they know in Nielsen’s 2021 study.
- 31%–57% more referrals came from referred customers than nonreferred customers in a 2024 field-data study, conditional on purchase activity.
- A reminder of referral origin increased referral likelihood 21% in that study’s field experiment.
- Referred customers had at least 16% higher average value in a 2011 study tracking about 10,000 customers at a German bank.
- Forrester’s 2023 buyer-trust research found 82% trusted coworkers as a source of supplier information.
- HICSS 2024 research studied 119,130 digital transportation users; referred users referred seven times more in that platform context.
- Demand Gen’s 2024 B2B buyer survey put LinkedIn sharing intent at 84%, email at 78%, and internal collaboration at 60%.
- Trust is not the same as a referral, referral is not an attributed sale, and neither alone proves incremental revenue.
- Measure the loop: recommendation intent, actual referral, referred conversion, retained value and subsequent advocacy.
- Use cohort comparisons and disclose source, year and unit; old consumer trust data should not be presented as a 2026 survey.
- Reward design matters; referral economics vary by customer, product and whether rewards go to one or both parties.
- Protect credibility with consent, transparent incentives and a real customer experience.
Different studies measure different parts of word of mouth
Word of mouth includes an offline recommendation, a colleague’s endorsement, a shared post, a review, an introduction or a tracked referral-code conversion. Statistics in this field are often compressed into a single headline, but their measures differ. Surveyed trust is an attitude; stated likelihood to recommend is intention; referral logs record an observable action; customer value compares outcomes; and incrementality asks what would have happened without the recommendation or program.
This page deliberately treats those as separate layers. Nielsen provides a consumer trust signal, peer-reviewed research studies referral behavior and customer value, and B2B surveys describe information sources or sharing channels. Their numbers can inform a measurement framework, but should not be pooled into one “word-of-mouth rate.”
Trust: the recommendation signal has a date and a population
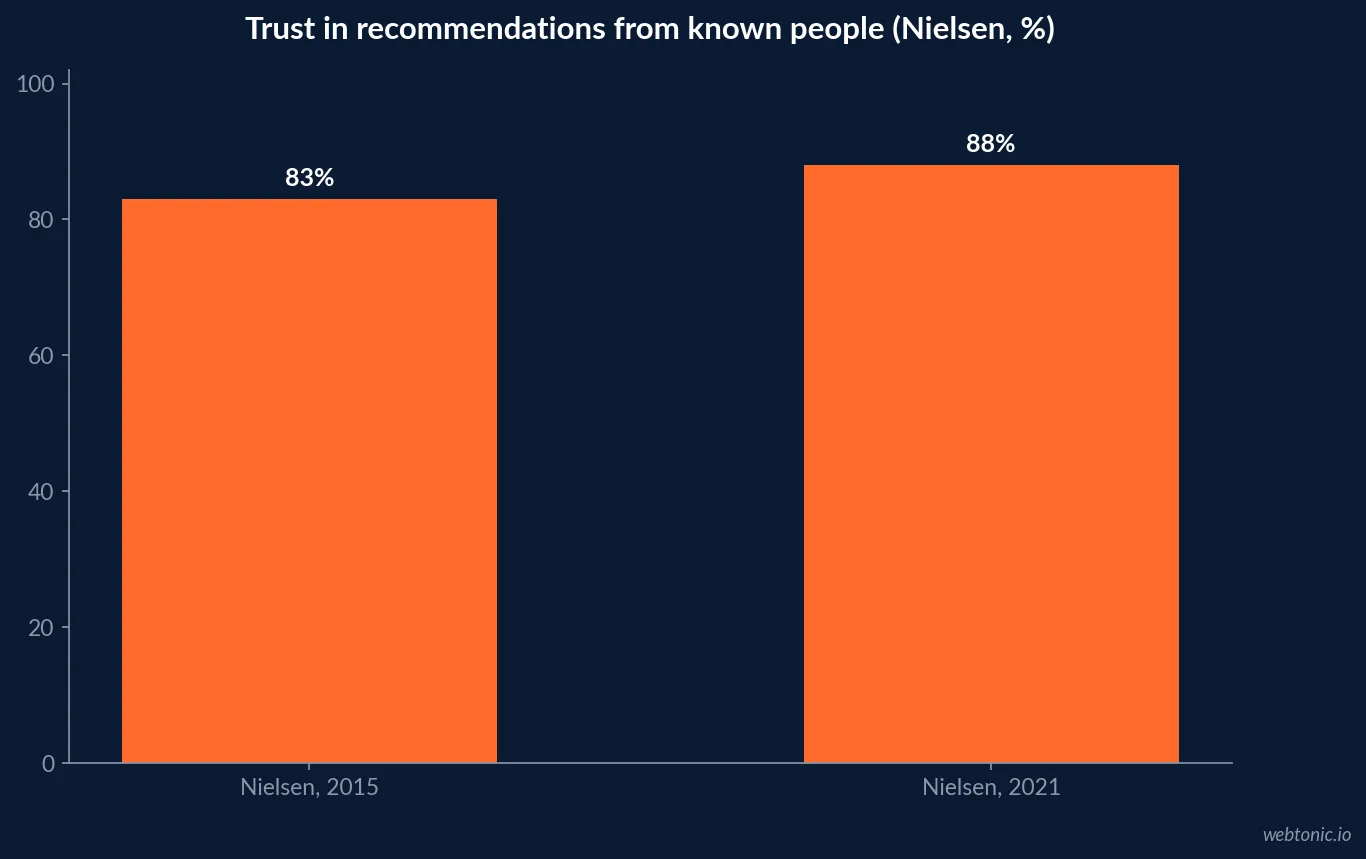
Nielsen’s 2021 Trust in Advertising study reported that 88% of global respondents trusted recommendations from people they know. The underlying survey covered more than 50 countries according to Nielsen’s release; the study is useful as a broad reported-trust measure, not as an observed conversion rate or a 2026 estimate. Earlier Nielsen research from 2015 reported 83% trust in friends-and-family recommendations among 30,000 online respondents in 60 countries. The surveys’ wording, date and samples differ; don’t treat the change as a like-for-like trend without confirming methodology.
The operative insight is not that all recommendations persuade equally. Trust can depend on relationship, category, expertise, credibility and whether the recommender has a disclosed incentive. A close friend’s experience, an anonymous review and an influencer placement are all “word of mouth” in casual language but not equivalent evidence.
When reporting trust statistics, include the exact source and year, and say “respondents said they trusted” rather than “88% of customers buy because of.” The second statement claims behavior the survey did not measure.
Use 88% as reported trust, not purchase share. Earlier Nielsen research found 83% trust in known-person recommendations in a separate 2015 survey. The year, sample and exact wording must travel with the statistic.
| Evidence | Figure | Unit actually measured | Year and scope |
|---|---|---|---|
| Nielsen Trust in Advertising | 88% | Reported trust in recommendations from people known | 2021, global respondents |
| Nielsen Global Trust in Advertising | 83% | Reported trust in friends and family recommendations | 2015, 30,000 online respondents across 60 countries |
| Forrester buyer-trust study | 82% | Trust in coworkers as supplier-information source | 2023 global business buyers |
| Forrester buyer-trust study | 72% | Trust in industry peers as supplier-information source | 2023 global business buyers |
| Demand Gen buyer survey | 84% | Likelihood to share content on LinkedIn | 2024 B2B buyer survey |
Referral contagion: advocacy can continue after the first introduction
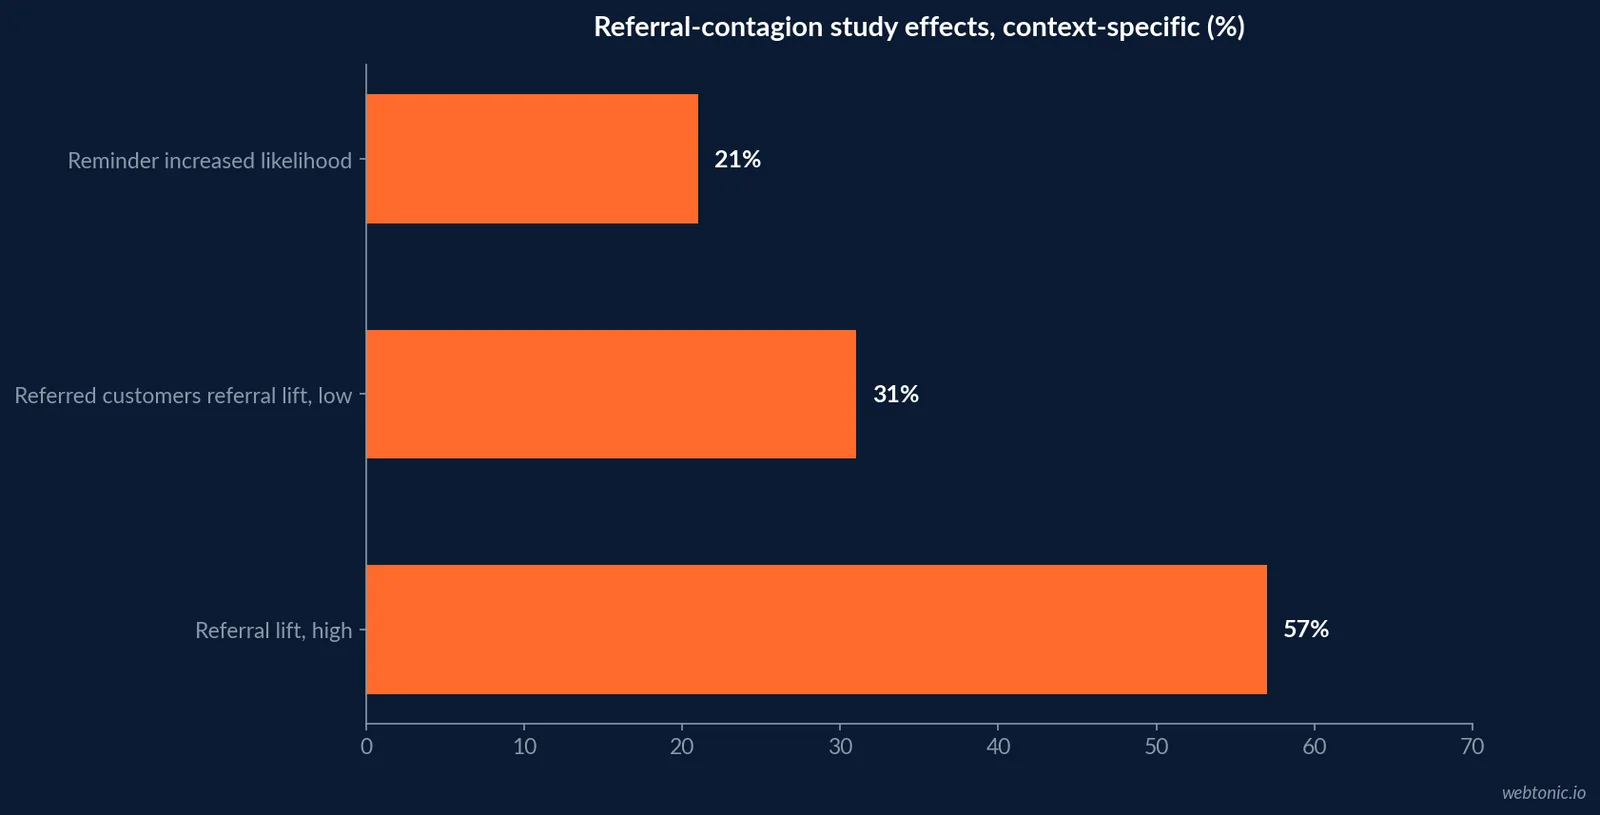
A 2024 Journal of Marketing Research study by Barak Libai, Eitan Muller and Renana Peres examined “referral contagion.” In its large-scale field dataset, referred customers made 31%–57% more referrals than nonreferred customers when conditioned on purchase activity. The authors also reported a field experiment in which reminding referred customers that they had joined through a referral raised referral likelihood by 21%.
The finding suggests a referral can create a second-order effect: people who arrive through a recommendation may be more inclined to recommend in turn. It does not mean every referral customer will recruit a fixed number of new customers. The percentages describe differences and a treatment effect within the research contexts, not a universal program forecast.
For marketers, the operational question is when to invite advocacy. A timely prompt after a successful onboarding or service outcome is more defensible than an automatic request before the customer has experienced value. Record the trigger, response and downstream referral separately so a campaign can distinguish goodwill from repeated nagging.
Customer value: referrals may change retention and margin
A 2011 Journal of Marketing study by Philipp Schmitt, Bernd Skiera and Christophe Van den Bulte tracked approximately 10,000 customers at a leading German bank for nearly three years. It found that referred customers had higher contribution margin and retention, with the average value of a referred customer at least 16% higher than a comparable nonreferred customer. The authors noted that the value difference varied across customer segments and argued for selective program design.
This is an important reminder that a referral’s value is not just the first conversion. It may show up in retention, contribution margin, engagement or additional advocacy. But this evidence is from one bank, one period and a specific customer population. Do not apply the 16% figure directly to another industry or assume a reward program creates the same effect.
Use matched cohorts where feasible, compare equivalent acquisition periods and customer segments, and include incentive expense and servicing cost. Measure both customer-level value and total incremental economics.
| Value lens | Study signal | What to measure internally | Limitation |
|---|---|---|---|
| Contribution margin | Higher for referred cohort in 2011 bank study | Margin after acquisition and service costs | Single financial-services setting |
| Retention | Higher retention, difference persisted in study | Survival/retention by matched cohort | Product and tenure matter |
| Average customer value | At least 16% higher in study | Cumulative value over a defined horizon | Varied by segment |
| Referral activity | 31–57% more referrals in 2024 study | Actual invitations and successful referrals | Conditional on purchase activity |
| Referral propensity reminder | 21% higher likelihood after reminder | Treatment versus control response | Specific intervention context |
B2B word of mouth travels through buying groups
Business recommendations are not only customer-to-customer referrals. They include coworkers, existing vendors, industry peers, professional communities and a champion’s internal advocacy. Forrester’s State of Global Business Buyer Trust in 2023, based on 1,420 global purchase influencers, reported 82% trusted coworkers and 72% trusted industry peers as information sources about suppliers. It also found buyers who trust a supplier were twice as likely to recommend it as those who did not.
In 2025, Edelman and LinkedIn’s B2B Thought Leadership Impact Report focused on “hidden buyers” and buying-group influence. Its report says more than 40% of B2B deals stall because of internal misalignment. The point is that trust can travel inside an organization before a sales representative sees the deal. Thought leadership and customer evidence can equip internal advocates, but the report is about influence and buying-group alignment—not a word-of-mouth conversion rate.
For B2B operations, ask new opportunities who introduced the vendor, which colleagues influenced evaluation and whether the relationship predated the opportunity. Capture self-reported referral source without forcing a false single-touch attribution where multiple people shaped the decision.
Sharing is a behavior, but not all shares are referrals
Demand Gen Report’s 2024 Content Preferences Benchmark Survey found B2B buyers were likely to share useful content on LinkedIn (84%), email (78%) and internal collaboration platforms (60%). These are stated sharing channels, not evidence that a recipient bought a product or made a personal endorsement. Still, they help marketers design assets that are useful in the conversations where decisions are shaped.
Give customers and employees material that carries context: a case study with permission, a sourced chart, a concise answer to a common question, or a link to methodology. Track tagged links when sharing is digital, but preserve a self-reported “how did you hear about us?” field for offline conversations. The two will not match perfectly, and that is expected.
Do not use share counts as a substitute for customer advocacy. A widely shared post can have no qualified reach, while one private peer conversation can influence a high-value decision.
| Channel or action | Published evidence | Best internal metric | What it does not establish |
|---|---|---|---|
| Recommendations from known people | 88% reported trust (Nielsen 2021) | Trust and referral-source survey | Purchase behavior |
| Coworker information | 82% trust (Forrester 2023) | Stakeholder influence capture | A formal referral |
| LinkedIn content sharing | 84% stated likely (Demand Gen 2024) | Qualified shares and assisted visits | New customers caused by shares |
| Referral loop | 31–57% more activity in 2024 field data | Referrals per acquired cohort | Guaranteed multiplier |
| Referral program | Measured across user cohorts | Incremental value net of costs | Organic WOM alone |
Referral programs: incentives and customer experience interact
A referral program formalizes an invitation and often adds a reward. Organic word of mouth does not require a reward, and a reward can change how the recipient interprets an endorsement. Research in the 2024 HICSS proceedings analyzed 119,130 users of digital transportation platforms and found referred users spent 5.77% more on average, were 11.66% less likely to defect, and referred seven times more than nonreferred users. The authors also observed that effects varied by age segment and cautioned against a one-size-fits-all approach.
That is one platform category, not a benchmark for every ecommerce, professional-services or SaaS business. A separate 2024 Journal of Retailing and Consumer Services study comparing referral reward acquisition and advertising used scenario-based experiments; it found acquisition method related to later rewarded-referral participation through satisfaction and perceived justifiability. Together, these findings argue for measuring product satisfaction and reward design, not just referral volume.
Design clear eligibility, disclose the incentive, avoid pressuring customers and ensure the reward does not make the recommendation misleading. The program should be a convenient way to share genuine value, not a substitute for delivering it.
Measurement: separate trust, referrals and incrementality
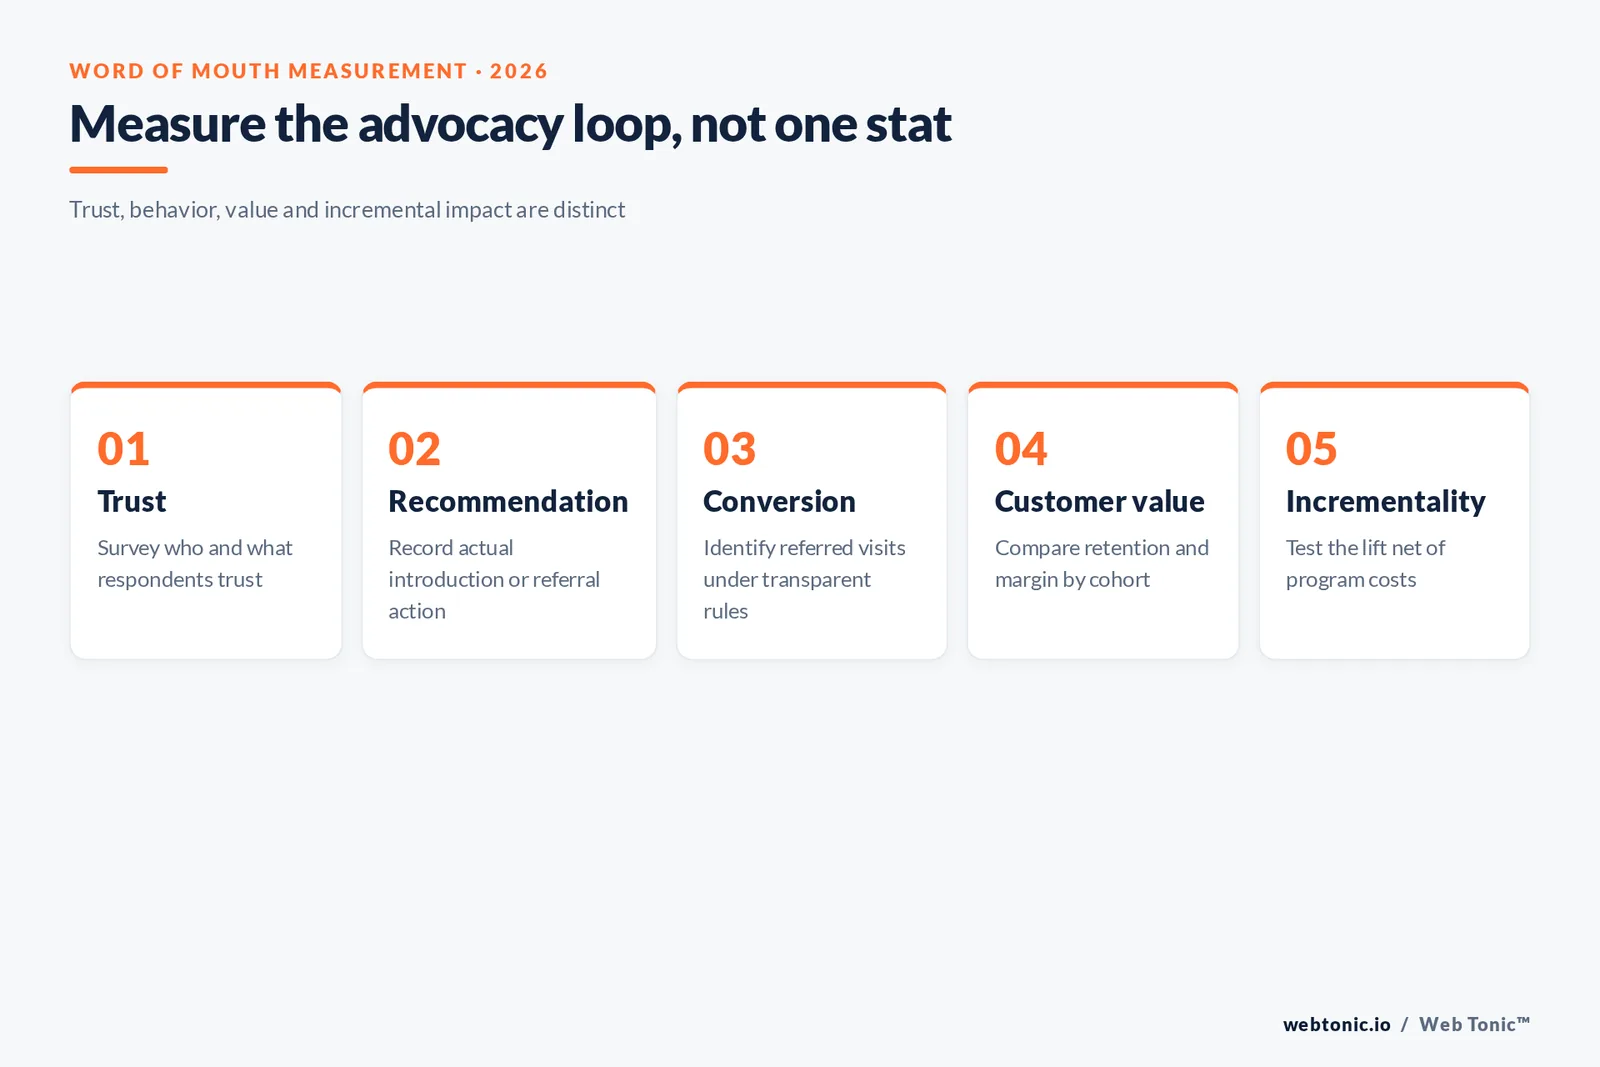
Use a measurement ladder. First, trust: survey whether customers rely on recommendations and why. Second, activity: count invitations, link shares, introductions and referral source declarations. Third, conversion: identify referred visitors and customers with transparent rules. Fourth, quality: compare retention, margin, support burden and repeat advocacy. Fifth, incrementality: estimate whether the program brought additional customers beyond those who would have arrived anyway.
For attribution, preserve multiple influence sources where practical: self-reported first awareness, tracked referral link, sales-rep notes, CRM campaign and customer introduction. If the reporting model forces one source, document its precedence rules. Monitor missing and unknown values. Privacy, consent and sensitive personal relationships matter; collect only the information needed to operate the program.
Where feasible, use a randomized holdout or phased rollout to estimate incremental program impact. Otherwise use a matched comparison and state the limitations. A referred cohort may differ before the referral occurs, so raw cohort differences are not necessarily caused by word of mouth.
What marketers should do with the numbers in 2026
Use the numbers as evidence about mechanisms, not as promise language. Nielsen’s 88% is a trust measure from 2021. The 31%–57% referral contagion result comes from a 2024 study and conditions on purchase activity. The 16% customer-value difference is from a 2011 German bank. The HICSS platform evidence comes from a digital transportation setting. Each can inform a question; none yields your brand’s forecast without local validation.
Build your own baseline by acquisition cohort and segment. Track actual recommendations, referred conversion, retention, contribution and program cost. Ask customers for an introduction only after a meaningful value moment. Share credible material that makes advocacy easy. Then examine whether the resulting growth is incremental and sustainable.
Our growth marketing practice and data intelligence service help teams connect channel activity to customer outcomes. See our campaign measurement guide and paid social ROI analysis for context on paid acquisition alongside advocacy.
How the studies were built—and why age matters
Research vintage is part of the finding. Nielsen’s 2021 survey offers a cross-market trust snapshot. The 2024 referral-contagion study combines field data, preregistered lab experiments and a field intervention. The 2011 bank study follows almost 10,000 accounts over multiple years. HICSS 2024 examines a digital transportation platform with 119,130 users. These different designs support different statements: survey trust, relative referral frequency, a setting-specific customer-value comparison and category-specific referral-program outcomes.
Do not rank them as though the newest figure automatically replaces older research. Use the study that matches the question, and label the geography, population, period and unit. This is especially important when turning a peer-reviewed result into a short marketing headline.
For a broader customer-experience perspective, Ipsos’ 2025 CX Global Insights includes recommendation behavior across markets and categories. Such survey results can update a team’s understanding of customer advocacy, but they do not turn intent into observed referral activity.
Across different designs, the reported signals include 88% trust, a 31%–57% referral difference, a 21% reminder effect, at least 16% higher average value, 5.77% greater spending, 11.66% lower likelihood to defect, and seven times the referrals in one platform study. These are study-specific results, not a combined benchmark.
| Reported statistic | Study year | Population / unit | Do not claim |
|---|---|---|---|
| 88% trust in known-person recommendations | 2021 | Global survey respondents | Purchase conversion rate |
| 31%–57% additional referrals | 2024 paper | Referred vs nonreferred customer behavior | Universal referral multiplier |
| 21% higher referral likelihood | 2024 paper | Reminder intervention | Guaranteed program lift |
| At least 16% higher average value | 2011 | German bank customer cohort | All industries’ CLV uplift |
| 7× referrals | 2024 HICSS paper | Digital transportation users | All programs’ outcome |
| Study design | Sample / scope | Evidence produced | Best use |
|---|---|---|---|
| Consumer attitude survey | Nielsen, 2021 global study | 88% reported trust in known-person recommendations | Trust context |
| Field dataset + experiments | Journal of Marketing Research, published 2024 | 31–57% more referrals; 21% intervention lift | Referral behavior hypothesis |
| Longitudinal customer data | About 10,000 German bank accounts | At least 16% higher average value in study | Cohort-value question |
| Platform behavior study | 119,130 digital transportation users, HICSS 2024 | Referral, spend and defection differences | Category-specific program design |
| Business buyer survey | Forrester, 1,420 global purchase influencers | Coworker and peer trust measures | B2B buying-group context |
Distinguish organic word of mouth from managed referral marketing
Organic word of mouth occurs without a company-controlled reward or tracking code. Referral marketing creates a defined invitation, incentive or process. Both can originate in customer advocacy, but a program introduces selection and incentive effects. An attribution code may capture the managed portion while missing private conversations, and program conversion should not be presented as total word-of-mouth impact.
Report these as separate lines: customer-reported organic referrals, tracked program invitations, referred signups, eligible rewards and downstream value. If a reward is conditional, disclose that when collecting advocacy or publishing a testimonial. That transparency protects the recommender’s credibility and the brand’s trust.
For management, evaluate program economics as a net contribution after reward and operating costs, then use holdouts or phased rollouts where possible. Referral activity alone can increase while incremental acquisition remains flat if participants would have shared anyway.
| Measure | Organic word of mouth | Managed referral program |
|---|---|---|
| Trigger | Customer chooses to recommend | Defined campaign or referral event |
| Visibility | Often private or self-reported | Link, code or CRM record may identify |
| Incentive | None or incidental | Explicit reward may apply |
| Attribution | Survey, sales notes, source question | Tracked referral record and eligibility |
| Incrementality | Compare cohorts or use holdout | Test program against an eligible control |
| Trust safeguard | Authentic customer experience | Clear reward disclosure and consent |
Frequently Asked Questions
How many people trust word of mouth?
Nielsen’s 2021 Trust in Advertising study reported that 88% of global respondents trusted recommendations from people they know. This is a survey result from 2021, not a current universal forecast, and it measures reported trust rather than actual purchase behavior. State the year and study whenever repeating it.
Do referred customers make more referrals?
A 2024 Journal of Marketing Research study found referred customers made 31% to 57% more referrals than nonreferred customers, conditional on purchase activity, using a large-scale field dataset. In a field experiment, reminding customers that they joined through a referral increased referral likelihood by 21%. These are study-specific results, not guaranteed rates for every program.
Are referred customers more valuable?
The direction of evidence is encouraging but context matters. A 2011 Journal of Marketing study tracking about 10,000 customers at a German bank found referred customers had at least 16% higher average value than comparable nonreferred customers, with differences varying across segments. Referral programs should be assessed on incremental value and costs, not the average alone.
How should marketers measure word of mouth?
Separate recommendation trust, observed referral activity, referred-customer outcomes and attributed revenue. Track referral source where customers report it, tagged links and codes where used, cohort retention and downstream advocacy. Do not equate a stated intention to recommend with an actual recommendation or claim a referral caused a sale without a defensible comparison.
Sources
Nielsen, 2021 Trust in Advertising study insights
Nielsen, Trust in Advertising study methodology summary
Harvard Business Review, 2024 customer referral research summary
Wharton, referral contagion study authors’ paper
Wharton, referred customer value study paper
Urban and Thies, HICSS 2024 referral program study
Forrester, State of Global Business Buyer Trust in 2023
Demand Gen Report, 2024 B2B Buyer Behavior Benchmark Survey
LinkedIn, 2025 hidden buyers and thought leadership study
Ipsos, 2025 customer experience insights on recommendations


