



Table of contents

No single named study cleanly breaks average sales cycle length across ten or more industries - the credible 2025-2026 research instead segments by deal size, buying motion and funnel stage. This page builds the industry-relevant table from five disclosed-sample studies rather than repeating an unsourced "average sales cycle by industry" list, and states which study each row comes from.
Key Takeaways
- Median across all B2B SaaS is 84 days (Optifai 2026 pipeline study, N=939).
- SMB deals under $15,000 ACV close in 14 to 30 days.
- Mid-market deals ($15,000-$100,000 ACV) close in 30 to 90 days.
- Enterprise deals over $100,000 ACV take 90 to 180-plus days.
- Sales cycles have lengthened 22% since 2022, per the same study.
- Average buying committee size grew from 5.4 to 6.8 stakeholders.
- Blended B2B average is 102 days: 84 days lead-to-opportunity, 18 days opportunity-to-close (Geckoboard, citing Implisit pipeline analysis).
- New business deals close in 91 days on average (Ebsta and Pavilion 2025 GTM Benchmarks, 655K opportunities analyzed).
- Expansion deals close in 52 days on average, 2.5 times easier than new business.
- Top-performing sellers close deals 42% faster than the rest of the team.
- Sales cycles ran 9% shorter in the 2025 report than the year before.
- Deals with 3-plus engaged contacts close 2.4 times faster than single-threaded deals.
- $100,000-plus deals take about 70 days to close (Gong's 2025 State of Revenue, via SaaStr).
- 43% of sales leaders report cycle times have increased (RAIN Group Center for Sales Research).
- 84% of sales leaders cite growing decision-maker counts as a challenge.
- Top-performing sellers hold a 72% average win rate on proposed sales.
Why there is no clean 10-industry table
Search for "average sales cycle length by industry" and most results repeat the same uncredited 20-industry list with no disclosed sample or methodology behind it. The studies that do disclose a sample size and methodology - Optifai's 2026 pipeline study (939 B2B companies), the Ebsta and Pavilion 2025 GTM Benchmarks report (655,000 opportunities, $48 billion analyzed) and Geckoboard's KPI page citing Implisit's pipeline analysis - segment by deal size, buying motion and funnel stage instead. Those are the axes that actually predict cycle length, and industry rides along as a correlate rather than a cause.
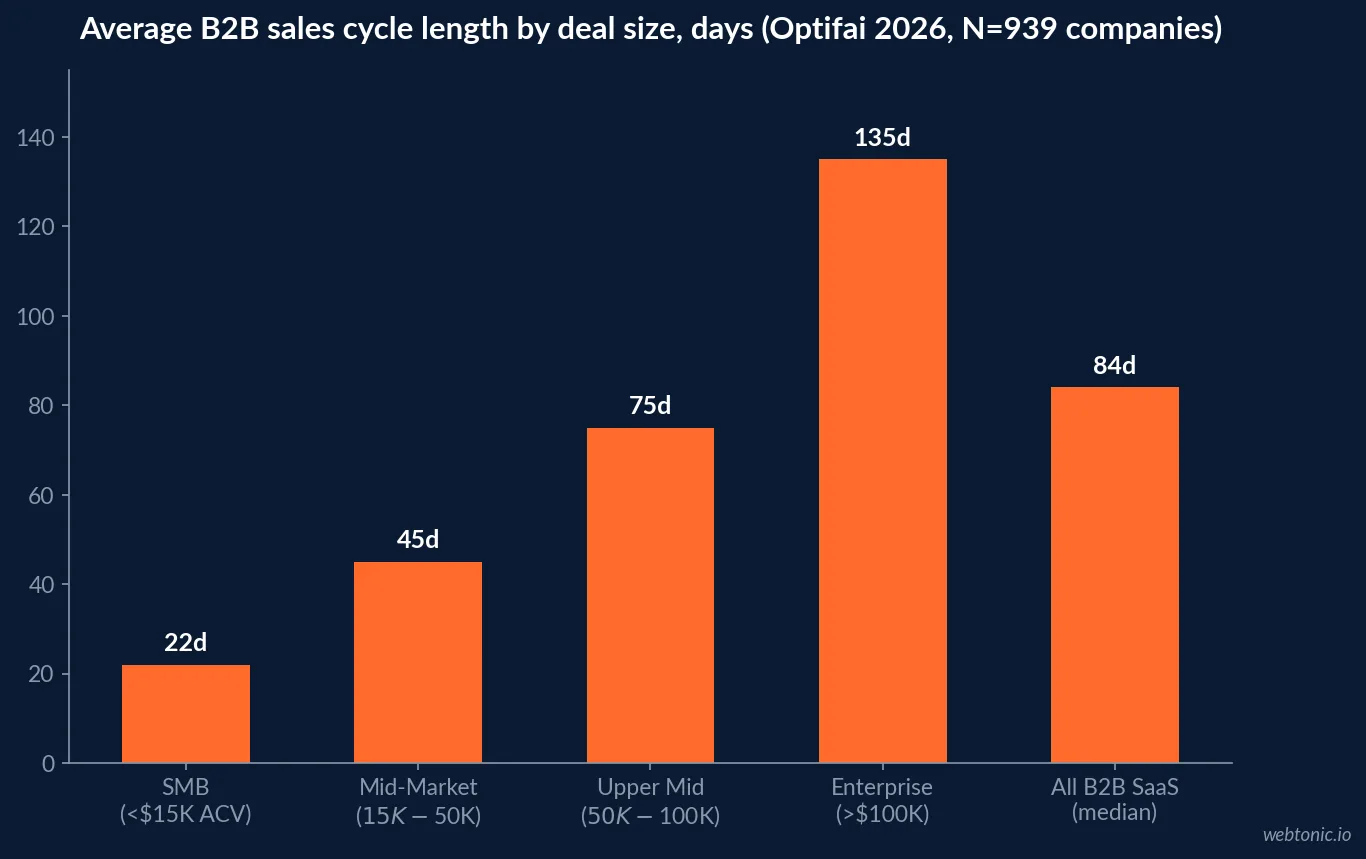
Sales cycle length by deal size (Optifai 2026, N=939 B2B companies)
Optifai's research team, led by founder Yusuke Onishi, analyzed anonymized CRM data across industries including SaaS, manufacturing, consulting and professional services, weighting for industry and company size.
| Deal-size tier | ACV range | Cycle length | Typical buying context |
|---|---|---|---|
| SMB | Under $15,000 | 14-30 days | Often single decision-maker, low procurement friction |
| Mid-Market | $15,000-$50,000 | 30-60 days | Procurement involvement, 2-3 stakeholders typical |
| Upper Mid-Market | $50,000-$100,000 | 60-90 days | Security review, legal redlines, budget approval |
| Enterprise | Over $100,000 | 90-180+ days | RFP process, committee decisions, multi-quarter budgets |
| All B2B SaaS (median) | Blended | 84 days | Includes all tiers above, industry- and size-weighted |
Where the days actually go, by stage
The same Optifai research breaks the cycle into stages, and the pattern holds across tiers: the final stage - negotiation to close - eats the largest share of time at the enterprise level, driven by legal redlines and procurement approval rather than genuine indecision.
| Stage | SMB | Mid-Market | Enterprise | Typical bottleneck |
|---|---|---|---|---|
| Discovery to Demo | 3-5 days | 5-10 days | 10-20 days | Calendar coordination |
| Demo to Proposal | 1-3 days | 5-15 days | 15-30 days | Internal alignment |
| Proposal to Negotiation | 3-7 days | 10-20 days | 20-40 days | Stakeholder buy-in |
| Negotiation to Close | 2-5 days | 10-20 days | 30-60 days | Legal and procurement |
By buying motion: new business versus expansion
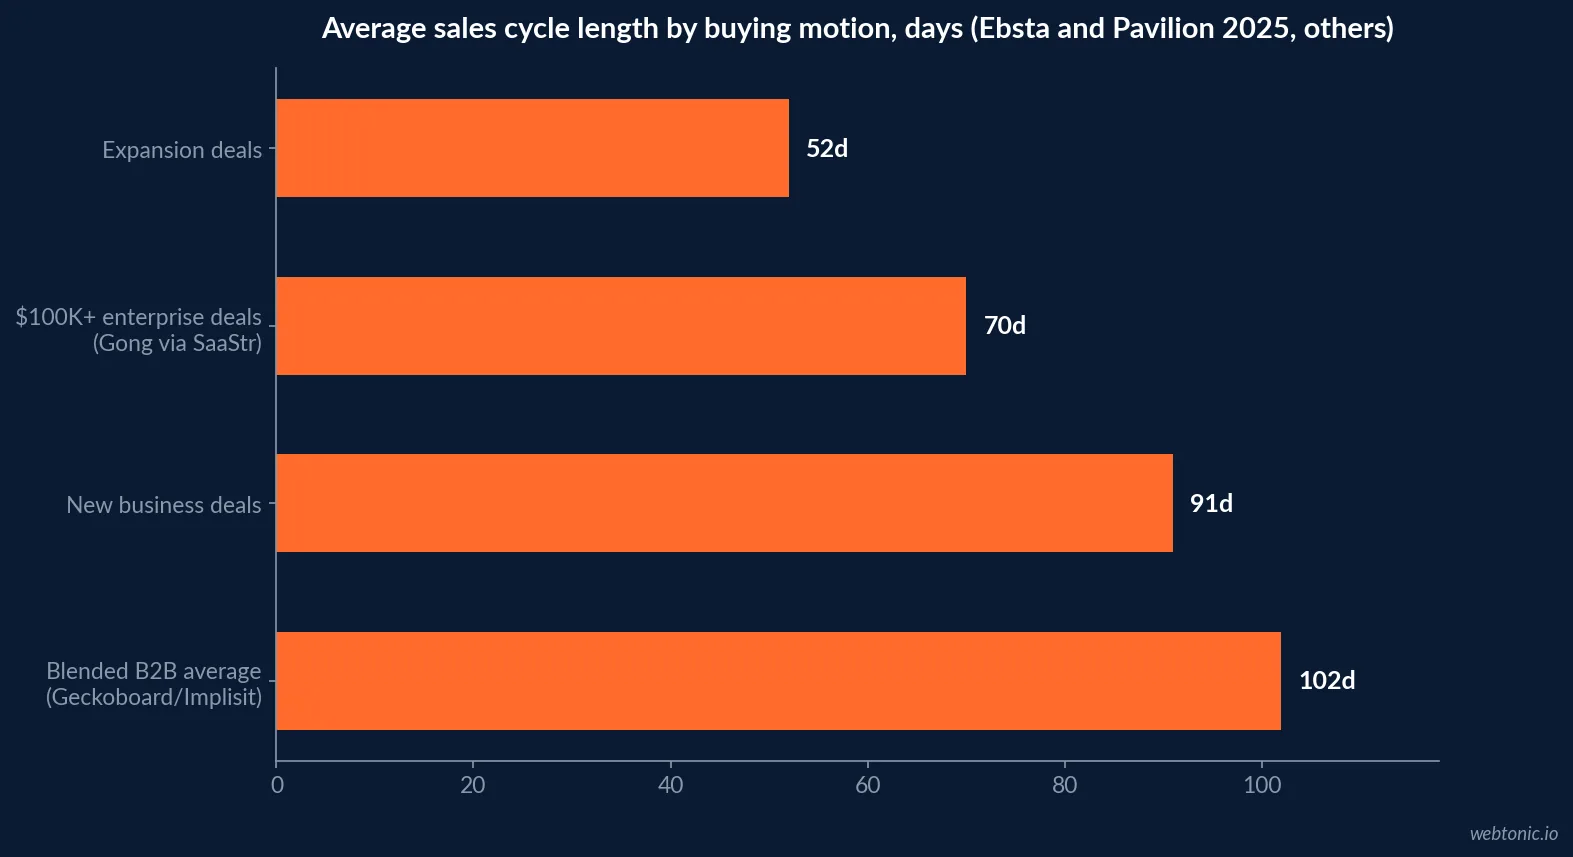
The single largest lever in the data is not deal size at all - it is whether the buyer is new or already a customer. The Ebsta and Pavilion 2025 GTM Benchmarks report, analyzing 655,000 opportunities worth $48 billion and surveying over 2,000 CROs and sales leaders, found expansion deals close in under two months on average against new business deals taking three months.
| Buying motion | Avg. cycle length | Win rate | Stakeholders | Source |
|---|---|---|---|---|
| New business | 91 days | 19% | 8 | Ebsta and Pavilion 2025 GTM Benchmarks |
| Expansion | 52 days | 45% | 5 | Ebsta and Pavilion 2025 GTM Benchmarks |
| $100,000+ enterprise deals | ~70 days | ~25% | n/a | Gong 2025 State of Revenue, via SaaStr |
| Blended B2B average | 102 days | n/a | n/a | Geckoboard, citing Implisit pipeline analysis |
What is moving the average, either way
Ebsta and Pavilion's 2025 report found overall sales cycles ran 9% shorter than in the 2024 report, and that top-performing sellers close 42% faster than everyone else on their team - a gap the report attributes to earlier multi-threading (deals with 3 or more engaged contacts close 2.4 times faster than single-threaded ones) rather than to faster individual conversations. At the same time, RAIN Group's Center for Sales Research found 43% of sales leaders reporting cycle times had increased and 84% citing growing decision-maker counts as an active challenge - both trends can be true at once when averaged across an entire market: median cycles lengthen while top-quartile sellers pull further ahead.
| Trend (2025-2026 data) | Figure | Source |
|---|---|---|
| Sales cycles vs. prior year | -9% | Ebsta and Pavilion 2025 GTM Benchmarks |
| Top performers vs. rest of team | 42% shorter cycle | Ebsta and Pavilion 2025 GTM Benchmarks |
| Multi-threaded vs. single-threaded deals | 2.4x faster close | Ebsta and Pavilion 2025 GTM Benchmarks |
| Sales leaders reporting longer cycles | 43% | RAIN Group Center for Sales Research |
| Sales leaders citing more decision-makers | 84% | RAIN Group Center for Sales Research |
| Cycle lengthening since 2022 (all B2B SaaS) | +22% | Optifai 2026 pipeline study |
A seventh data point: the buyer's side of the cycle
Every study so far measures the cycle from the seller's CRM. Vendr's SaaS buying data, drawn from its own software-procurement platform, measures the same window from the buyer's side and finds new software purchases taking roughly 41 days on average, with renewals closing faster at about 53 days when procurement has already vetted the vendor once. Vendr also reports that AI products specifically take 21% longer to buy than the average software purchase, as budget owners add extra security and data-governance review before signing.
An older but still-cited Sales Benchmark Index distribution, hosted on HubSpot's own CDN, found sales cycles clustering as follows across a broad B2B sample: under 1 month for 8% of deals, 1 to 3 months for 39%, 4 to 6 months for 28%, 7 to 9 months for 11%, 10 to 12 months for 7%, and over a year for the remaining 7% - a distribution shape that still roughly matches the SMB-to-enterprise spread in Optifai's 2026 data above.
| Cycle length band | Share of B2B deals (Sales Benchmark Index, via HubSpot) |
|---|---|
| Under 1 month | 8% |
| 1-3 months | 39% |
| 4-6 months | 28% |
| 7-9 months | 11% |
| 10-12 months | 7% |
| Over 1 year | 7% |
Six questions before you trust a quoted benchmark
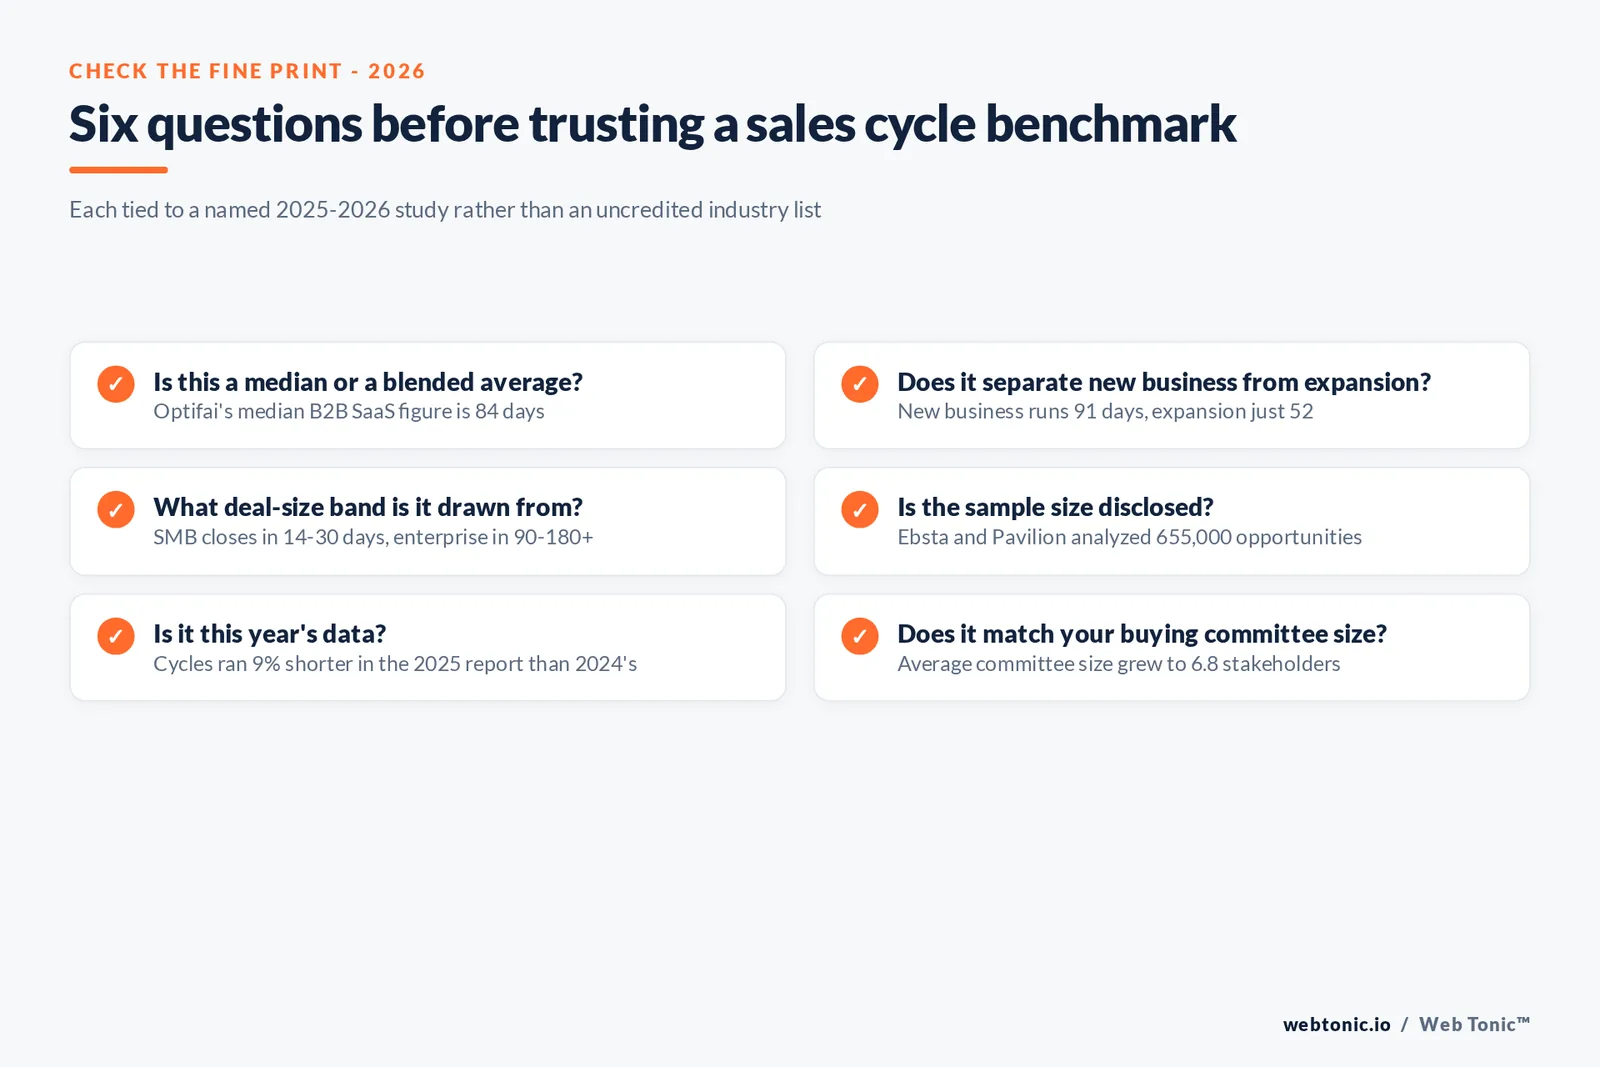
Given how much these numbers move with deal size and buying motion, a rep or sales leader should check: is this a median or a blended average; does it separate new business from expansion; what deal size band is it drawn from; is the sample disclosed and how large; is it this year's data or an older report being recirculated; and does it match your own buying committee size. Our growth marketing practice and the pipeline modelling behind our data and analytics work both start from that same checklist before a forecast gets built on top of an external benchmark.
If your CRM doesn't yet separate new-business cycle length from expansion, or blended averages from deal-size tiers, talk to us about building that layer, or see how the same deal-size logic applies to paid acquisition costs feeding the top of that same pipeline.
Manufacturing and Consulting: the two named verticals in the sample
Optifai's 2026 pipeline study is one of the few datasets here that names specific verticals inside its 939-company sample: SaaS, Manufacturing, Consulting and Professional Services. Its "deal cycle by industry" page reports a blended B2B SaaS average deal cycle of 45 days, with Manufacturing running closer to 60 days - longer than SaaS on average, consistent with the capital-equipment and multi-department sign-off pattern that tends to characterize manufacturing purchases regardless of deal size.
The forecasting implication
A pipeline forecast built on a single blended "84-day average" will systematically over-predict how fast enterprise deals close and under-predict how fast expansion deals close, because it averages two populations that do not behave alike. Segmenting the forecast by deal-size tier and buying motion, even roughly, produces a materially more accurate close-date prediction than applying one number account by account.
What a rep controls versus what the market sets
Deal size and industry set the outer bounds of a cycle; multi-threading and proposal speed set where a specific deal lands inside those bounds. Ebsta and Pavilion's 2.4x multi-threading effect and 35% same-day-proposal effect (RAIN Group and Optifai, respectively) are both rep-controlled levers that work inside any deal-size tier, which is why "shorten the sales cycle" advice should target those two behaviors first rather than trying to argue a deal into a smaller size tier than it actually is.
Frequently Asked Questions
What is the average B2B sales cycle length?
It depends far more on deal size than on the industry label. Optifai's 2026 pipeline study of 939 B2B companies puts the median across all B2B SaaS at 84 days, but that median hides a wide spread: SMB deals under $15,000 ACV close in 14 to 30 days while enterprise deals over $100,000 ACV take 90 to 180-plus days. Geckoboard's analysis of Implisit's pipeline data, covering hundreds of companies, puts the blended B2B average at 102 days, split into 84 days lead-to-opportunity and 18 days opportunity-to-close.
Why do sales cycles vary so much by deal size?
More money means more approvers. Optifai's 2026 data attributes a 22% lengthening of cycles since 2022 to larger buying committees, now averaging 6.8 stakeholders per deal versus 5.4 in 2020, plus increased security and compliance due diligence even at the mid-market. Ebsta and Pavilion's 2025 GTM Benchmarks report, drawn from 655,000 analyzed opportunities worth $48 billion, found deals with 3 or more contacts engaged close 2.4 times faster than single-threaded deals - more stakeholders slow a deal down unless they are engaged early, not sequentially.
Is expansion selling really faster than new business?
Yes, substantially. Ebsta and Pavilion's 2025 GTM Benchmarks report found expansion deals close in 52 days on average compared to 91 days for new business deals - selling to an existing customer is reported as 2.5 times easier, with higher win rates, fewer required stakeholders and a shorter cycle throughout.
Are sales cycles getting longer or shorter in 2026?
Both, depending on which study and segment. Ebsta and Pavilion's 2025 report found cycles ran 9% shorter than the prior year, and that top-performing sellers close 42% faster than the rest of the team. RAIN Group's Center for Sales Research, in the same window, found 43% of sales leaders reporting cycle times had increased and 84% citing challenges from a growing number of decision-makers. Read as a whole: average cycles are flat to slightly improving for top performers while getting harder for the median seller.
How should a rep actually use an industry benchmark for sales cycle length?
Match the benchmark to deal size and buying motion before matching it to industry label. A $100,000-plus enterprise deal should be checked against Gong's 2025 State of Revenue finding (about 70 days for $100K deals, per Gong's own data reported via SaaStr) or Optifai's enterprise tier (90 to 180-plus days), not against a blended 84-day median that mixes deal sizes together. If a deal is running well past its matched benchmark, the fix is usually more stakeholders engaged earlier, not more follow-up emails.
Sources
Optifai - B2B sales cycle length benchmarks, 939 companies by deal size and segment (2026)
Optifai - Deal cycle length by industry, 2025-2026 B2B benchmarks
Ebsta and Pavilion - 2025 GTM Benchmarks Report
Geckoboard - Average Sales Cycle Length KPI, citing Implisit pipeline analysis
RAIN Group Center for Sales Research - 100+ Essential Sales Statistics
SaaStr - Gong: $100K deals take about 70 days to close (Gong 2025 State of Revenue)
Vendr - The SaaS Trends Report, Q2 2024 (buyer-side procurement timing)
Sales Benchmark Index, via HubSpot - Sales cycle length distribution

