



Table of contents

Median Net Promoter Score by industry ranges from 30 in Software to 65 in Manufacturing, according to Survicate's 2025 survey of 599 companies and 5.4 million responses. A second, independently collected dataset from Retently shows a different absolute scale for several of the same labels - which is the real lesson here: the methodology behind an NPS benchmark matters as much as the number itself.
Key Takeaways
- The 2025 median NPS across all industries is 42 (Survicate, 599 companies).
- Manufacturing leads at a median NPS of 65, the highest industry measured.
- Software sits at the bottom with a median NPS of 30.
- B2C companies outperform B2B by 11 points, 49 versus 38.
- Software shows an 18-point B2B-vs-B2C gap: 29 for B2B against 47 for B2C.
- Healthcare shows the widest B2C-vs-B2B gap of any industry, 32 points (70 vs 38).
- The bottom 10% of companies fell from -0.3 to -4 year over year.
- Agency and Consulting scores a median NPS of 59.
- Retail and Ecommerce scores a median NPS of 55 in Survicate's data.
- Retently's own B2B client base scores Financial Services at 68, its highest B2B industry.
- Retently's Consulting figure is also 68, tied for the top B2B score.
- Retently's Technology & Services scores 63 in its 2026 benchmark.
- Retently's Healthcare score dropped sharply to 37 in 2026 from over 50 the prior year.
- Retently's Insurance score fell to 46 in 2026 after previously leading its chart.
- Digital Marketplaces score a median NPS of 35 in Survicate's dataset.
- Wholesale scores a median NPS of 36.
- Media scores a median NPS of 40, roughly matching the cross-industry median.
- Property Management enters Retently's 2026 chart at a score of 47.
Two datasets, two different questions
Survicate's 2025 benchmark analyzed data from 599 unique companies running 2,187 surveys and collecting 5,414,263 responses from January through October 2025, reporting median scores across 11 industries and both B2B and B2C segments within each. Retently's 2026 benchmark is built entirely from its own customer base - industries need at least 10 client companies and 10,000 surveys to be included, and it reports average (not median) scores, B2B-specific, from a single survey vendor's client roster.
Both are legitimate, but they are answering slightly different questions: "what is typical across the market" (Survicate) versus "what does this specific vendor's client base look like" (Retently). An analyst comparing a company's own score against either table should check which question is being asked before drawing a conclusion.
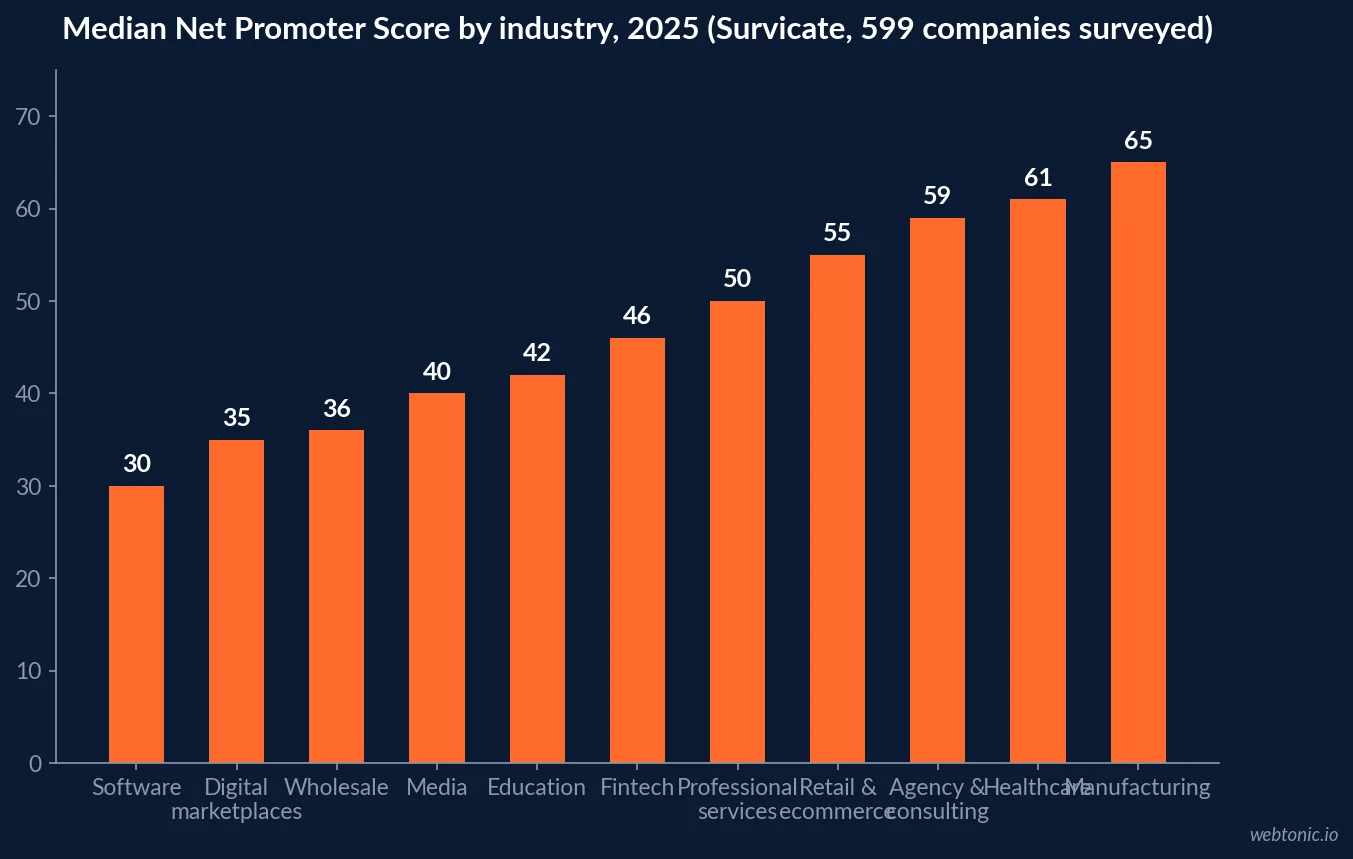
Median NPS by industry (Survicate 2025, 599 companies)
| Industry | Median NPS (2025) | Versus all-industry median (42) |
|---|---|---|
| Manufacturing | 65 | +23 |
| Healthcare | 61 | +19 |
| Agency & Consulting | 59 | +17 |
| Retail & Ecommerce | 55 | +13 |
| Professional Services | 50 | +8 |
| Fintech | 46 | +4 |
| Education | 42 | 0 |
| Media | 40 | -2 |
| Wholesale | 36 | -6 |
| Digital Marketplaces | 35 | -7 |
| Software | 30 | -12 |
The B2B-vs-B2C gap inside each industry
Blended industry medians hide a second, often larger split: whether the buyer is a business or a consumer. Survicate's 2025 breakdown shows this gap runs in different directions depending on the sector - B2C wins in Healthcare, Software and Education, while B2B actually wins in Manufacturing and Digital Marketplaces.
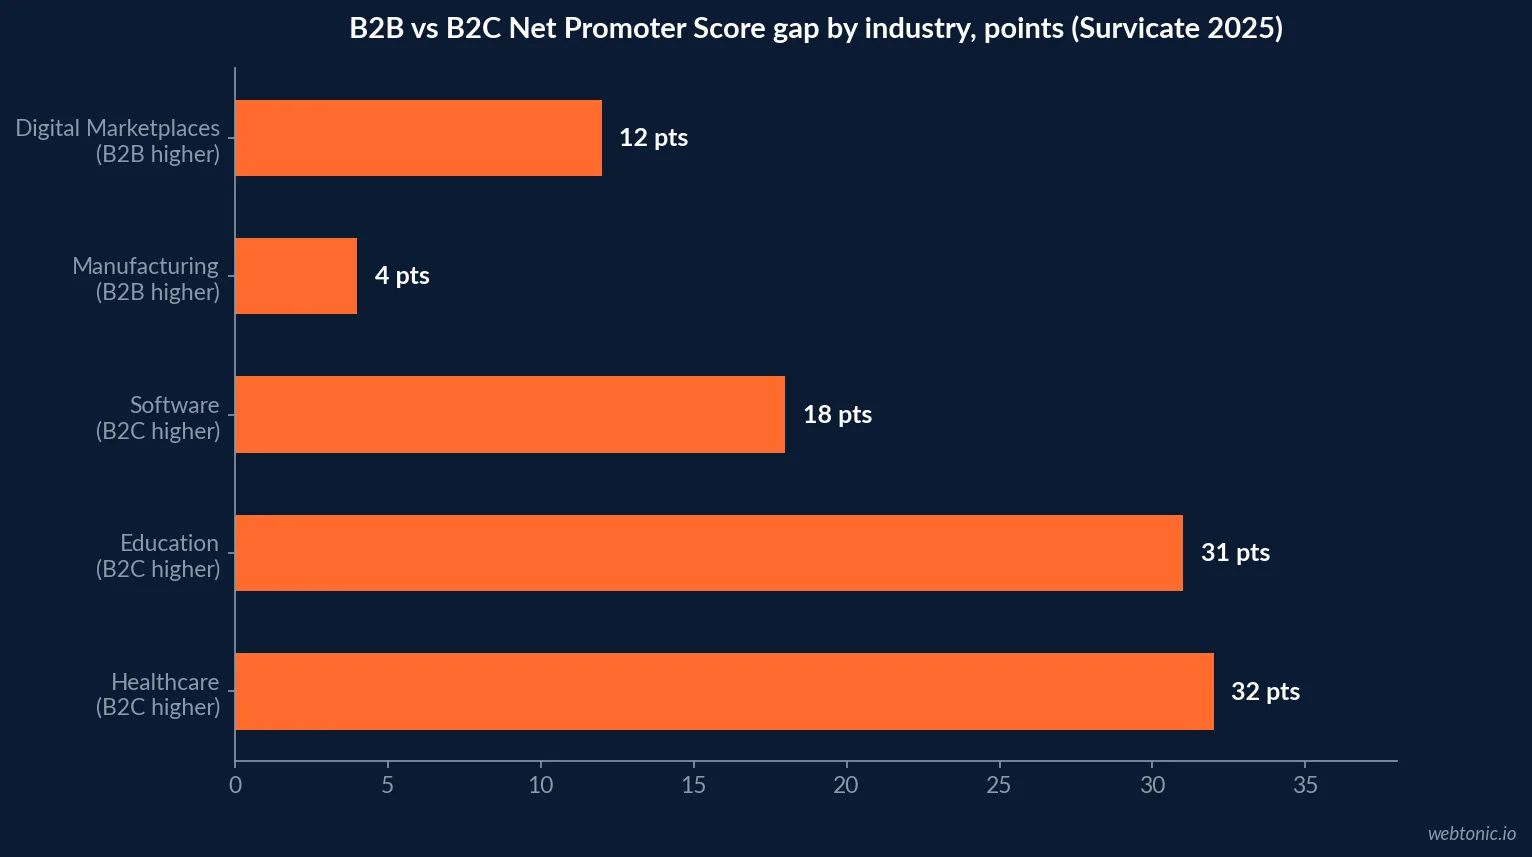
| Industry | B2C NPS | B2B NPS | Gap | Who wins |
|---|---|---|---|---|
| Healthcare | 70 | 38 | 32 pts | B2C |
| Education | 47 | 16 | 31 pts | B2C |
| Software | 47 | 29 | 18 pts | B2C |
| Digital Marketplaces | 27 | 39 | 12 pts | B2B |
| Manufacturing | 62 | 66 | 4 pts | B2B |
| Retail & Ecommerce | 54 | 55 | 1 pt | Near-tied |
| Agency & Consulting | 58 | 59 | 1 pt | Near-tied |
Retently's own client-base benchmark (2026, B2B)
Retently draws only from its own survey customers - industries need a minimum of 10 client companies and 10,000 total survey responses to appear. It reports average scores for B2B accounts specifically, which is why some labels look higher than Survicate's blended medians for the same-sounding industry.
| Industry (Retently, B2B, 2026) | Average NPS | YoY movement |
|---|---|---|
| Financial Services | 68 | Down from a prior 75 |
| Consulting | 68 | Slightly softer than 2025's high 60s |
| Technology & Services | 63 | Steady multi-year growth |
| Ecommerce / Retail | 61 | Up after a 2023 dip to 50 |
| Property Management | 47 | New entrant to the chart |
| Insurance | 46 | Down sharply from a prior lead |
| Healthcare | 37 | Dropped from over 50 in 2025 |
Why the scale itself varies
Part of the disagreement between benchmark tables is baked into the metric's history. The Net Promoter System's own methodology page traces NPS back to Fred Reichheld's original 2003 work at Bain & Company, published openly so any organization could apply and adapt it. That openness is a feature - it is why NPS spread everywhere - but it also means different survey platforms have refined slightly different question wording, response scales, and industry taxonomies over two decades, which is a second, quieter reason Retently's Financial Services figure and Survicate's Fintech figure do not match even before sample composition is considered.
Reconciling the two tables
Financial Services / Fintech is the clearest case of methodology creating an apparent contradiction: Survicate's blended Fintech median sits at 46, while Retently's B2B-only Financial Services average sits at 68. Neither number is wrong - one is a market-wide median across company sizes and business models, the other is a single vendor's B2B client roster, which likely skews toward larger, more mature accounts already invested in a CX program. The lesson for an analyst is to disclose which dataset a claimed benchmark comes from, every time.
Our data and analytics practice treats this the same way it treats any third-party benchmark: as a directional check on your own survey's trend, not a pass/fail target to chase in isolation.
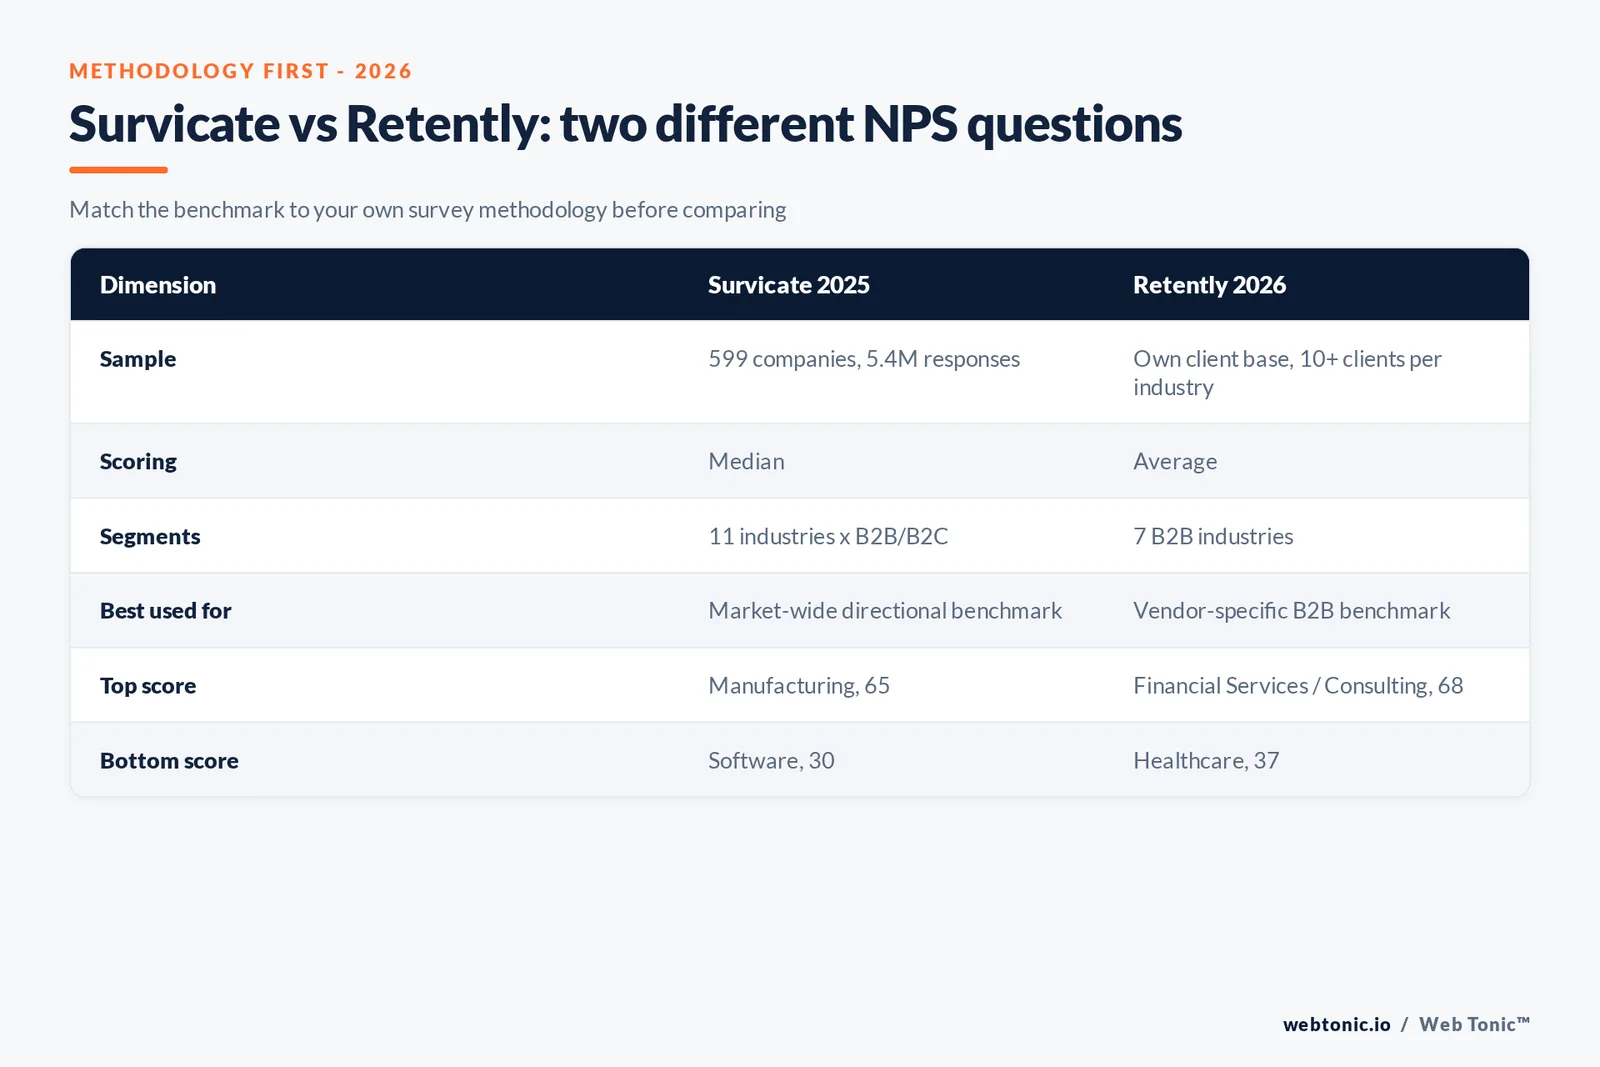
| Methodology dimension | Survicate 2025 | Retently 2026 |
|---|---|---|
| Sample | 599 companies, 5.4M responses | Own client base only, 10+ clients / 10,000+ surveys per industry |
| Scoring | Median | Average |
| Segments reported | 11 industries x B2B/B2C | 7 B2B industries |
| Best used for | Market-wide directional benchmark | Vendor-specific B2B account benchmark |
A third check: Qualtrics XM Institute and NPS Prism
Two more named, disclosed-sample studies add a third and fourth reference point. Qualtrics XM Institute's 2024 U.S. consumer benchmark surveyed 10,000 consumers across 354 companies and 22 industries, finding grocers scoring highest at an average NPS of 34.3 and car rental companies lowest at 15.8 - both far below Survicate's or Retently's scale, because Qualtrics averages raw company scores within a narrower 22-category consumer taxonomy rather than reporting industry medians.
NPS Prism's 2025 U.S. Benchmarks Report, built on the original Bain & Company NPS methodology from over 800,000 customers and 1,000-plus companies, reports the U.S. banking industry average NPS at 33, with digital banks reaching 41 against traditional banks at just 26. The same report finds NPS leaders delivering roughly 2.9 times the total shareholder return of the rest of their industry over a ten-year window - a reminder that NPS benchmarking exercises exist to inform a business outcome, not just a scoreboard.
| Study | Sample | Notable finding |
|---|---|---|
| Qualtrics XM Institute (2024) | 10,000 consumers, 354 companies, 22 industries | Grocers lead at 34.3, car rental lowest at 15.8 |
| NPS Prism (2025) | 800,000+ customers, 1,000+ companies | Banking industry average NPS is 33; digital banks reach 41 |
What actually moves an industry's score
Survicate's data flags a broader trend worth watching regardless of industry: the bottom 10% of companies saw their NPS fall from -0.3 in 2024 to -4 in 2025, suggesting rising customer expectations are making it harder for underperformers to recover, not easier. A flat or slowly improving score against a worsening industry floor is still relative progress - which is another reason a single point-in-time comparison against a benchmark table undersells or oversells performance depending on which year's table gets used.
If your own NPS program needs the tracking infrastructure to separate B2B from B2C respondents, or median from average, before benchmarking either, talk to us, or read our broader breakdown on what NPS actually measures for the calculation mechanics behind both tables above.
What NPS leadership is actually worth
NPS Prism's 2025 data ties the benchmark exercise to a business outcome most of these tables leave implicit: companies leading their industry's NPS delivered roughly 2.9 times the total shareholder return of the rest of their industry over a ten-year window, and in U.S. grocery specifically, the category leader delivered 5 times the industry-average return. In consumer banking, industry-average NPS sits at 33, and institutions above that line - most often digital banks at 41 - grew their primary account share at roughly 8 times the rate of those below it.
| NPS leadership signal (NPS Prism 2025) | Outcome |
|---|---|
| NPS leaders vs. rest of industry, 10-year TSR | ~2.9x greater shareholder return |
| US grocery category leader vs. industry average | 5x greater shareholder return |
| Banks above 33 NPS (industry avg) vs. below | ~8x primary account share growth rate |
Where an analyst should stop trusting a benchmark
None of the four datasets in this piece agree closely enough to be swapped for one another, and that is the correct takeaway rather than a flaw in any single one. Use the direction (is our score above or below the closest-matching sample), not the exact digit, and re-run the same comparison every quarter against the same source so at least the trend line is internally consistent even when the absolute number moves depending on which benchmark table gets cited. Note the sample size, the scoring method (median or average), and whether the figure is blended or split by B2B/B2C every time a number from this page - or any other NPS benchmark page - gets quoted in a deck.
Frequently Asked Questions
What is a good NPS score by industry?
There is no single good score - it depends on the industry's median. Survicate's 2025 survey of 599 companies and 5.4 million responses puts the cross-industry median NPS at 42, with Manufacturing at the top (65) and Software at the bottom (30). A software company scoring 35 is above its own industry median; a manufacturing company scoring 35 is well below its industry's. Always compare against the same industry's benchmark, not a universal number.
Why does software have the lowest average NPS?
A wide B2B-versus-B2C gap pulls the blended average down. Survicate's 2025 data shows Software's overall median at 30, but that hides an 18-point split: B2C software scores 47 while B2B software scores just 29. B2B software buyers expect deep integrations, extensive feature sets and reliable support under higher operational stakes, which is a harder bar to clear consistently than a simpler consumer app.
Why do B2C companies generally outperform B2B on NPS?
Emotional simplicity beats operational complexity, on average. Survicate's 2025 data shows B2C at a median NPS of 49 against B2B's 38, an 11-point gap. Healthcare shows the widest split of any industry measured, at 70 for B2C versus 38 for B2B - consumer healthcare experiences are judged on personal wellbeing outcomes, while B2B healthcare (software, services) is judged on far more exacting operational criteria.
Why do NPS benchmarks from different sources disagree?
Sample composition and methodology differ. Survicate's 2025 benchmark draws median scores from 599 companies across 11 industries, all company sizes blended. Retently's 2026 benchmark is built only from its own client base (minimum 10 clients and 10,000 surveys per included industry) and reports average, not median, scores for B2B accounts specifically. Retently's Financial Services figure (68) and Survicate's Fintech figure (46) are measuring different populations under the same-sounding label - check the sample before citing either as your target.
How should an analyst actually use these benchmark tables?
Match survey methodology as closely as possible to your own before comparing: if you survey only B2B accounts, weight the Retently or the Survicate B2B-only column more heavily than the blended median. Then track your own score's trend quarter over quarter - Survicate's 2025 data shows the bottom decile of companies actually getting worse year over year (from -0.3 to -4), so external benchmarking should supplement, not replace, watching your own trajectory.
Sources
Survicate - NPS Benchmarks 2025: What is a good Net Promoter Score?
Retently - What is a good Net Promoter Score? (2026 NPS Benchmark)
Qualtrics XM Institute - 2024 customer ratings, consumer NPS by industry
NPS Prism - U.S. Cross-Industry Benchmarks Report, 2025

