Table of contents

A veterinary marketing dashboard is worth building only if it changes a decision. In 2026 the numbers that do that are known, the benchmark ranges are published, and the reporting work can be automated - yet 78% of veterinary professionals still cannot say what a new client costs them. Here is the data behind a one-page practice scorecard.
Key Takeaways
- Benchmark ranges across 240+ clinics: 35-75 new clients per month, 68-82% retention, $145-$285 average invoice, 6-12% annual revenue growth.
- Median revenue per full-time veterinarian is about $550,000; general practice targets run $700,000-$850,000 per doctor in small animal work.
- Industry revenue grew 2.6% in 2025 while transactions fell 4.7% and average transaction charge rose 7.5% - fewer visits, bigger invoices.
- Practices with an analytics and finance partner grew 6.7% against that 2.6% average; under-$2.5M practices grew 8.6%.
- Analytics adopters report 12-18% higher revenue per FTE veterinarian and 40-60% more revenue-recovery opportunities than PIMS reporting alone.
- 78% do not track cost per new client and 36% have no documented marketing plan (survey of 400 veterinary professionals).
- Manual marketing reporting eats 15+ hours per week; automation reclaims 10-15 hours, worth $24,000-$58,500 a year in labour.
- Gartner: 37% of marketing decisions rest on incomplete or incorrect data; manual data-entry error rates run 1-4%.
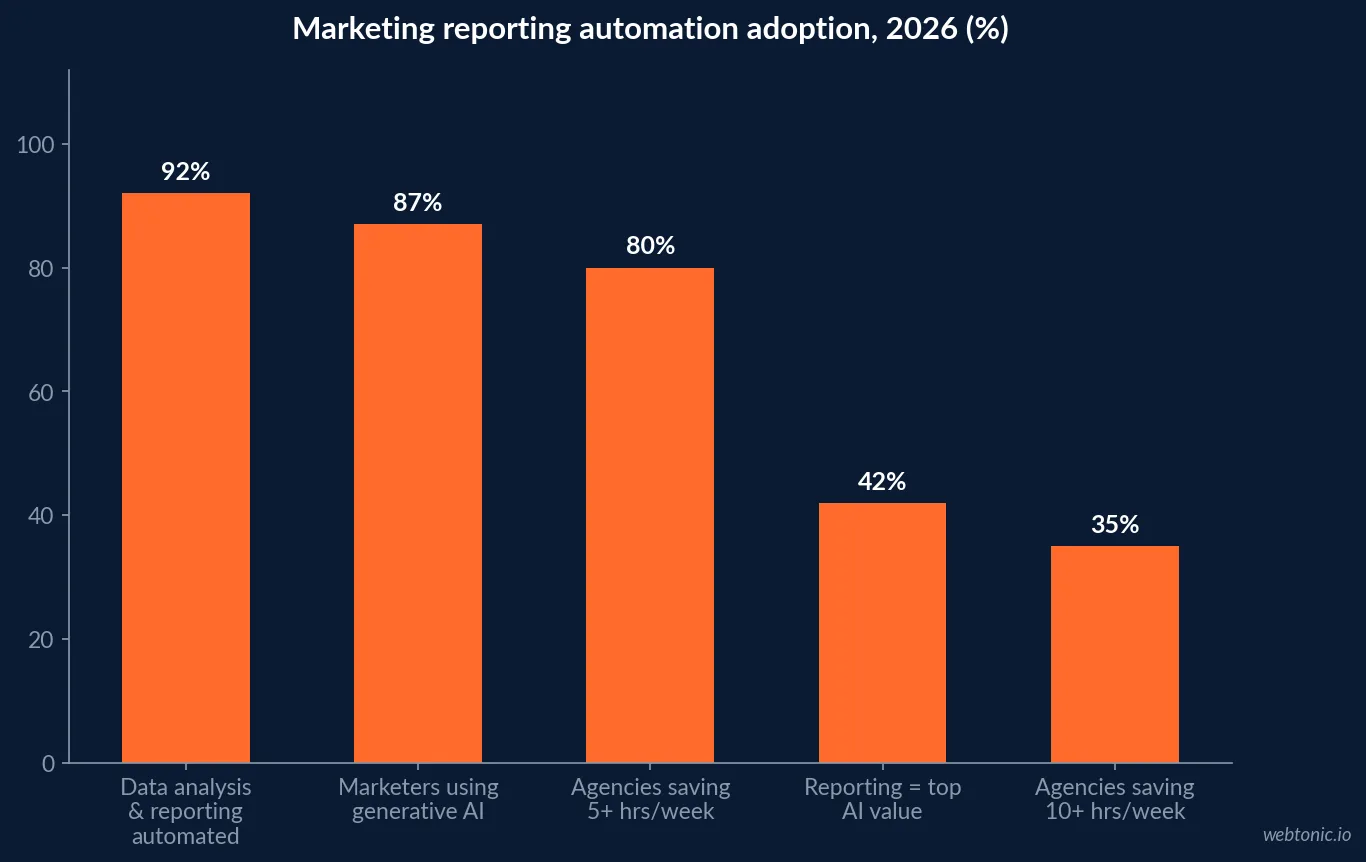
- 42% of agencies say reporting and performance summaries are where AI has delivered the most value, and 80% now save 5+ hours a week.
- A three-doctor practice with a 15% overdue rate sits on $66,600 of dormant wellness revenue; annual leakage runs $18,000-$75,000.
- Veterinary analytics tooling costs $199-$349 per month for most single-site practices.
The twelve numbers, with 2026 benchmark ranges
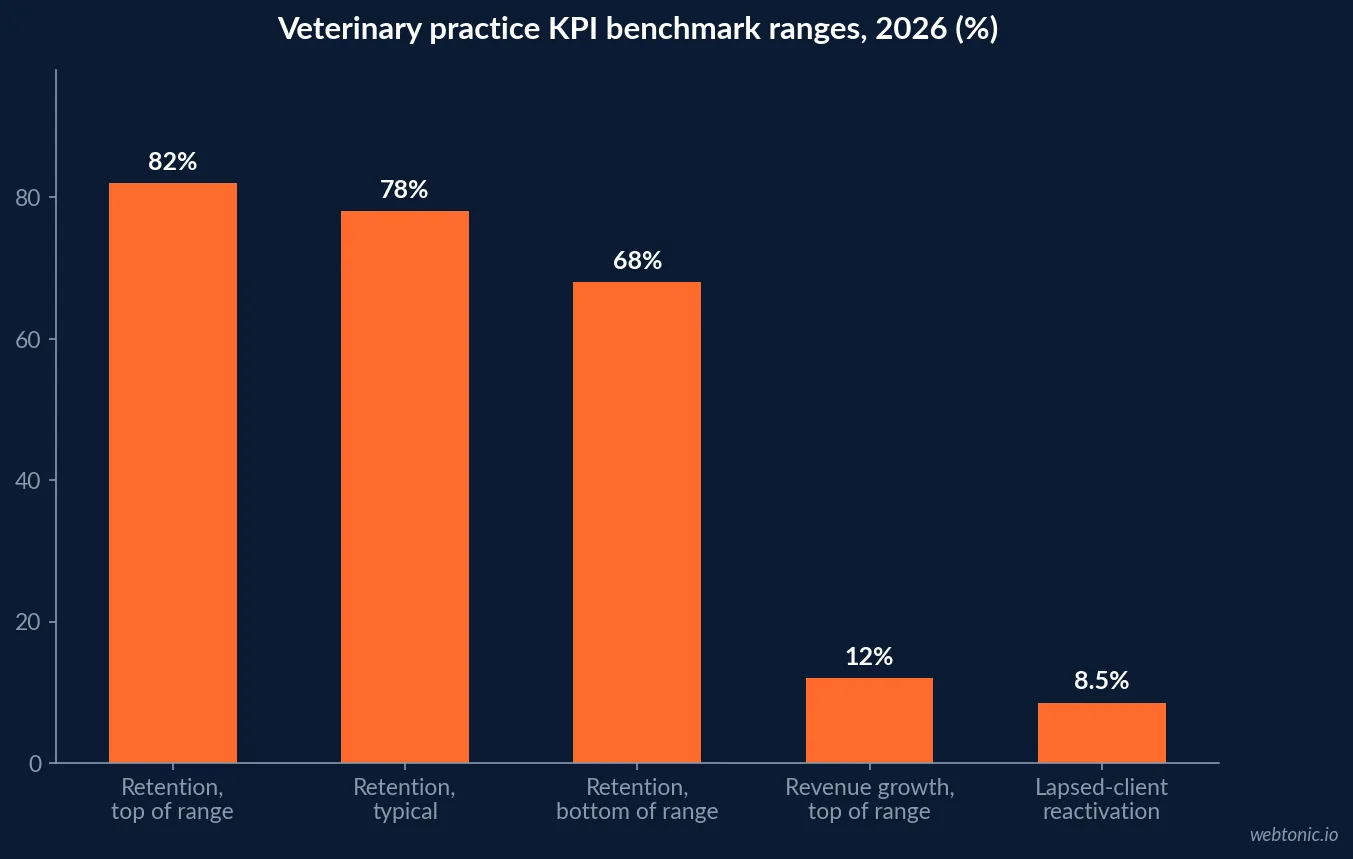
Most veterinary dashboards fail in one of two directions: forty widgets nobody reads, or one revenue line with no explanation. The workable middle is a dozen metrics with a published comparison. Benchmarking data drawn from 240+ veterinary clinics by BizMetricsHQ puts new clients per month at 35-75, retention at 68-82%, average invoice at $145-$285 and revenue growth at 6-12% a year, with median practice revenue of $1.2M (range $600K-$1.8M), median revenue per veterinarian near $550,000 and a typical active client worth $350-$900 per year over four to seven years.
| Dashboard metric | 2026 benchmark range | Why it belongs on the page |
|---|---|---|
| New clients per month | 35-75 | The only true growth input |
| Cost per new client | Tracked by 22% of practices | Sets every budget ceiling |
| Average invoice / ATC | $145-$285 (benchmark ~$230) | Case mix and pricing health |
| Revenue per FTE veterinarian | ~$550K median | Capacity, not marketing, is often the cap |
| Annual client retention | 68-82% (78% typical) | Cheapest growth lever in the practice |
| Lapsed-client reactivation | 8.5% | Direct line to dormant revenue |
| Visits per patient per year | 2.8 dogs / 1.6 cats | Compliance early-warning signal |
| Revenue growth | 6-12%/yr | Compare against 2.6% industry average |
| Gross / EBITDA margin | 70-80% / 15-22% | Tells you if growth is profitable |
| Landing page conversion rate | 10.5% vs 4.2% site-wide | Where paid traffic should land |
| Click-to-call rate | 18.3% | Mobile is 72.4% of veterinary traffic |
| Reminder email open rate | 38.4% (reminders to 65%) | Retention engine, cheapest channel |
Why the revenue line lies without the transaction line
The single most useful pairing on a veterinary dashboard in 2026 is revenue beside transaction count. The 2026 Veterinary Industry Benchmark Report found revenue up 2.6% in 2025 while transaction volume fell 4.7% nationally and average transaction charge rose 7.5%, driven by diagnostics and higher-value medical services rather than product sales. A practice looking only at gross revenue reads that as a flat year. A practice looking at both reads it correctly: fewer visits, priced higher, with a retention problem building underneath.
Profitability benchmarks give the second guardrail. Practice-finance analysis from VetCPA places gross margin at 70-80%, EBITDA margin at 10-18% with top-tier practices at 20-25%, and net operating margin at 8-15%, noting that practices below 10% EBITDA are now viewed as operationally stressed in high-cost metros. Revenue targets per doctor, per veterinary benchmarking guidance, run $700,000-$850,000 for small animal practices and $250,000-$375,000 for large animal.
The measurement baseline: most practices are flying without instruments
Dashboards only matter if the inputs exist. A 2026 survey of 400 veterinary professionals summarised in CUFinder’s veterinary benchmark set found 78% do not track what a new client costs and 36% have no documented marketing plan. Adoption of the underlying systems is far higher than adoption of the reporting: AVMA figures compiled by Digitail show 76.5% of practices run practice management software, only 59.9% use integrated client-communication software, and fewer than one in three offer online scheduling. The data is captured; it is simply never joined.
The same benchmark set supplies the marketing-side inputs a dashboard needs: mobile traffic at 72.4%, bounce rate 54.8%, landing page conversion 10.5% against 4.2% site-wide, click-to-call 18.3%, Google Ads conversion rate 12.6% at a $3.45 CPC, animal-care paid search cost per lead of $31.50 against a $66.69 cross-industry average, retention 78% and reactivation 8.5%. Cross-check any of these against your own numbers in our veterinary analytics statistics.
What the reporting layer costs - and what it recovers
This is the part practice owners underestimate in both directions. Tooling analysis citing AAHA 2025 State of the Profession data, compiled by US Tech Automations, reports 12-18% higher annual revenue per FTE veterinarian among analytics users, 15-25% more appointment reactivation opportunities identified per quarter, and 40-60% more revenue-recovery opportunities than practice management reporting alone. Purpose-built veterinary platforms in that review price at $199 per month up to 2,000 patients and $349 per month up to 5,000.
Against that: revenue leakage from undetected overdue patients of $18,000-$75,000 a year for a three-doctor practice, of which 40-60% is recoverable, a modelled $66,600 of dormant wellness revenue at a 15% overdue rate, and a reported $22,000 average first-year recovery for practices that add an analytics layer. Reporting is not overhead in this market. It is a channel.
| Reporting investment | Cost | Reported return |
|---|---|---|
| Veterinary analytics platform (small) | $199/month | Compliance and recall gap reporting |
| Veterinary analytics platform (mid) | $349/month | Revenue recovery, custom reports |
| Marketing dashboard stack (small team) | $100-$500/month | One source of truth across channels |
| Marketing dashboard stack (mid-market) | $500-$2,000/month | Blended CAC and channel modelling |
| Analytics adoption | n/a | 12-18% more revenue per FTE DVM |
| Reactivation reporting | n/a | 15-25% more opportunities per quarter |
| First-year recovery (vendor benchmark) | n/a | ~$22,000 from compliance gaps |
| Doing nothing | $0 | $18,000-$75,000 annual leakage |
The reporting time tax
Practices rarely skip reporting because they doubt its value; they skip it because someone has to build it. Analysis from MarketerHire puts manual marketing reporting at 15+ hours per week, with manual data-entry error rates of 1-4% and a Gartner finding that 37% of marketing decisions are based on incomplete or incorrect data. Automating the pull reclaims 10-15 hours a week - modelled at $24,336 a year for a single mid-level marketer and up to $58,500 at higher loaded costs.
Agency-side data confirms the pattern at scale. The 2026 agency benchmarks report found reporting and performance summaries are the number one area where AI has delivered value, cited by 42% of agencies, that 80% now save five or more hours a week and 35% save ten or more, and that 97% rate accurate reporting as important for client retention while 84% still want clear visuals above all. Automation benchmarks from Data-Mania add the adoption picture: 87% of marketers now use generative AI in at least one recurring workflow (up from 51% in 2024), data analysis and reporting sit at 92% adoption, only 9% of organisations are fully automated, and marketing automation returns a modelled $5.44 per $1 over three years.
Review cadence: what to look at, and how often
Cadence beats sophistication. A defensible rhythm for a single-site practice:
- Weekly (5 minutes): spend, leads by source, calls answered, new clients booked. Catch a broken form or a runaway campaign inside seven days, not thirty.
- Monthly (30 minutes): cost per new client, average invoice, revenue per doctor, retention, reactivation. Compare against the 35-75 new clients and 68-82% retention ranges rather than against last month alone.
- Quarterly (half a day): benchmark against industry data, review overdue patient lists, re-plan budget. This is where the 8.5% reactivation rate gets attacked deliberately.
- Annually: margin structure, valuation inputs, capacity. With EBITDA medians near 19%, small operating changes move practice value more than ad spend does.
One rule matters more than the calendar: every automated dashboard needs a short written summary attached. A refreshed chart nobody interprets changes nothing; two sentences saying "cost per new client rose 22% because we shifted budget to cold audiences" changes the next decision. For the channel-level inputs behind those sentences, see our veterinary Google Ads statistics and local SEO benchmarks.
The signal loss nobody put on the dashboard
Two structural changes make 2026 dashboards harder to trust than 2022 dashboards. First, privacy: marketing analytics research collated by Digital Applied reports that regulation and browser restrictions have removed 30-40% of previously trackable conversions, with server-side tracking and first-party data recovering 60-75% of that loss. Second, discovery: a growing share of new clients arrive after an AI assistant recommended a clinic, landing in your reports as direct or branded traffic with no path attached.
The practical response is not a more elaborate model. It is to instrument the things that still resolve cleanly - phone calls with source tagging, booking confirmations, arrivals, invoiced revenue - and to hold one honest "unattributed" row on the dashboard rather than pretending the last-click number is complete. Our veterinary attribution statistics cover that plumbing in detail.
Limits of this data
Benchmark ranges here come from mixed samples: 240+ clinics for the KPI ranges, national benchmark reporting for revenue and transaction trends, a 400-professional survey for the tracking gaps, and vendor-published figures for analytics uplift. Vendor uplift numbers (12-18% per doctor, 40-60% more recovery opportunities, $22,000 first-year recovery) come from companies selling analytics, and self-selection is real: practices that buy reporting tend to be better run before they buy it. Margin and revenue-per-doctor benchmarks vary sharply by region, case mix and ownership model, so treat the ranges as orientation and your own trend line as the truth. The reporting-time and automation figures are cross-industry marketing data, not veterinary-specific.
Frequently Asked Questions
What should be on a veterinary marketing dashboard?
Twelve numbers cover almost every decision a practice makes: new clients per month, cost per new client, cost per booked patient, average transaction charge, revenue per full-time equivalent veterinarian, annual client retention rate, lapsed-client reactivation rate, visits per patient per year, calls versus online bookings, landing page conversion rate, reminder email open rate, and overdue-wellness patient count. Benchmark ranges for 2026 sit at 35-75 new clients a month, $145-$285 average invoice, 68-82% retention and roughly $550,000 revenue per veterinarian.
How often should a veterinary practice review its marketing numbers?
Weekly for spend and lead flow, monthly for revenue and retention, quarterly for benchmarking. The problem is not the cadence in theory but the effort in practice: manual marketing reporting consumes 15 or more hours per week in teams that have not automated it, and Gartner has found 37% of marketing decisions are made on incomplete or incorrect data. A dashboard that refreshes itself turns a monthly ritual into a five-minute weekly glance.
What does a veterinary reporting or analytics layer cost?
Purpose-built veterinary analytics platforms typically run $199 per month for practices up to 2,000 patients and around $349 per month up to 5,000, with custom pricing for multi-site groups. Generic marketing reporting stacks cost $100-$500 per month for a small team (Looker Studio plus a connector) and $500-$2,000 per month at mid-market scale. Against a reported $18,000-$75,000 of annual revenue leakage from undetected overdue patients at a three-veterinarian practice, the line item is small.
Do veterinary practices that track numbers actually grow faster?
The available data says yes, with the usual self-selection caveat. Practices working with a dedicated analytics and finance partner averaged 6.7% revenue growth in 2025 against a 2.6% industry average, and those under $2.5M in revenue grew 8.6%. Separately, practices using analytics tools show 12-18% higher annual revenue per full-time equivalent veterinarian and identify 40-60% more revenue-recovery opportunities than practices relying on practice management software reporting alone.
What is a good average transaction charge for a veterinary practice in 2026?
Around $230 is the commonly cited national benchmark, and average invoice ranges of $145-$285 appear across benchmarking datasets depending on case mix and market. More useful than the absolute number is the direction: average transaction charge rose 7.5% in 2025 while transaction volume fell 4.7%, so a practice with flat revenue is almost certainly seeing fewer visits at higher prices - which is a retention problem showing up in a revenue metric.
Bottom line
A veterinary marketing dashboard does not need to be clever. Twelve numbers, published benchmark ranges beside them, a weekly five-minute look and a two-sentence written summary will outperform any quarterly slide deck - and the practices already doing it are growing at multiples of the industry average. Our data intelligence team builds these scorecards for clinics and groups; get in touch if you want yours built once and maintained.
Sources
BizMetricsHQ - Veterinary clinic KPI benchmarks (240+ clinics)
iVET360 - 2026 Veterinary Industry Benchmark Report
VetCPA - Veterinary practice benchmarks in 2026
Veterinary Business Guide - Practice benchmarking guide
CUFinder - Veterinarians marketing benchmarks 2026
Digitail - Veterinary statistics and findings 2026
US Tech Automations - Reporting and analytics software for veterinary clinics
MarketerHire - Marketing reporting automation
AgencyAnalytics - 2026 agency benchmarks report
Data-Mania - AI marketing operations automation benchmarks 2026
Digital Applied - Marketing analytics statistics 2026