Table of contents
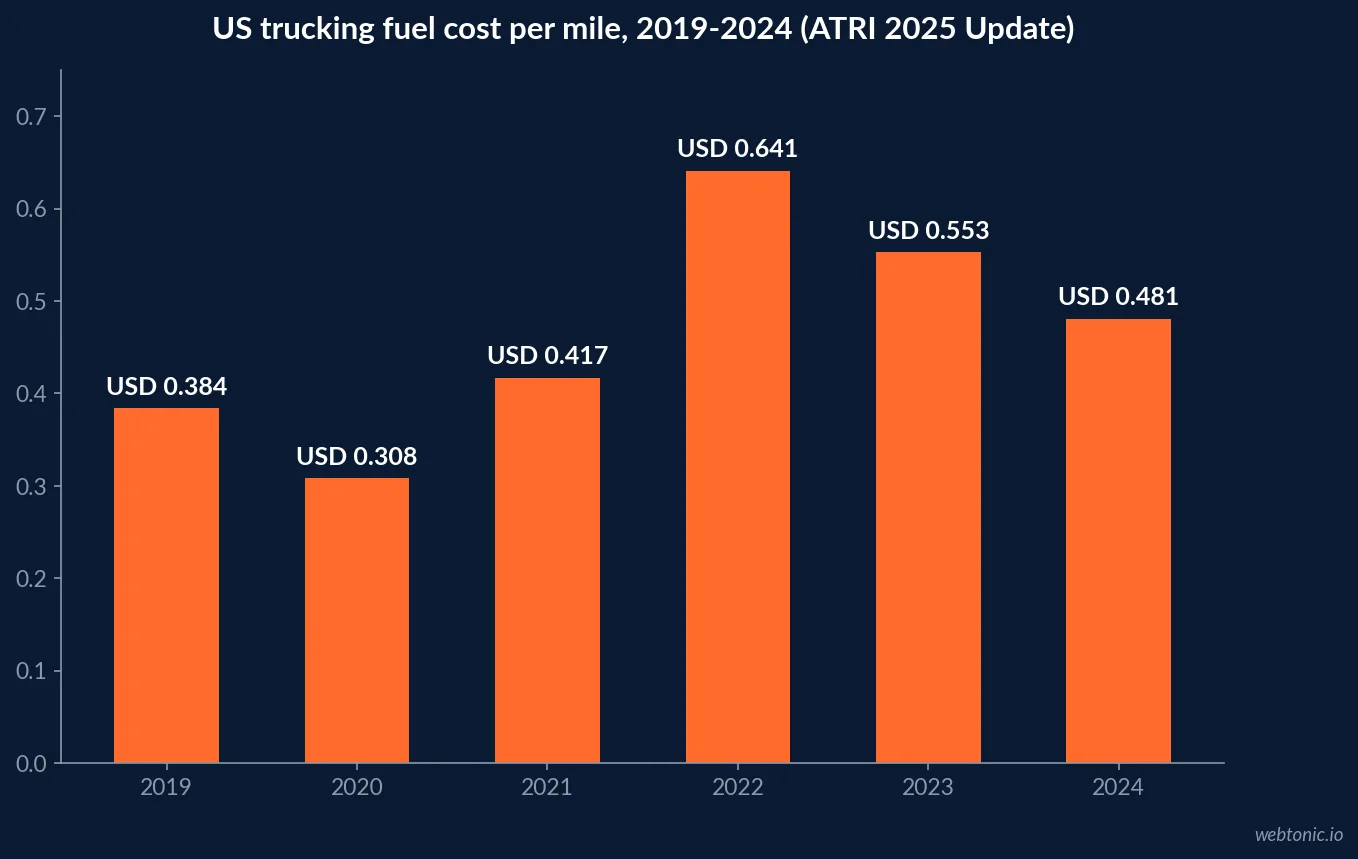
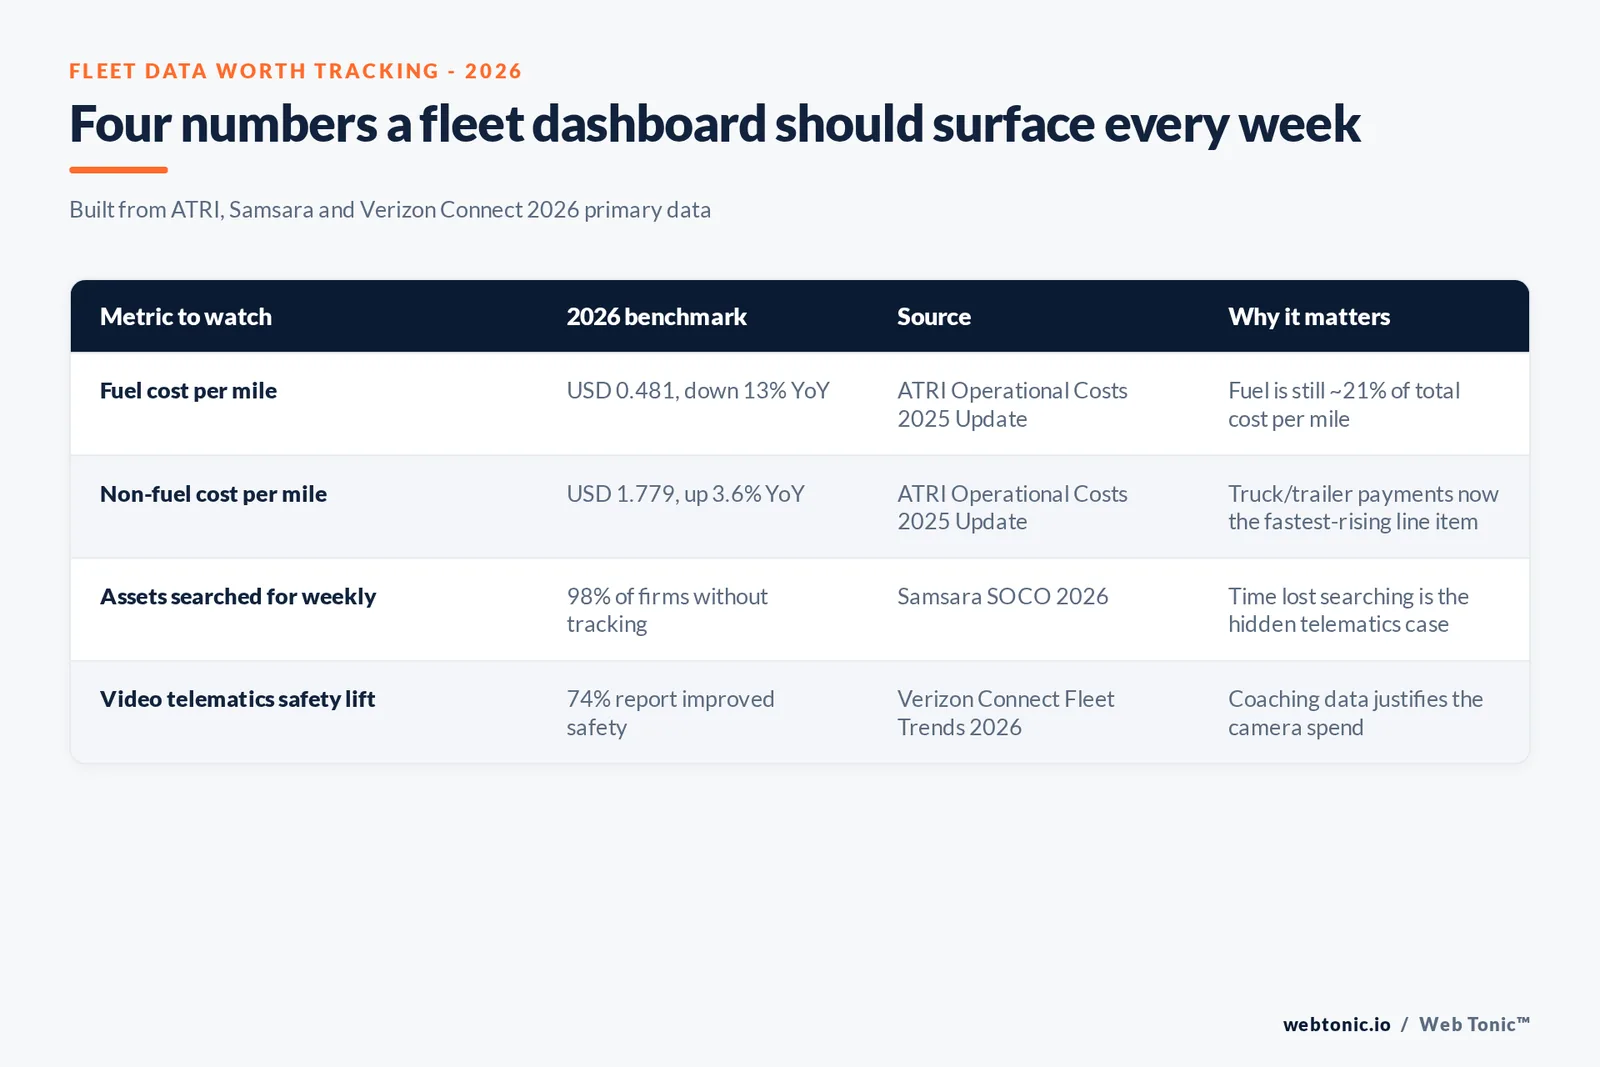
Fuel cost fell 13.0% to USD 0.481 a mile in 2024, yet total trucking operating cost barely moved because everything else got more expensive. That single tension - one line item improving while the rest of the cost stack climbs - is exactly what fleet analytics programs exist to catch before it shows up as a missed margin target.
Key Takeaways
- Fuel cost per mile fell to USD 0.481 in 2024, a 13.0% year-over-year drop (ATRI).
- Total operating cost per mile was USD 2.260 in 2024, down just 0.4% on the year.
- Non-fuel operating cost rose 3.6% to USD 1.779 a mile, a record high.
- Truck and trailer payments rose 8.3% to USD 0.390 a mile, the fastest-rising line item.
- Driver wages reached USD 0.798 a mile, up 2.4% and also a new record.
- Total per-hour operating cost hit USD 90.89 in 2024, versus USD 62.98 in 2015.
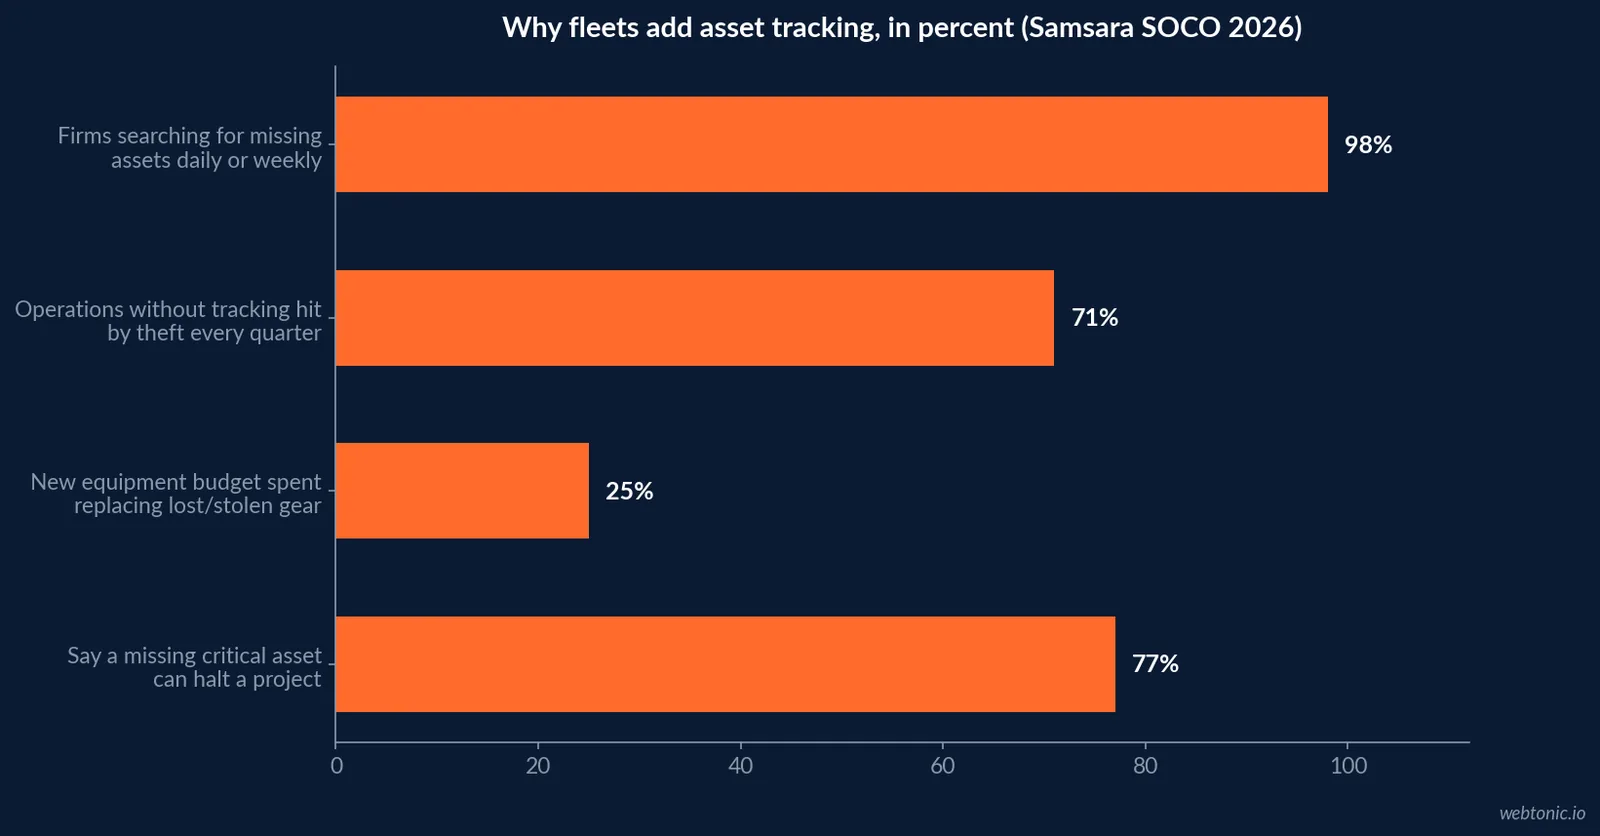
- 71% of operations without asset tracking report equipment theft every quarter (Samsara).
- Untracked operations lose USD 13.2 million a year on average to missing assets.
- 72% of that loss comes from items under USD 10,000 - tools and sensors, not trucks.
- 98% of firms without real-time visibility say searching for assets is a weekly occurrence.
- 74% of fleets say video telematics improved driver safety (Verizon Connect, 2026).
- 41% call video telematics very or extremely beneficial for driver coaching.
- Heavy and tractor-trailer drivers earned a median USD 57,440 in 2024 (BLS).
- Logisticians earned a median USD 80,880 and the role is projected to grow 17% (BLS).
- 241,000 people worked as logisticians in the US in 2024, per BLS projections.
- For-hire trucking was 69.3% of all registered carriers in ATRI's 2024 data.
Why fuel and analytics sit in the same dashboard
Fuel is the most volatile line in a trucking budget and the easiest one to blame when margins slip. But the American Transportation Research Institute's (ATRI) 2025 Update shows the opposite problem hit fleets in 2024: fuel improved and total cost barely moved, because five other line items - truck and trailer payments, insurance, tires, tolls and driver pay - all set new record highs in the same year. A tracking and analytics program that only watches miles-per-gallon misses where the money actually went.
The 2024 cost-per-mile breakdown
ATRI's cost model is the industry's longest-running, based on motor carrier financial data collected directly from fleets. Its 2024 marginal cost table is the cleanest single reference for what a dashboard should reconcile against every month.
| Cost line item | 2024 (USD/mile) | 2023 (USD/mile) | YoY change |
|---|---|---|---|
| Fuel | 0.481 | 0.553 | -13.0% |
| Truck/trailer lease or purchase | 0.390 | 0.360 | +8.3% |
| Driver wages | 0.798 | 0.779 | +2.4% |
| Driver benefits | 0.197 | 0.188 | +4.8% |
| Repair and maintenance | 0.198 | 0.202 | -2.0% |
| Truck insurance premiums | 0.102 | 0.099 | +3.0% |
| Tolls | 0.038 | 0.034 | +11.8% |
| TOTAL | 2.260 | 2.270 | -0.4% |
A decade of the same table tells the real story
Looking at one year hides how much structural cost has shifted. Total operating cost per mile has risen 43% since 2015 (USD 1.575 to USD 2.260), and total cost per hour has risen 44% (USD 62.98 to USD 90.89). Fuel is actually a smaller share of the mile-cost than it was a decade ago in dollar terms during low-price years, which is exactly why fleets that track only fuel burn under-report their real cost trend.
| Year | Fuel (USD/mile) | Non-fuel (USD/mile) | Total (USD/mile) |
|---|---|---|---|
| 2015 | 0.403 | 1.172 | 1.575 |
| 2018 | 0.433 | 1.388 | 1.821 |
| 2021 | 0.417 | 1.438 | 1.855 |
| 2022 | 0.641 | 1.610 | 2.251 |
| 2023 | 0.553 | 1.717 | 2.270 |
| 2024 | 0.481 | 1.779 | 2.260 |
What analytics catches that a fuel card doesn't
Fuel cards and ELD feeds cover miles and gallons. They rarely cover the smaller assets - trailers, tools, generators, sensors - that Samsara's 2026 State of Connected Operations report found are the real cost sink. The study, based on 1,500 financial executives at mid-size operations across construction, logistics and field services, found that fleets without real-time asset visibility lose an average of USD 13.2 million a year to theft, loss and the operational drag of searching for missing gear.
| Asset visibility finding | Value | Source |
|---|---|---|
| Operations hit by theft every quarter (no tracking) | 71% | Samsara SOCO 2026 |
| Average annual cost of missing/stolen assets | USD 13.2M | Samsara SOCO 2026 |
| Share of loss from sub-USD 10,000 items | 72% | Samsara SOCO 2026 |
| Firms searching for assets daily or weekly | 98% | Samsara SOCO 2026 |
| New equipment budget spent replacing lost gear | 25% | Samsara SOCO 2026 |
Video telematics: what fleets that already use it report
The Verizon Connect 2026 Fleet Technology Trends Report, now in its sixth year and fielded with Bobit Business Media between June and July 2025, is self-reported by fleets already running the technology - so treat it as a satisfaction read, not a controlled trial. Within that frame, 74% said video telematics improved driver safety and 41% called it very or extremely beneficial for coaching sessions. Geotab's 2026 State of Commercial Transportation report, drawn from one of the largest commercial vehicle telematics datasets, describes the same shift industry-wide: a move from reactive fuel-and-mileage tracking toward predictive safety modeling that isolates high-risk driving patterns before an incident happens.
Detention and congestion: the analytics case shippers ignore
Fuel and assets are only part of the cost picture. ATRI's dedicated Costs and Consequences of Truck Driver Detention analysis defines detention precisely - any dwell time at a customer facility beyond two hours - and ATRI's companion 2025 Top Industry Issues survey keeps driver compensation and truck parking inside its top five industry concerns for a third straight year, with the Economy ranked the number-one concern. A fleet that logs dwell time by customer location - not only by route - turns a driver complaint into a renegotiation data point with a shipper.
| Trucking labor metric | 2024 figure | Source |
|---|---|---|
| Heavy/tractor-trailer driver median annual wage | USD 57,440 | BLS OOH, May 2024 |
| Heavy/tractor-trailer driver employment | 2,235,100 | BLS OOH |
| Projected driver employment growth, 2024-2034 | 4% | BLS OOH |
| Logistician median annual wage | USD 80,880 | BLS OOH |
| Logisticians employed, 2024 | 241,000 | BLS OOH |
| Projected logistician employment growth, 2024-2034 | 17% | BLS OOH |
Reading these sources as one program, not five reports
None of ATRI, Samsara, Geotab, Verizon Connect or BLS set out to be read together, so a fleet analytics lead has to reconcile scope and method before mixing their numbers into one dashboard. ATRI's cost data is financial-record-based and industry-wide; Samsara's asset-loss figures come from a proprietary survey of 1,500 financial executives at mid-size operations, weighted toward construction, logistics and field services rather than long-haul trucking specifically; Verizon Connect's safety figures are self-reported by fleets already running its own product. Each is credible within its stated scope, but none should be quoted as if it were a single, unified industry census - the honest caveat every one of the figures above carries.
Building the actual dashboard
None of these sources were built to be read as one scorecard, so a fleet has to assemble it. The pattern that holds up across ATRI, Samsara and Verizon Connect data is: watch cost per mile broken into fuel and non-fuel (ATRI's own split), watch asset searches and quarterly theft incidence (Samsara's split), and watch a coaching-outcome metric tied to video events, not just miles driven (Verizon Connect's split). Three splits, three dashboards, one weekly review.
How this compares across fleet sizes
ATRI's cost model is built from a large, sector-tagged respondent base, not a single average. In 2024, for-hire trucking - the focus of the report - represented 69.3% of all registered carriers, with private fleets at 19.6% and dual-authority carriers at 7.3%. The operational sample behind the cost figures above was itself sizable: 178,091 combination truck-tractors, about 5.4% of all registered trucks, that together ran 14.08 billion miles - 7.2% of all US combination-truck vehicle miles traveled that year. A fleet benchmarking its own cost-per-mile against ATRI's figures should first check which of these three carrier types it actually resembles, since private fleets and for-hire carriers do not share the same cost structure even when paying the same price for diesel.
| Carrier type (2024, ATRI respondent base) | Share of registered carriers |
|---|---|
| For-hire trucking | 69.3% |
| Private fleets | 19.6% |
| Both for-hire and private carriage | 7.3% |
What this means for a mid-size fleet's tech budget
None of ATRI, Samsara or Verizon Connect publish what their own tools cost, and no benchmark study prices "a fleet analytics stack" as a single line item - so treat any flat number quoted for that as marketing, not data. What the sourced figures do support is where the budget should be justified: fuel volatility (a 13% swing in one direction, one year) argues for real-time fuel monitoring; the USD 13.2 million average loss for untracked assets argues for expanding telematics past the tractor and onto trailers and tools; and the 74%/41% safety and coaching read argues for keeping video telematics even where drivers push back on the rollout.
Frequently Asked Questions
What does fuel actually cost a trucking fleet per mile in 2026?
The newest full-year figure is 2024, from ATRI's Operational Costs of Trucking 2025 Update: fuel averaged USD 0.481 a mile, down 13.0% from USD 0.553 in 2023 and the largest year-over-year swing of any line item. That single number moves total operating cost more than any other input, which is why fuel-burn analytics are usually the first dashboard a fleet builds.
If fuel fell, why did total trucking costs barely move?
Because everything else kept rising. ATRI's total operating cost per mile actually dropped only 0.4%, from USD 2.270 to USD 2.260, since the seven-cent fuel decline was offset by a 3.6% rise in non-fuel costs to USD 1.779 a mile. Truck and trailer lease or purchase payments rose 8.3% on the year and set a new record high at USD 0.390 a mile - the real reason margins stayed tight even as diesel got cheaper.
Does telematics data actually change safety outcomes, or just record them?
Verizon Connect's 2026 Fleet Technology Trends Report, based on its sixth annual fleet professional survey, found 74% of respondents said video telematics helped improve driver safety and 41% called it very or extremely beneficial for coaching sessions specifically. That is a self-reported outcome from fleets already using the tool, not an independent trial, so read it as directional rather than a guaranteed lift.
What's the actual case for adding asset tracking beyond the trucks themselves?
Samsara's 2026 State of Connected Operations Asset Theft and Loss Report, based on 1,500 financial executives at mid-size operations, found 71% of operations without tracking experience equipment theft every quarter and lose an average of USD 13.2 million a year in direct and indirect costs. Seventy-two percent of that cost comes from small, sub-USD 10,000 items - tools and sensors, not the trucks - which is the blind spot most fleet dashboards still don't cover.
Where does detention and congestion data fit into a fleet analytics program?
ATRI's driver detention research puts the scale in hours, not anecdotes: it separately tracks slack time, dwell time and detention (any wait beyond two hours) at customer facilities, and ATRI's related industry-issue surveys have quantified congestion and detention losses in the hundreds of millions of hours annually across the industry. A fleet that logs dwell time by customer, not just by route, can turn that into a scorecard for renegotiating appointment windows.
Sources
ATRI - An Analysis of the Operational Costs of Trucking: 2025 Update
ATRI - Critical Issues in the Trucking Industry, 2025
ATRI - Costs and Consequences of Truck Driver Detention
Samsara - 2026 State of Connected Operations Asset Theft & Loss Report
Verizon Connect - 2026 Fleet Technology Trends Report
Geotab - 2026 State of Commercial Transportation Report
US Bureau of Labor Statistics - Heavy and Tractor-Trailer Truck Drivers
US Bureau of Labor Statistics - Logisticians
Web Tonic's data intelligence team builds the dashboards that turn feeds like these into a weekly fleet scorecard, alongside growth marketing programs for logistics brands. See cost-per-lead benchmarks by industry for how freight compares to other verticals, or learn more about the team behind this research.