Table of contents

LocaliQ has no category called trucking or logistics, so the closest published paid-search benchmark is Industrial & Commercial - and reading its cost figures against DAT's real per-mile freight rates and ATRI's per-mile cost data is what actually tells a fleet or 3PL whether a Google Ads lead is cheap or expensive. This page builds that comparison with sourced 2026 numbers.
Key Takeaways
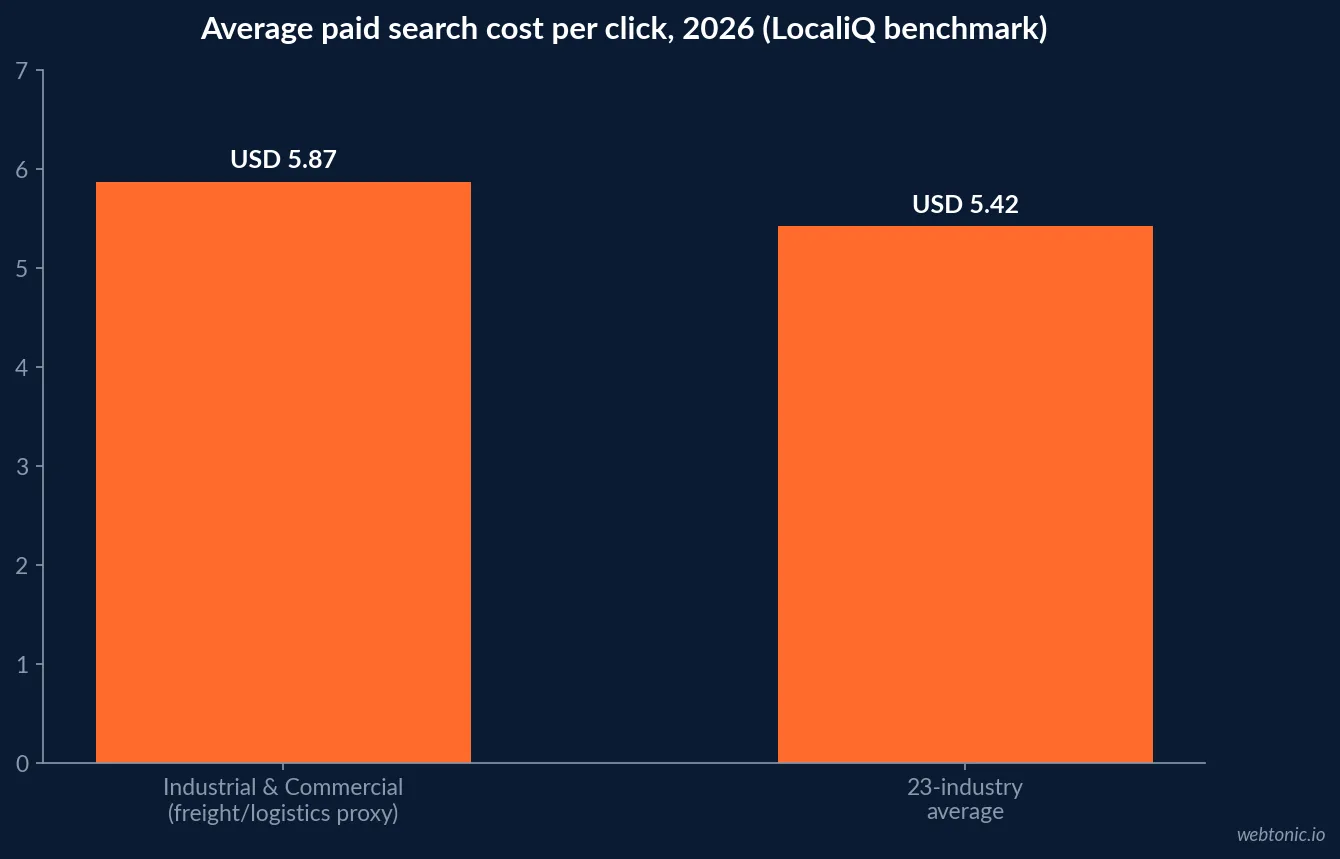
- Industrial & Commercial paid search averages USD 5.87 per click, the closest published proxy for freight and logistics keywords.
- Its average cost per lead is USD 75.19, on an 8.20% conversion rate.
- The cross-industry average cost per click is USD 5.42 across LocaliQ's 23 tracked industries.
- DAT's August 2026 national average dry van spot rate was USD 2.19 a mile, down 20 cents on the month.
- Spot rates still ran more than 30% higher than August 2025 across van, reefer and flatbed equipment.
- The industry-average cost to operate a truck hit USD 2.336 a mile in 2025, the highest in ATRI's reporting history.
- Tolls rose 13.2%, the single fastest-growing operating cost line-item.
- Repair and maintenance costs rose 8.6%, the second-fastest.
- ATA has identified a shortage of 82,000 qualified drivers in 2026, a competing recruiting-ad audience sharing keyword vocabulary with shipper searches.
- Non-driver staffing was cut 7.8% industry-wide in 2025 as carriers controlled costs.
- Only two operating-cost line items rose at sub-inflationary rates in 2025: fuel and driver pay.
- Trucks moved 72.7% of US freight by weight in 2024, on a USD 906 billion gross freight bill.
The closest published cost benchmark, and its limits
No search-advertising study names trucking or logistics as its own category. LocaliQ's 2026 benchmark - built from more than 13,000 US search campaigns running April 2025 through March 2026 - classifies the closest adjacent vertical as Industrial & Commercial: an average cost per click of USD 5.87, a click-through rate of 6.57%, a conversion rate of 8.20%, and a cost per lead of USD 75.19. That compares with a cross-industry average CPC of USD 5.42 and average CTR of 6.64% - Industrial & Commercial sits close to the mean on cost, slightly above it on lead-to-conversion quality.
Treat this as a directional proxy, not an exact freight quote. Branded carrier terms, urgent same-day freight searches, and named-lane queries ("Dallas to Phoenix flatbed") typically run above this average; broad industry terms typically run below it.
| Metric (2026, LocaliQ) | Industrial & Commercial | 23-industry average |
|---|---|---|
| Cost per click | USD 5.87 | USD 5.42 |
| Click-through rate | 6.57% | 6.64% |
| Conversion rate | 8.20% | 8.18% |
| Cost per lead | USD 75.19 | n/a (varies by industry) |
What one converted lead is actually worth
A USD 75.19 lead only makes sense against what a booked load pays. DAT Freight & Analytics reported the national average dry van spot linehaul rate at USD 2.19 a mile in August 2026 (down 20 cents on the month, the steepest July-to-August pullback in DAT's 16-year history), with reefer at USD 2.61 and flatbed at USD 2.70. Despite the monthly pullback, spot rates remained more than 30% higher than August 2025 across all three equipment types. A single 500-mile dry van load at the August average grosses roughly USD 1,095 before a carrier's own operating costs - a scale that makes a USD 75.19 lead cost a rounding error against one converted load, and a real problem only if leads are not converting to bookings at all.
| DAT spot linehaul rate, August 2026 | Rate per mile | Change on July | vs. August 2025 |
|---|---|---|---|
| Dry van | USD 2.19 | -USD 0.20 (-8.4%) | +30%+ |
| Reefer | USD 2.61 | -USD 0.14 (-5.1%) | +30%+ |
| Flatbed | USD 2.70 | -USD 0.20 (-6.9%) | +30%+ |
The operating-cost side of the ledger
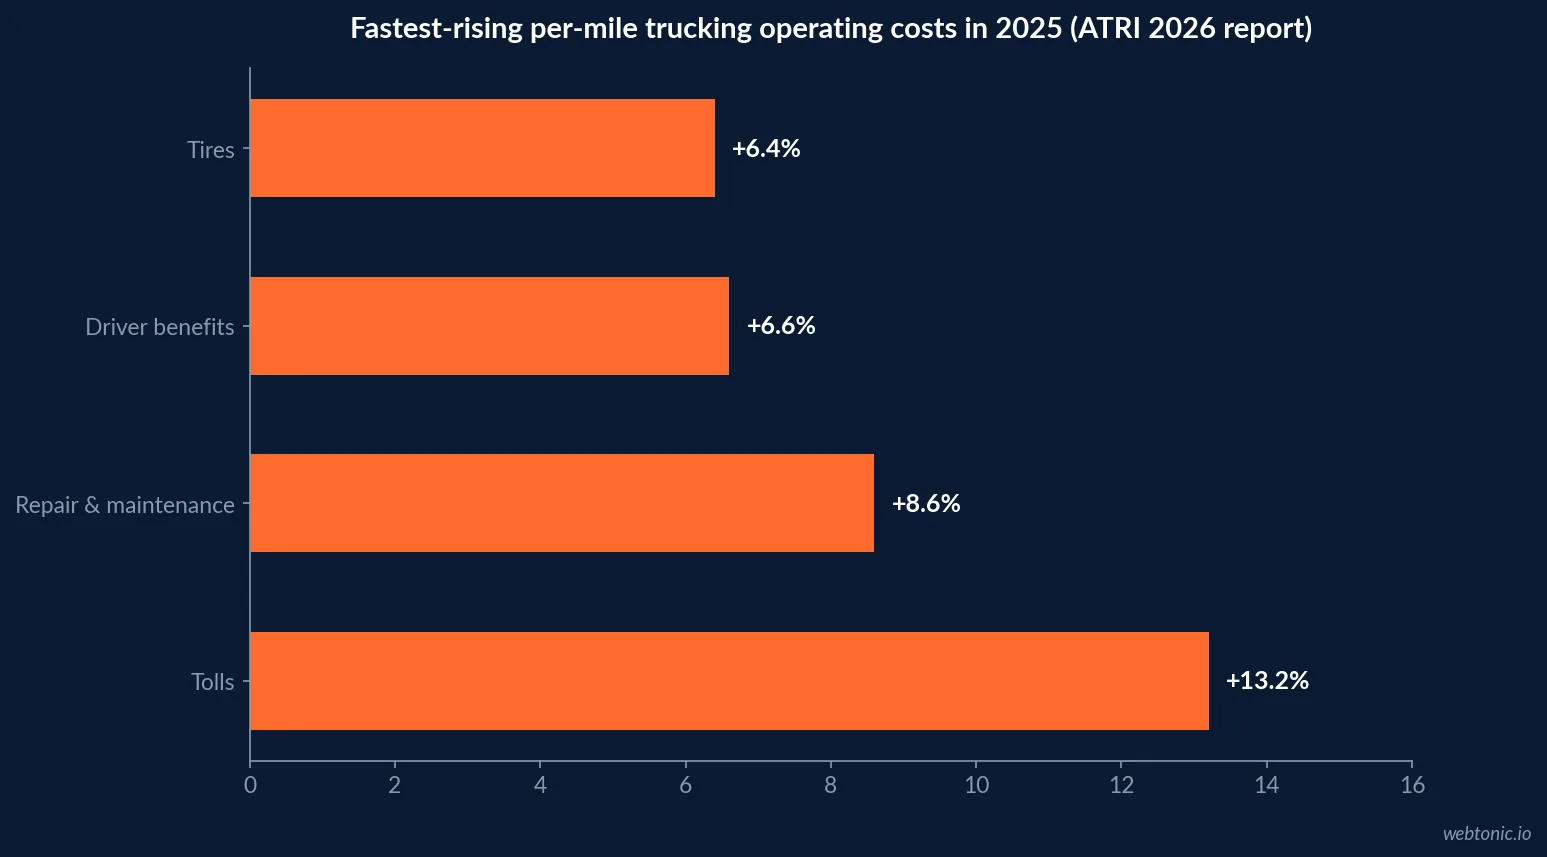
ATRI's 2026 Analysis of the Operational Costs of Trucking found the industry-average cost to operate a truck reached USD 2.336 per mile in 2025, up 3.4% and the highest since the report began in 2016. Costs rose across nearly every category, led by tolls (+13.2%), repair and maintenance (+8.6%), driver benefits (+6.6%) and tires (+6.4%). Only fuel and driver pay grew at sub-inflationary rates. Facing that cost pressure, carriers cut truck counts 2.4% and non-driver staffing 7.8% in 2025.
This is the backdrop a Google Ads budget has to justify itself against: a fleet already cutting headcount to manage per-mile costs is not going to tolerate a lead-gen channel with a bloated, unmeasured cost per booked load.
| ATRI 2026 operating-cost line item | 2025 change | Rank among rising costs |
|---|---|---|
| Tolls | +13.2% | Fastest-rising |
| Repair and maintenance | +8.6% | Second-fastest |
| Driver benefits | +6.6% | Third-fastest |
| Tires | +6.4% | Fourth-fastest |
| Fuel and driver pay | Sub-inflationary | Only two categories that eased |
The keyword-intent problem this vertical has and most do not
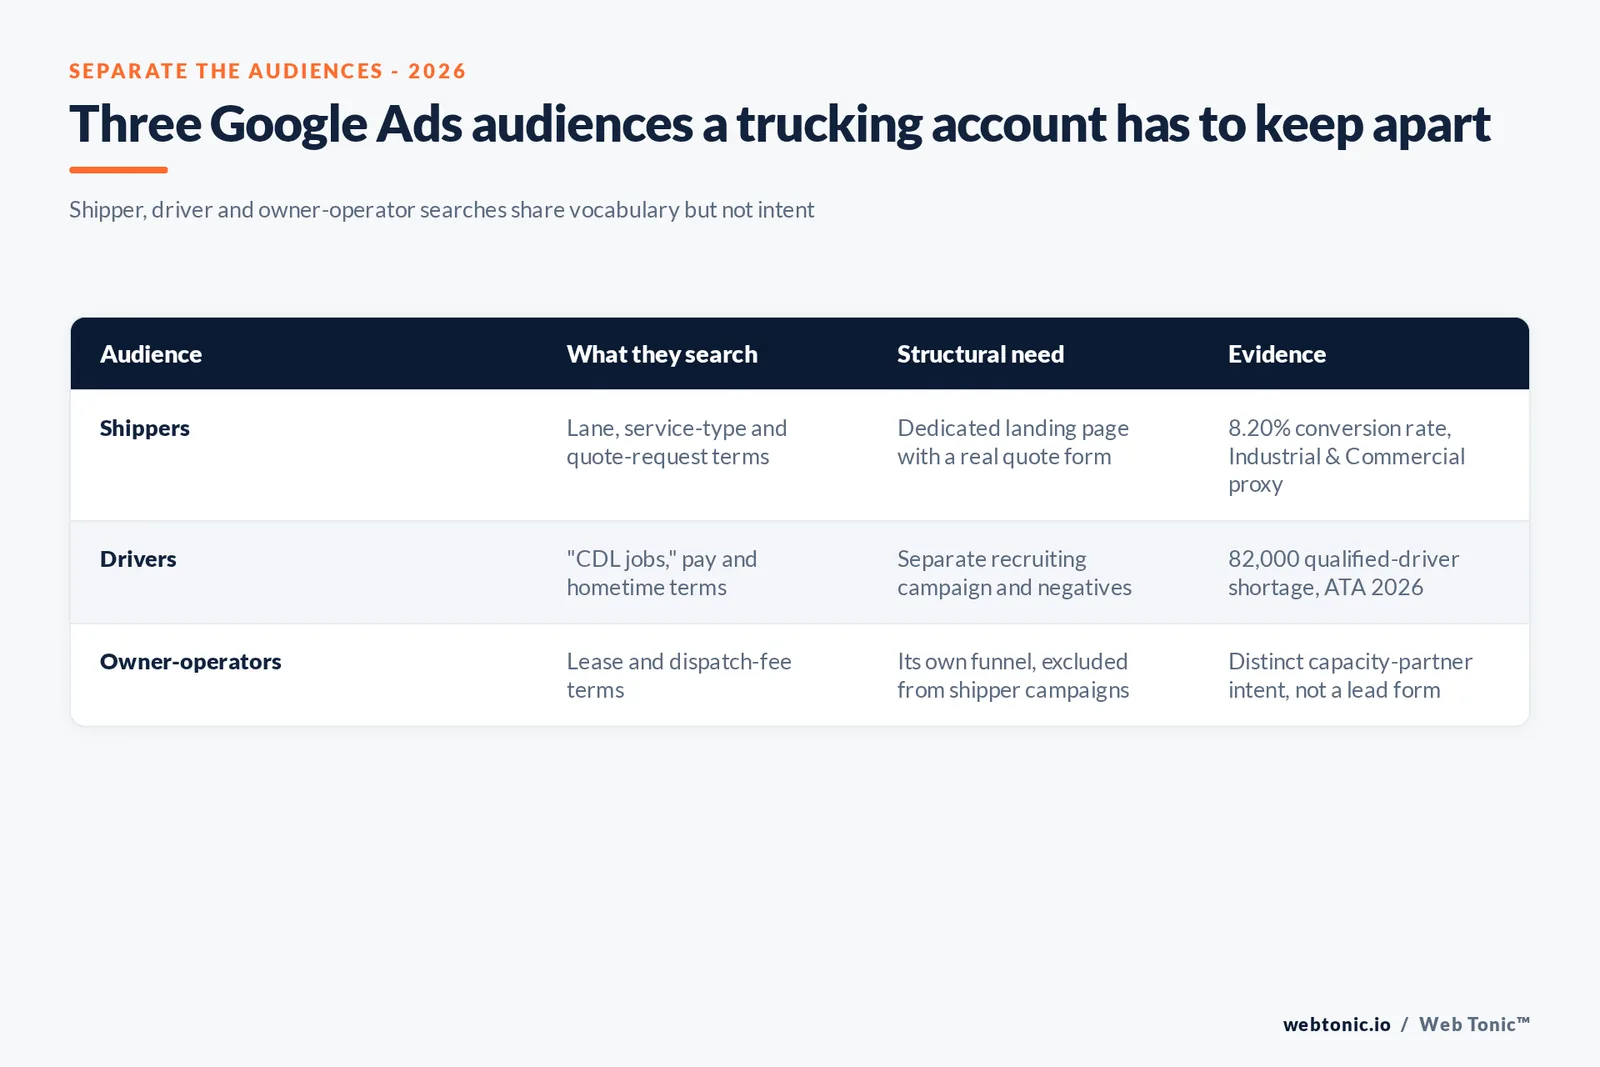
A structural issue specific to trucking Google Ads accounts: shipper-intent and driver-intent searches share the same vocabulary. "Trucking company [city]," a carrier's own brand name, and generic service terms draw shippers looking for capacity and drivers looking for a job in the same click stream. That collision is not theoretical - the American Trucking Associations has identified a shortage of 82,000 qualified drivers in 2026, which means most carriers are running real, budgeted recruiting campaigns in parallel with shipper-facing lead gen, frequently inside the same Google Ads account.
A blended campaign reports a conversion rate that understates both audiences: a shipper who lands on a driver-recruiting page bounces immediately, and vice versa. The fix is structural, not creative - separate campaigns, separate landing pages, and negative keyword lists built specifically to exclude job-seeker terms ("CDL jobs," "driver pay," "owner operator lease") from shipper campaigns and vice versa.
Where the industry's own cost pressure argues for tighter Google Ads structure
Trucks still moved 72.7% of US freight by weight in 2024, on a USD 906 billion gross freight bill - the addressable market is not shrinking in structural terms, even while the near-term tonnage index softens. What has changed is the tolerance for waste inside that market: with non-driver staffing already cut 7.8% and per-mile operating costs at a record high, a Google Ads account still blending shipper and driver-recruiting intent, or bidding flat across every lane instead of prioritising the highest-margin freight, is spending against a budget that has less room for it than it did three years ago.
Our growth marketing practice builds that kind of segmented campaign structure for logistics clients, and our Google Ads pricing guide covers how to budget a search program before committing to lane-specific spend.
Bid strategy questions worth asking before scaling spend
Because so few freight or logistics keywords come with a published Target CPA or Target ROAS benchmark, most accounts in this vertical still start on manual or maximize-conversions bidding while they build enough conversion volume for Smart Bidding to learn from. That is not a weakness - it is the correct sequencing for an account that, per the operating-cost data above, cannot afford a months-long automated-bidding learning phase burning budget against a soft freight market. A campaign converting fewer than roughly 30 times a month per bid strategy is not yet a candidate for automated Target CPA bidding regardless of what the rest of the account looks like.
See our Google Ads strategy guide for the broader sequencing logic, and our data and analytics practice for building the conversion tracking a logistics account needs before trusting an automated bid strategy with real budget.
| Account maturity signal | What it implies for bid strategy | Risk of moving too early |
|---|---|---|
| Fewer than ~30 conversions/month per campaign | Manual CPC or maximize conversions | Automated bidding lacks data to learn from |
| Shipper and driver campaigns still blended | Fix structure before automating bids | Bidding optimises against a polluted conversion signal |
| Conversion tracking not yet validated | Hold on Target CPA/ROAS | Bidding chases a broken measurement signal |
| 30+ clean conversions/month, segmented campaigns | Test Target CPA on the shipper campaign only | Low risk once the above are in place |
What a lane-level view adds that an account-wide average hides
Every average in this page - the USD 5.87 cost per click, the USD 2.19 dry van spot rate, the USD 2.336 per-mile operating cost - blends lanes and equipment types that behave nothing alike in practice. A reefer lane running at DAT's reported USD 2.61 a mile carries a different margin profile than a dry van lane at USD 2.19, and a Google Ads account bidding the same way on both is very likely overpaying for leads on the lower-margin lane while underbidding on the one that can actually absorb a higher cost per lead. The account-wide average in every benchmark cited above is a starting point for a budget conversation, not a bid instruction for any single campaign.
Practically, that means segmenting Google Ads campaigns by equipment type or lane group wherever volume allows it, and setting a cost-per-lead ceiling per segment based on that segment's own margin, not the account-wide blended average. A carrier running mixed dry van and flatbed capacity that bids identically across both is treating two different businesses as one.
Frequently Asked Questions
What does a trucking or logistics Google Ads click cost in 2026?
There is no LocaliQ category named 'trucking' or 'logistics', so Industrial & Commercial is the closest published proxy: an average cost per click of USD 5.87, a 6.57% click-through rate, an 8.20% conversion rate, and a cost per lead of USD 75.19, from LocaliQ's 2026 study of more than 13,000 US search campaigns. Treat it as the closest available benchmark, not an exact match for freight-specific keyword costs, which run higher on branded carrier or 3PL terms.
Is a USD 75.19 cost per lead expensive for a freight brokerage or carrier?
It depends entirely on the load it is competing to win. DAT's August 2026 data put the national average dry van spot linehaul rate at USD 2.19 a mile; a single 500-mile van load at that rate grosses roughly USD 1,095 before a carrier's own per-mile costs. Against that, a USD 75.19 lead cost is a small fraction of one load's revenue - the economics break down only if the lead never converts to a booked load at all.
Why do trucking Google Ads accounts waste spend on driver-recruiting clicks?
Because shipper-intent and driver-intent searches share vocabulary. Terms like 'trucking company [city]' or a carrier's own brand name draw both freight customers and the drivers a fleet is trying to hire - and the American Trucking Associations has identified a shortage of 82,000 qualified drivers in 2026, so carriers are running real recruiting budgets in parallel. A single campaign mixing both intents reports a conversion rate that looks worse than either audience actually performs on its own.
What is actually driving up the per-mile costs a Google Ads budget has to be justified against?
ATRI's 2026 Analysis of the Operational Costs of Trucking found the industry-average cost to operate a truck reached USD 2.336 per mile in 2025, up 3.4%, with the sharpest individual line-item increases in tolls (+13.2%), repair and maintenance (+8.6%), driver benefits (+6.6%) and tires (+6.4%). A marketing budget is being weighed against an operating cost base that is rising faster than freight rates in most lanes, which is exactly why lead quality matters more than lead volume here.
Should a trucking Google Ads budget target shippers, carriers, or drivers?
As three separate campaigns, not one blended account. Shipper-intent keywords (quote requests, lane searches, service-type terms) should be isolated from driver-recruiting keywords, and from owner-operator or capacity-partner terms if the brand also solicits contracted capacity. Blending them is the single most common structural mistake behind an inflated cost-per-lead number in this vertical.
Sources
LocaliQ - Search Advertising Benchmarks for Every Industry (2026 data)
DAT Freight & Analytics - Spot van rate falls 20 cents in steepest August pullback on record
American Transportation Research Institute - 2026 Analysis of the Operational Costs of Trucking
Air Freight News (AJOT) - The truck driver shortage limits opportunities for carrier expansion, citing American Trucking Associations 2026 data
American Trucking Associations - Economics and Industry Data