



Table of contents
17% of small businesses have no website at all, and among the ones that do, 42% run no analytics to see whether it works. That is the real state of small business digital reach in 2026 - not the follower counts most "small business statistics" pages lead with, but a census of what is actually online and whether it functions.
Key Takeaways
- 17% of local businesses have no website, per a 91,904-site 2026 census.
- 8.2% of listed websites failed to load when the census tried them.
- Hair salons have the lowest website adoption, at 62.6%.
- SaaS companies lead website adoption, at 97%.
- The average small business site scores 58/100 on mobile speed.
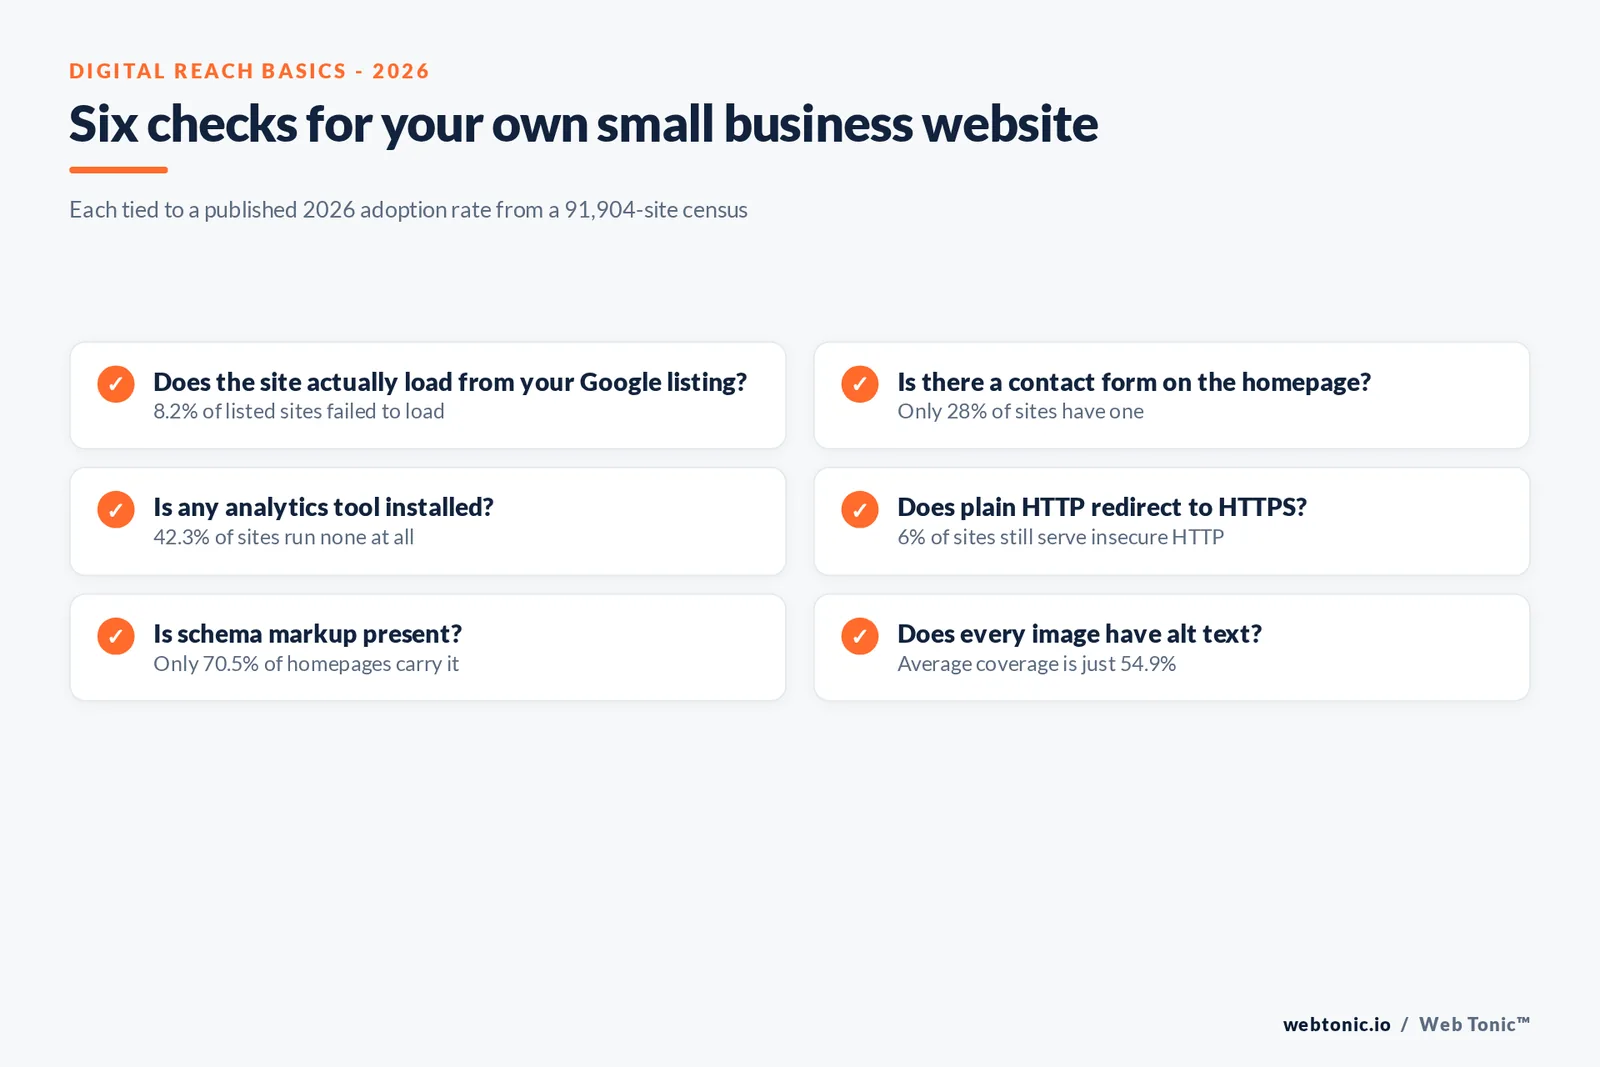
- Only 28% put a contact form on the homepage.
- 42.3% of sites run no analytics tool at all.
- 6% of sites still serve plain, insecure HTTP.
- 36.4% of small business sites run on WordPress, the largest single platform.
- Only 70.5% of homepages carry schema markup.
- Alt text covers just 54.9% of images on the average homepage.
- Social media is now named a main traffic source by 64% of small businesses.
- SEO is named a main traffic source by 52%, second to social.
- 66% of small businesses run unpaid social media marketing, the single most-used channel.
- Search advertising use rose from 40% to 45% year over year.
- Search ad use stays under 30% for budgets below $1,000 a month.
- 83% cite referrals as their top acquisition source, up from 65% last year.
- 72% call their SEO effective despite traffic disruption.
- 40% of small businesses report losing traffic to algorithm and AI search changes.
The website census behind these numbers
Most "small business statistics" content recycles opinion surveys. This page leans on one that isn't: RapidWebLaunch's 2026 census pulled Google listings for 423,009 local businesses across 24 North American cities, randomly sampled 131,514 of them, and technically audited 91,904 websites with Google's own PageSpeed Insights and Lighthouse tools. Nobody surveyed opinions here - the tool crawled and scored what actually exists.
Two owner surveys sit on top of that census: LocaliQ's Small Business Marketing Trends Report (300-plus owners) and WordStream's SMB Website Trends Report (300-plus owners). Where the census measures what's live, the surveys measure what owners believe is working - and the two do not always agree.
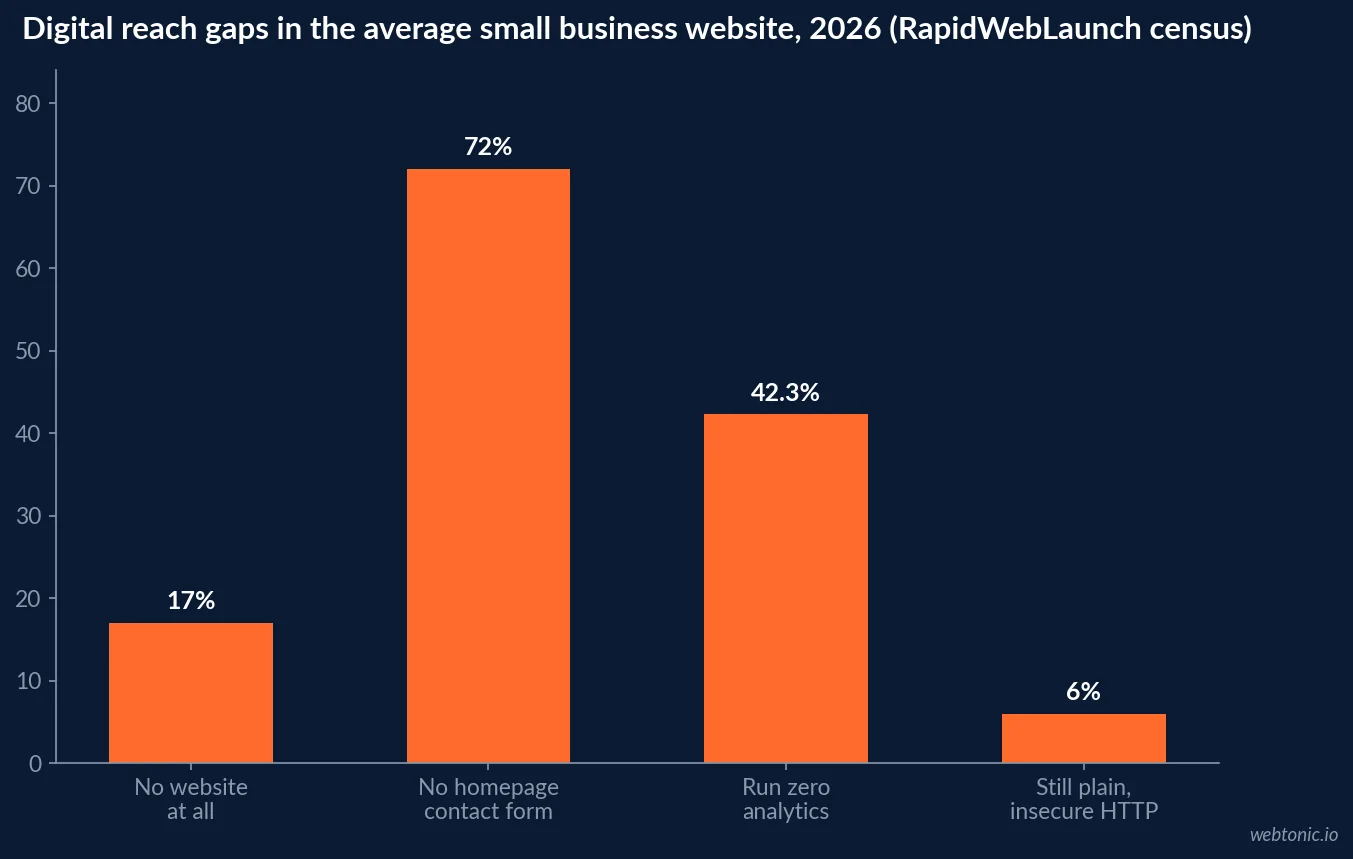
Digital reach benchmarks at a glance
| Benchmark (2026) | Figure | Sample | Source |
|---|---|---|---|
| No website at all | 17% of local listings | 423,009 Google listings | RapidWebLaunch |
| Website listed but broken or dead-end | 9.3% of those listed | 131,514 sampled | RapidWebLaunch |
| Average mobile speed score | 58 / 100 | 69,560 Lighthouse audits | RapidWebLaunch |
| Sites with a homepage contact form | 28% | 91,904 audited sites | RapidWebLaunch |
| Sites running zero analytics | 42.3% | 91,904 audited sites | RapidWebLaunch |
| Sites still on plain HTTP | 6% | 91,904 audited sites | RapidWebLaunch |
The website is real, but it's often broken
Of the 83% of businesses that do list a website, the census found 1.1% pointing only to a Facebook page or directory profile, and another 8.2% linking a page that failed to load when tested. A dead link on a Google Business Profile actively costs a business a customer who was already looking to buy, which is a worse outcome than listing nothing.
Website adoption also splits sharply by category. Hair salons sit lowest at 62.6%, with accountants at 68.0%, travel businesses at 71.0% and electricians at 71.7%. SaaS companies lead the census at 97%, which the data treats as close to the practical adoption ceiling.
| Industry | Share with a live website | Rank in census |
|---|---|---|
| SaaS | 97.0% | Highest of any category tracked |
| Dentists | 76.5% | Above the local-service median |
| Fashion retail | 76.5% | Tied with dentists |
| Cleaning companies | 77.7% | Above median |
| Painters | 78.4% | Above median |
| Electricians | 71.7% | Below median |
| Travel businesses | 71.0% | Below median |
| Accountants | 68.0% | Second-lowest tracked |
| Hair salons | 62.6% | Lowest tracked |
What the average site is missing on-page
A title tag is nearly universal at 99.1% of audited sites, but adoption falls off a cliff from there: a canonical tag on 84.9%, a meta description on 77.9%, Open Graph social tags on 75.7%, a proper H1 on 73.7%, schema markup on 70.5%, and image alt text covering an average of just 54.9% of images per homepage. Each of those is a low-cost fix, and each is left undone on roughly a quarter to half of small business homepages.
| On-page basic | Share of sites with it | What it costs to fix |
|---|---|---|
| Title tag | 99.1% | Near-zero; mostly already done |
| Canonical tag | 84.9% | One line of template code |
| Meta description | 77.9% | A single written sentence |
| Open Graph tags | 75.7% | Template-level, one-time |
| H1 heading | 73.7% | A homepage copy edit |
| Schema markup | 70.5% | A structured-data snippet |
| Image alt text (avg. coverage) | 54.9% | Ongoing, per image uploaded |
Social media has overtaken SEO as the named traffic source
WordStream's 2026 survey found small businesses naming social media as a main source of website traffic more often (64%) than SEO (52%) for the first time in the report's history. Among businesses that operate with no website, 35% said the traffic and leads they get from social platforms and marketplaces are the reason they haven't launched one.
That doesn't mean SEO stopped working. 72% of surveyed businesses still call their SEO effective, rising to 89% among the largest businesses surveyed (11 to 100 employees) - even though 40% of respondents overall, and 46% of the larger cohort, report losing some traffic to Google algorithm updates and AI search changes.
| Traffic source named by SMBs (2026) | Share naming it | Trend |
|---|---|---|
| Social media | 64% | Newly the top-named source |
| SEO / organic search | 52% | Displaced from first place |
| Website as a major lead source (any channel) | 69% | Stable, high reliance |
| Site sells directly | 70% | Majority of SMB sites transact |
| Traffic lost to algorithm/AI search changes | 40% | Up, cited as a growing risk |
Which channels small businesses actually run, versus which they trust
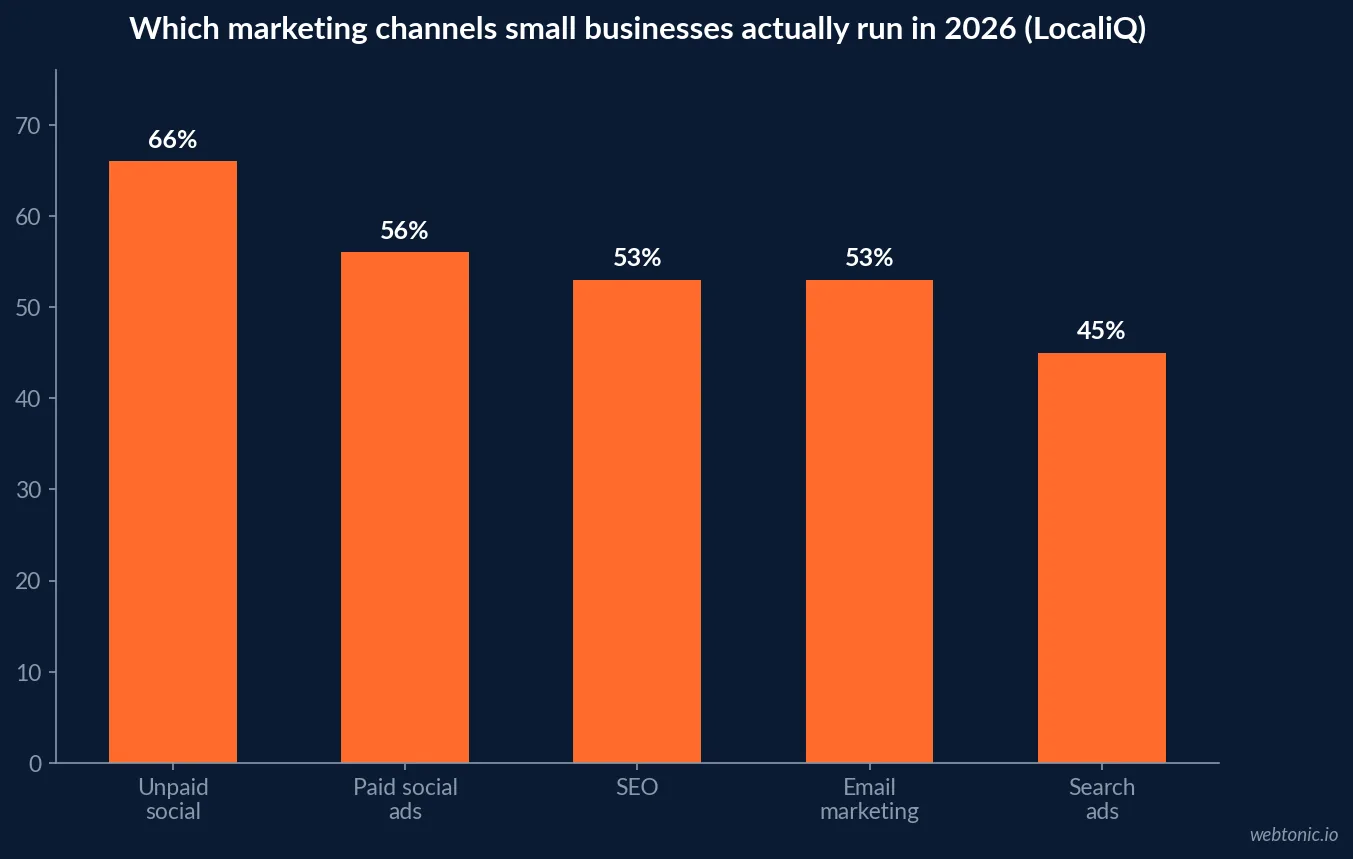
LocaliQ's owner survey shows a different lens: what SMBs actively run this year. Unpaid social media marketing leads at 66%, followed by paid social ads at 56%, then SEO and email marketing tied at 53%. Search advertising climbed from 40% to 45% year over year, but usage drops to under 30% for businesses with a monthly marketing budget below $1,000 - which describes the majority of small businesses surveyed.
Reputation management (28%) and video marketing (26%) trail the list despite posting some of the highest satisfaction scores among owners who do use them, a mismatch that suggests underused, low-cost tactics rather than tactics that failed.
| Channel used by SMBs (2026) | Share currently running it | YoY change |
|---|---|---|
| Unpaid social media marketing | 66% | Stable, still #1 |
| Paid social media ads | 56% | Growing |
| SEO | 53% | Stable |
| Email marketing | 53% | Stable |
| Search advertising | 45% | Up from 40% |
| Reputation management | 28% | Underused vs. satisfaction |
| Video marketing/advertising | 26% | Underused vs. satisfaction |
Social platform mix: Facebook still leads, TikTok cooled
Among the small businesses running social media, Facebook use climbed to 90% this year from 76% last year, with Instagram up to 74% from 63% and LinkedIn up to 48% from 43%. TikTok use fell to 22% from 34%, which LocaliQ attributes partly to the platform's regulatory uncertainty and the posting consistency it demands. Snapchat (3%) and Pinterest (16%) remain the least-used platforms in the same survey.
| Platform | 2026 usage among SMBs | 2025 usage | Direction |
|---|---|---|---|
| 90% | 76% | Up | |
| 74% | 63% | Up | |
| 48% | 43% | Up | |
| 16% | n/a | Steady, low | |
| TikTok | 22% | 34% | Down |
| Snapchat | 3% | n/a | Steady, lowest |
Where 2026 marketing budgets are actually moving
Despite an uncertain economy - 66% of owners call it a somewhat or very challenging factor in 2026, up from 48% last year - only 8% of small businesses plan to cut their marketing budget. 40% plan to increase it, and 54% plan to hold steady. Of those planning to spend more, 53% are putting the increase into video marketing and 47% into both search and social advertising.
Acquisition sources back this up: 83% of owners cite referrals as their best source of new customers, up sharply from 65% last year, and 46% cite digital marketing and online advertising as a top source - though that rises to 71% among businesses with a monthly budget of $10,000 or more, against just 37% for budgets under $1,000.
| 2026 budget signal | Figure | Source |
|---|---|---|
| Plan to increase marketing budget | 40% | LocaliQ 2026 |
| Plan to hold budget steady | 54% | LocaliQ 2026 |
| Plan to decrease marketing budget | 8% | LocaliQ 2026 |
| Cite referrals as top acquisition source | 83% | LocaliQ 2026 |
| Cite economic uncertainty as a challenge | 66% | LocaliQ 2026 |
What this means for a small business site plan
Read together, the census and the surveys point the same direction: the sites that convert are the ones that fix the boring basics - a working link, a homepage form, analytics installed, schema in place - and then layer social and search on top rather than picking one. Our growth marketing team and data and analytics practice both start audits at exactly the list in the table above, because it is the cheapest set of fixes on this whole page.
If your business is still deciding where the next dollar goes, talk to us - or read how we think about the classic paid-channel question in are Facebook ads worth it in 2026 before committing a budget line.
Reviews still decide the click, even as the sources shift
BrightLocal's 2026 Local Consumer Review Survey found 97% of consumers read reviews for local businesses, and 41% now say they "always" read reviews before choosing one, up sharply from 29% a year earlier. Where they read matters too: Google's share of review traffic slipped from 83% in 2025 to 71% in 2026, while use of ChatGPT and other generative AI tools for local recommendations jumped from 6% to 45%, making AI search the third most common source of business recommendations. 47% of consumers won't use a business with fewer than 20 reviews at all.
Reputation management sits low on LocaliQ's channel-usage list at 28% even though it posts some of the highest satisfaction scores among owners who run it - and BrightLocal's data shows exactly why that mismatch is expensive: the review signal a business is neglecting is the one almost every buyer checks before clicking through.
| Review behavior signal (BrightLocal, 2026) | Figure | YoY change |
|---|---|---|
| Consumers who read reviews for local businesses | 97% | Stable, near-universal |
| Consumers who "always" read reviews first | 41% | Up from 29% |
| Google's share of review traffic | 71% | Down from 83% |
| Use of AI tools (ChatGPT, etc.) for local recommendations | 45% | Up from 6% |
| Consumers who won't use a business with under 20 reviews | 47% | n/a |
The scale behind these numbers
Context matters here: there are 36,207,130 small businesses in the US, per the SBA Office of Advocacy's 2026 FAQ report, representing 99.9% of all US businesses and employing 62.3 million people, or 45.9% of private-sector workers. Small business economic activity accounts for 43.5% of GDP. At that scale, a 17% no-website rate isn't a fringe problem - it describes roughly six million businesses.
Financing pressure compounds the digital reach gap. The Federal Reserve's 2026 Small Business Credit Survey found 60% of employer firms applied for financing in the prior 12 months, most often to cover operating expenses (56%) or pursue expansion (46%), yet only 42% of applicants received the full amount sought and 22% received nothing. A business fighting for financing has even less slack to fix a broken website link.
| National scale fact (2026) | Figure | Source |
|---|---|---|
| Total small businesses in the US | 36,207,130 | SBA Office of Advocacy |
| Share of all US businesses that are small | 99.9% | SBA Office of Advocacy |
| Small business employees | 62.3 million (45.9% of private sector) | SBA Office of Advocacy |
| Small business share of GDP | 43.5% | SBA Office of Advocacy |
| Employer firms that applied for financing | 60% | Federal Reserve Small Business Credit Survey |
| Applicants receiving the full amount sought | 42% | Federal Reserve Small Business Credit Survey |
AI adoption is real but shallower than the headlines suggest
Intuit QuickBooks's 2026 AI Impact Report, drawing on more than 34,000 survey responses and anonymized payment records from over 5.3 million small and midsize businesses, found roughly 7 in 10 businesses say they now use AI regularly - but payment data shows only about 1 in 10 are actually paying for a dedicated AI tool. Among businesses that did pay for AI in 2024, roughly 8 in 10 were still paying a year later, which the report reads as a real retention signal once a business crosses into paid use.
That gap between casual, free AI use and paid commitment matches the pattern seen across the rest of this page: adoption headlines run well ahead of what's actually installed, paid for, or fixed on the ground.
| AI adoption signal (2026, Intuit) | Figure |
|---|---|
| Businesses reporting regular AI use | ~70% (7 in 10) |
| Businesses actually paying for a dedicated AI tool | ~10% (1 in 10) |
| Paid AI users from 2024 still paying in 2025 | ~80% (8 in 10) |
| Survey sample size | 34,000+ owners/operators |
| Payment-record sample size | 5.3 million+ businesses |
Confidence is steady, but inflation is the dominant worry
The U.S. Chamber of Commerce Small Business Index, fielded quarterly by Ipsos, read 66.5 in Q2 2026, essentially flat against the prior quarter's 67.0 and slightly above the year-ago reading of 65.2. 69% of owners still report steady business health, but the share citing inflation as their top concern jumped from 48% in Q2 2025 to 57% in Q2 2026, even as 66% still expect revenue to increase over the next year and 35% plan to add staff.
That mix - steady confidence, rising cost concern, continued investment plans - is exactly the backdrop against which the digital reach gaps in this page's earlier tables matter most: owners are still willing to invest, but every dollar has to work harder.
Frequently Asked Questions
What share of small businesses still have no website in 2026?
RapidWebLaunch's census of 423,009 local business Google listings across 24 North American cities found 17% with no website at all, and among the 83% that do list one, 1.1% link only a Facebook page or directory profile and another 8.2% point to a page that failed to load. Add those together and roughly a quarter of local Google listings send a customer nowhere useful.
Which small business industries are furthest behind on websites?
In the same census, hair salons had the lowest website adoption at 62.6%, followed by accountants at 68.0%, travel businesses at 71.0% and electricians at 71.7%. SaaS companies sat at the opposite end, with 97% running a website, which the report treats as close to the practical ceiling for the sample.
Is social media or SEO the bigger traffic source for small businesses now?
WordStream's 2026 survey of 300-plus small businesses found social media named as a main traffic source by 64% of respondents against 52% for SEO. That flip is recent: LocaliQ's companion survey still finds SEO and email marketing tied with social media ads for second place among the channels SMBs actually run, at 53% and 56% respectively.
Where does a typical small business marketing budget go in 2026?
LocaliQ's survey of 300-plus owners found unpaid social media marketing as the single most-used channel at 66%, followed by paid social at 56% and SEO plus email marketing tied at 53%. Search advertising use rose from 40% to 45% year over year but stays below 30% among businesses with a monthly budget under $1,000, which is most small businesses.
How many small businesses actually measure whether their website works?
RapidWebLaunch's technical audit found 42.3% of small business sites running no analytics tool at all, meaning they cannot see which pages, channels or campaigns bring in customers. Google Analytics leads the tools that are installed at 56.7% of sites, with Google Tag Manager on 28.6% and the Meta Pixel on only 9.0%.
Sources
RapidWebLaunch - The State of Small Business Web Design in 2026
LocaliQ - The Big Small Business Marketing Trends Report for 2026
WordStream - The Big SMB Website Trends Report
SBA Office of Advocacy - Frequently Asked Questions About Small Business, 2026
Federal Reserve - 2026 Report on Employer Firms, Small Business Credit Survey
Intuit QuickBooks - 2026 AI Impact Report
U.S. Chamber of Commerce - Small Business Index Q2 2026
BrightLocal - Local Consumer Review Survey 2026


