



Table of contents
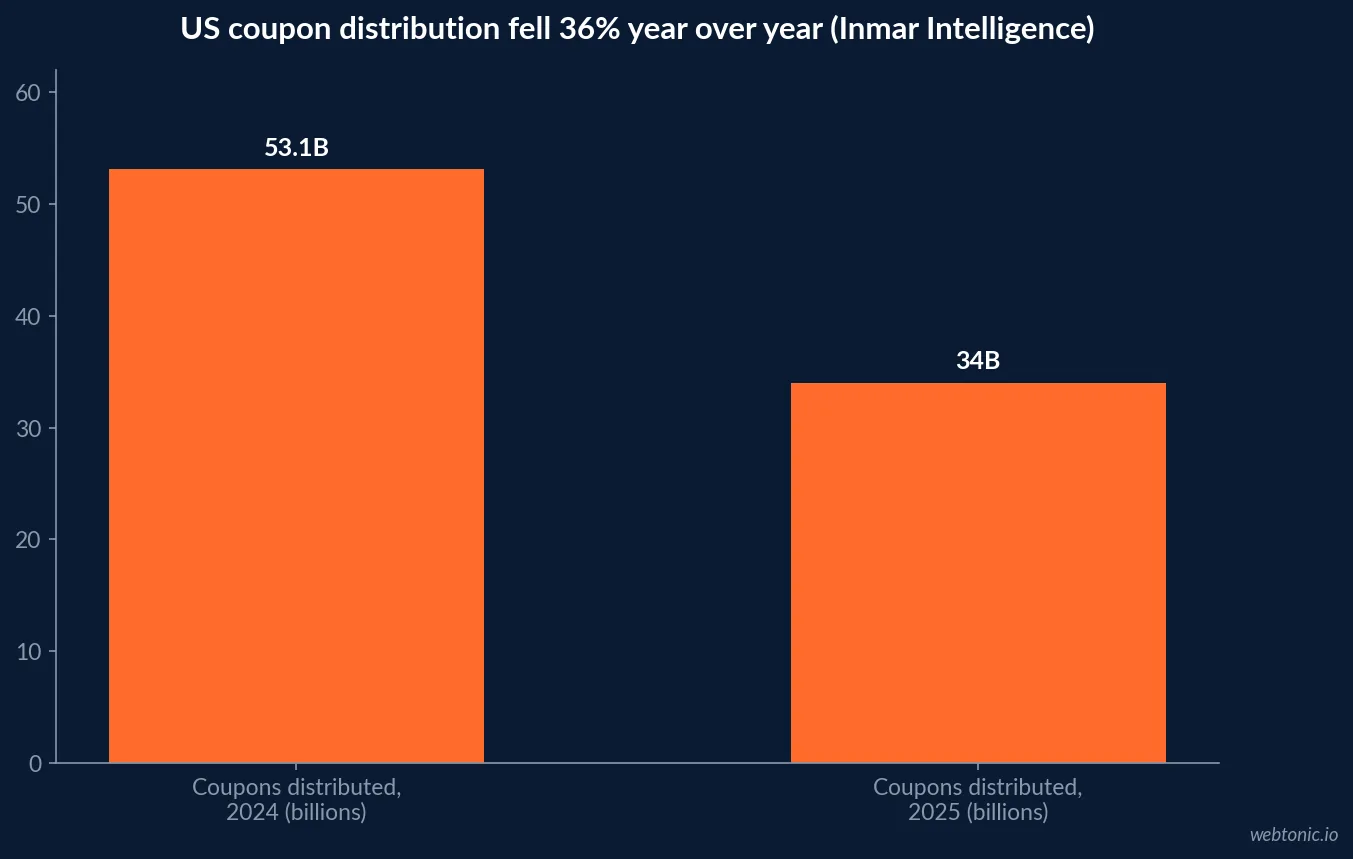
US coupon distribution fell to 34 billion in 2025 from 53.1 billion the year before, yet the redemption rate doubled to 2.4% over the same two years. The 2026 data on promotions is less about whether to discount and more about how deep, how often, and through which channel a discount actually converts.
Key Takeaways
- Coupon distribution fell to 34 billion in 2025, down from 53.1 billion in 2024.
- Total coupons redeemed fell to about 802 million, down 7.2% year over year.
- The redemption rate rose to 2.4%, double the rate of two years earlier.
- Load-to-card digital coupons are 54% of all redemptions, versus 2.3% for print inserts.
- 15.29% of validated coupon codes convert to a redemption, per a 1.79M-redemption study.
- Retail discounts of 10% or less convert 22.30% of validated codes.
- That falls to 9.08% at a 20% discount depth in the same retail dataset.
- Fixed discounts convert 36.71% of codes in retail, versus 12.33% in travel.
- The median ecommerce discount rate is 15%, average 19.5%, across 93,000 merchants.
- BFCM adds under 1 percentage point of depth above the trailing run rate.
- 73% of shoppers stay loyal to brands that consistently discount.
- 44% have abandoned a brand after its discounts disappeared.
- Only 5% stay loyal at full price against a 20%-off competitor offer.
- 91% of Americans delay purchases to wait for a discount.
- Shoppers need at least 26% off, on average, before the wait feels worth it.
- 61% will wait a month or longer for a better deal.
- 64% have abandoned an item entirely after missing a deal window.
- 91% of consumers use coupons at least monthly, per Valpak's 2026 survey.
Fewer coupons, higher redemption rate
Inmar Intelligence's 2026 industry analysis reports total US coupon distribution falling to 34 billion in 2025 from 53.1 billion the year prior, a shift the report frames as a move from mass scale toward precision targeting. Coupons in the News's reporting on the same Inmar data shows total redemptions falling more slowly, to roughly 802 million, a 7.2% decline, which means the redemption rate — the share of distributed coupons actually used — rose to 2.4%, double the rate from two years earlier. Only 2.3% of coupons redeemed came from Sunday print inserts, while load-to-card digital coupons now represent 54% of all redemptions.
| Metric (Inmar Intelligence, 2025-2026) | 2024 | 2025 | Change |
|---|---|---|---|
| Coupons distributed | 53.1 billion | 34 billion | -36% |
| Coupons redeemed | ~0.87 billion | ~0.80 billion | -7.2% |
| Redemption rate | ~1.2% | 2.4% | Doubled |
| Share of redemptions, load-to-card digital | Lower | 54% | Rising |
| Share of redemptions, print inserts | Higher | 2.3% | Falling |
Discount depth does not scale linearly with conversion
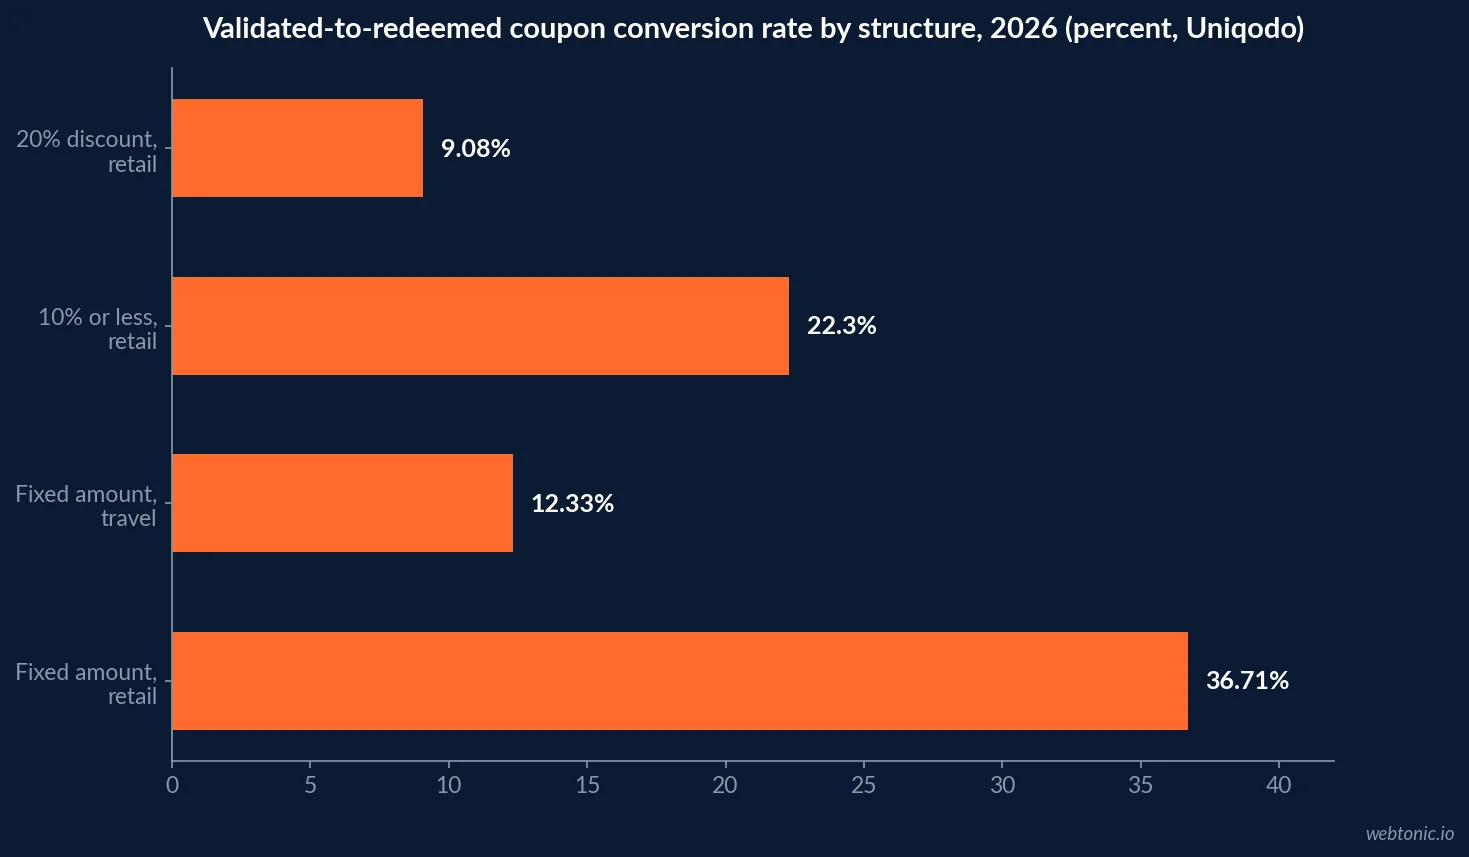
Uniqodo's analysis of 51.6 million codes and 1.79 million redemptions across 90 merchants found that 15.29% of validated codes convert to a redemption overall, but the pattern flips depending on discount depth and structure. Retail discounts of 10% or less converted 22.30% of validated codes, nearly double the 9.08% conversion rate at a 20% discount depth. Fixed-amount discounts converted 36.71% of validated codes in retail, against only 12.33% in travel, where percentage-based discounts dominate order value instead.
| Discount structure | Sector | Validated-to-redeemed conversion | Notes |
|---|---|---|---|
| 10% or less | Retail | 22.30% | Highest retail conversion band |
| 20% | Retail | 9.08% | Less than half the 10%-band rate |
| Fixed amount | Retail | 36.71% | Outperforms percentage discounts |
| Fixed amount | Travel | 12.33% | Percentage discounts dominate travel |
| 15% | Travel | Highest AOV, GBP 2,778 | Best value per redemption, not highest volume |
| 30%+ | Travel | 71.77% conversion, GBP 234 AOV | High volume, low value per redemption |
What the market actually discounts, year-round
Eightx's analysis of 93,000 ecommerce merchants puts the median promo-code depth at 15% for 2026, with an average of 19.5% and a Cyber Week peak of 23%. The report's most counterintuitive finding is how little Black Friday/Cyber Monday actually moves category-level depth: apparel lifted only 0.1 percentage point during BFCM, electronics and home/garden lifted 0.0 points, and the largest single-category move, sports and outdoors, was still under a full point at +0.8. November's all-merchant average depth, at 19.2%, came in slightly below the annual norm of 19.5%.
| Category | BFCM depth lift (percentage points) |
|---|---|
| Sports and outdoors | +0.8 |
| Apparel | +0.1 |
| Beauty | ~0.0 |
| Electronics | 0.0 |
| Home and garden | 0.0 |
Consistent discounting builds a conditional kind of loyalty
CouponFollow's survey of over 1,000 American shoppers found 73% say they stay loyal to brands that consistently offer coupons and discounts, rising to 79% among Gen Z. But the same survey shows the downside of that strategy: 44% have abandoned a brand they liked after its discounts disappeared, climbing to 51% among self-described deal hunters, and only 5% of shoppers stay loyal at full price against a competitor's 20%-off offer, while 37% switch immediately. 85% say paying full price feels like a penalty when they know others got a deal.
| Consumer behavior (CouponFollow, 2026) | Share of shoppers |
|---|---|
| Stay loyal to brands with consistent discounts | 73% (79% Gen Z) |
| Have abandoned a brand after discounts stopped | 44% (51% deal hunters) |
| Stay loyal at full price vs. a 20%-off rival | 5% |
| Switch immediately for a 20%-off rival offer | 37% |
| Say full price feels like a penalty when others get a deal | 85% |
| Search for a coupon before buying | 88% |
Why deal-seeking has become the default, not the exception
The consumer behavior behind these redemption numbers is structural, not seasonal. A Capgemini 2026 consumer-trends report found 62% of consumers say more attractive deals can make them switch brands, and three in four consumers say money-off discounts are the single most motivating promotion format, ahead of percentage-off and buy-one-get-one offers. A separate Zamplia survey of US consumers found 74.5% of Americans describe themselves as more deal-driven than they were 12 months earlier, with 83.3% citing rising 2026 prices as the reason. Only 21.7% of respondents said they buy non-essential items at full price "often" or "always."
That reframes the promotion-depth question: it is no longer about whether to run a promotion, it is about which format and depth converts the deal-seeking behavior that is already the shopper's default state.
| Deal-driven consumer finding (2026) | Figure |
|---|---|
| Say more attractive deals can make them switch | 62% |
| Rank money-off discounts as most motivating format | 75% |
| Describe themselves as more deal-driven than a year ago | 74.5% |
| Cite rising prices as the reason | 83.3% |
| Buy non-essential items at full price often/always | 21.7% |
How long shoppers will actually wait for a deal
In a separate 2026 survey, CouponFollow found 91% of Americans delay purchases to wait for a discount, needing at least 26% off, on average, before the wait feels worthwhile, and 61% willing to wait a month or longer. That patience has a real failure rate: 64% have walked away from an item entirely after missing a deal window, at an average abandoned-purchase value of USD 183, and 68% say they feel guilty buying at full price when they suspect a sale is coming. Valpak's April 2026 readership survey corroborates the routine nature of the behavior: 91% of respondents use coupons or promotional offers at least monthly, and 73% do so once every two weeks or more.
| Deal-waiting behavior (CouponFollow, 2026) | Figure |
|---|---|
| Delay purchases to wait for a discount | 91% |
| Average discount depth needed to justify waiting | 26% |
| Willing to wait a month or longer | 61% |
| Have abandoned an item after missing a deal window | 64% |
| Average value of an abandoned purchase | USD 183 |
| Feel guilty paying full price when a sale seems likely | 68% |
Setting depth and cadence from the data, not the calendar
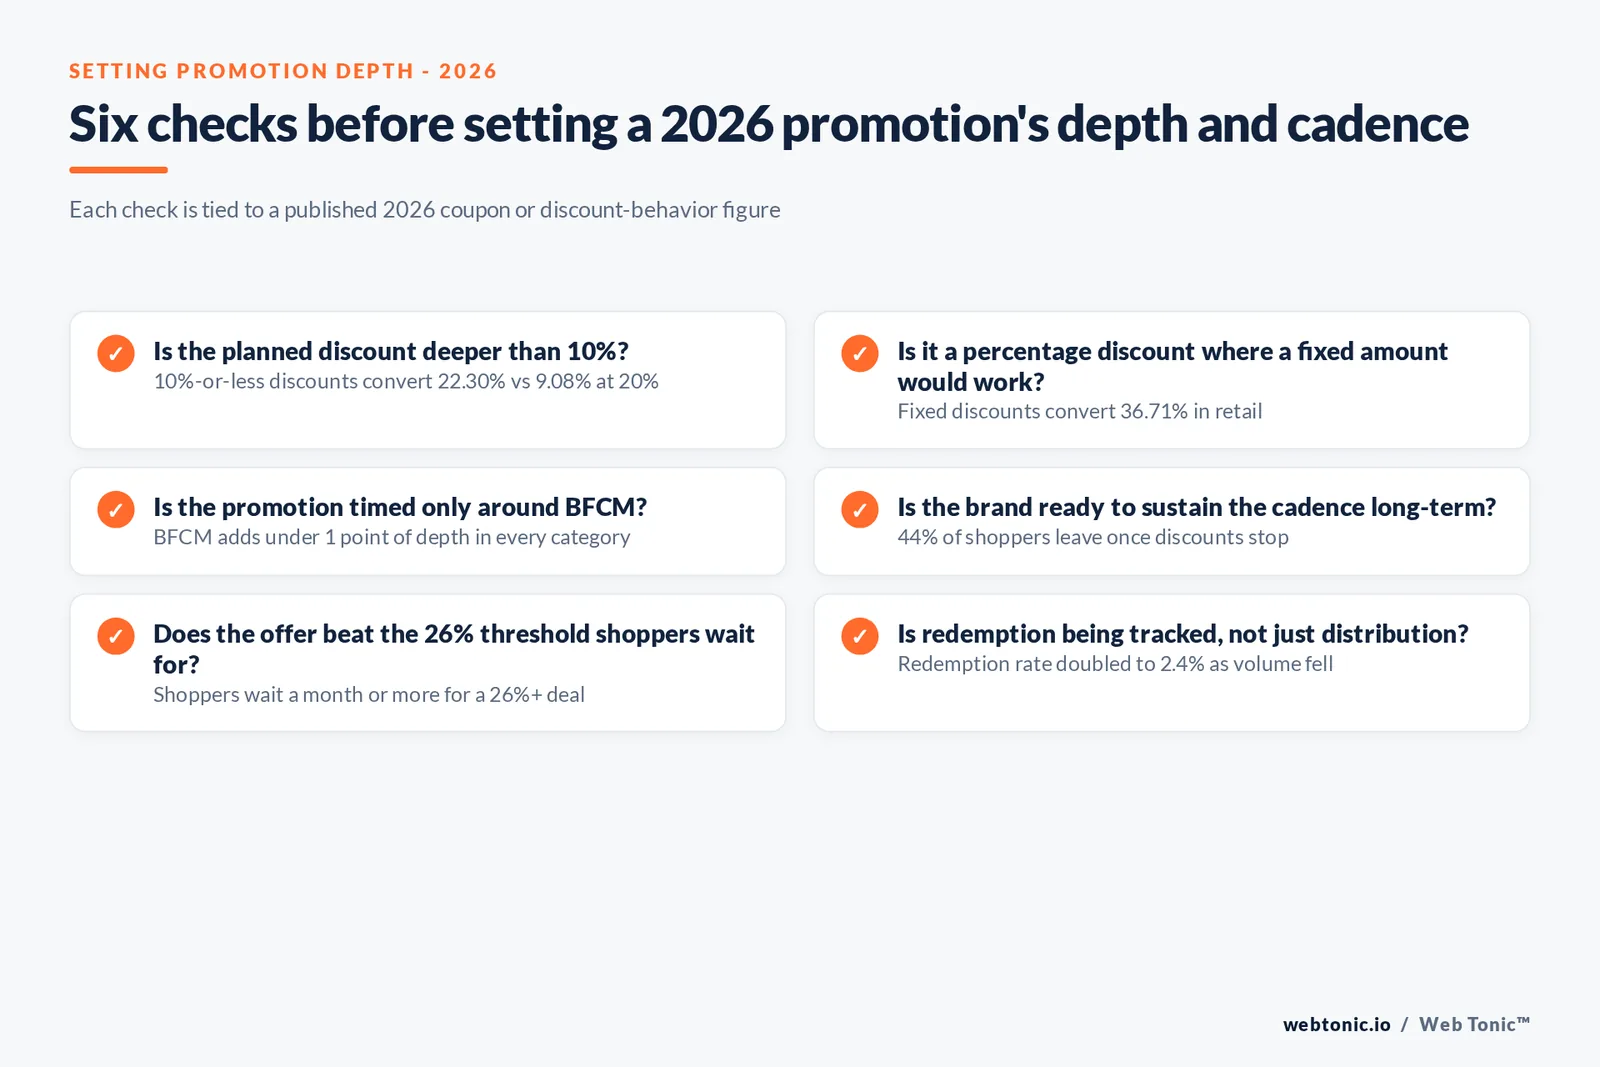
The pattern across every dataset above points the same direction: a shallow, well-timed discount converts more efficiently per dollar of margin given up than a deep one, and the BFCM calendar moment is doing far less work than the marketing plan built around it assumes. A retailer chasing the 22.30% conversion band on a 10%-or-less discount, backed by a fixed-amount structure where the category supports it, is working with the grain of the 2026 data rather than against it. The loyalty data is the caveat: once a discount cadence is established, stopping it costs more in switching than starting it ever earned in incremental volume, so the depth decision and the cadence decision have to be made together, not separately.
If you want that math run against your own margin structure and customer file, our growth marketing team can build the model, our data practice can track redemption against margin in real time, and our guide to Facebook ad ROI is a useful companion for the paid-acquisition side of a promotion launch.
Frequently Asked Questions
Are shoppers actually using more coupons in 2026, or fewer?
Both are true, depending on which number you look at. Inmar Intelligence reports that total coupon distribution fell to 34 billion in 2025 from 53.1 billion the year before, and total redemptions fell to roughly 802 million from 866 million. But because distribution fell faster than redemption, the redemption rate, the share of available coupons actually used, rose to 2.4%, double what it was two years earlier. Fewer coupons are circulating and each one is working harder.
What discount depth actually converts in 2026?
It depends heavily on the channel and the discount structure, not just the percentage. Uniqodo's analysis of 1.79 million redemptions found that retail discounts of 10% or less converted 22.30% of validated codes, nearly double the 9.08% conversion rate at 20% off. In travel, a 15% discount returned the highest average order value at GBP 2,778, while discounts of 30% or more converted more codes but returned a much lower GBP 234 per redemption. Deeper is not automatically better.
Do consistent discounts build or erode brand loyalty?
CouponFollow's 2026 survey of over 1,000 American shoppers found both effects operating at once. 73% of shoppers say they stay loyal to brands that consistently offer coupons and discounts, but 44% have abandoned a brand they liked after its discounts disappeared, climbing to 51% among self-described deal hunters. The same survey found only 5% of shoppers stay loyal at full price when a competitor offers 20% off. Consistent discounting builds a kind of loyalty that is conditional on the discount continuing.
How long will shoppers actually wait for a deal before buying anyway?
CouponFollow's separate 2026 survey found 91% of Americans delay purchases to wait for a discount, with 61% willing to wait a month or longer and 8% saying they would wait indefinitely rather than pay full price. On average, shoppers said they need at least 26% off before the wait feels worthwhile. The same survey found the wait backfires often enough to matter: 64% have walked away from an item entirely after missing a deal window, at an average abandoned-purchase value of USD 183.
Is Black Friday/Cyber Monday actually the deepest discount period of the year?
The published 2026 data says the BFCM effect is smaller than the marketing copy around it suggests. Eightx's analysis of 93,000 merchants puts the median ecommerce discount rate at 15% year-round with a 23% Cyber Week peak, but reports that BFCM adds less than one percentage point of depth above the trailing run rate in every category tested, with several categories showing essentially no BFCM-specific lift at all. The discount 'event' mainly increases how many shoppers use a code, not how deep the code goes.
Sources
Inmar Intelligence - 2026 Promotion Industry Analysis
Coupons in the News - Coupon use is down, and also up, 2026 (Inmar data)
Uniqodo - Coupon Code Statistics 2026, data from 1.79M redemptions
Eightx - Average ecommerce discount rate by vertical, 2026
CouponFollow - Why Discounts Matter More Than Brand Loyalty in 2026
CouponFollow - What's Really Stopping Americans From Clicking Buy
Valpak - 2026 Direct Mail Statistics, Valpak Survey Results
Capgemini - Today's Consumer 2026
Zamplia - Deal-Driven Consumer Behavior, 2026 survey


