



Table of contents

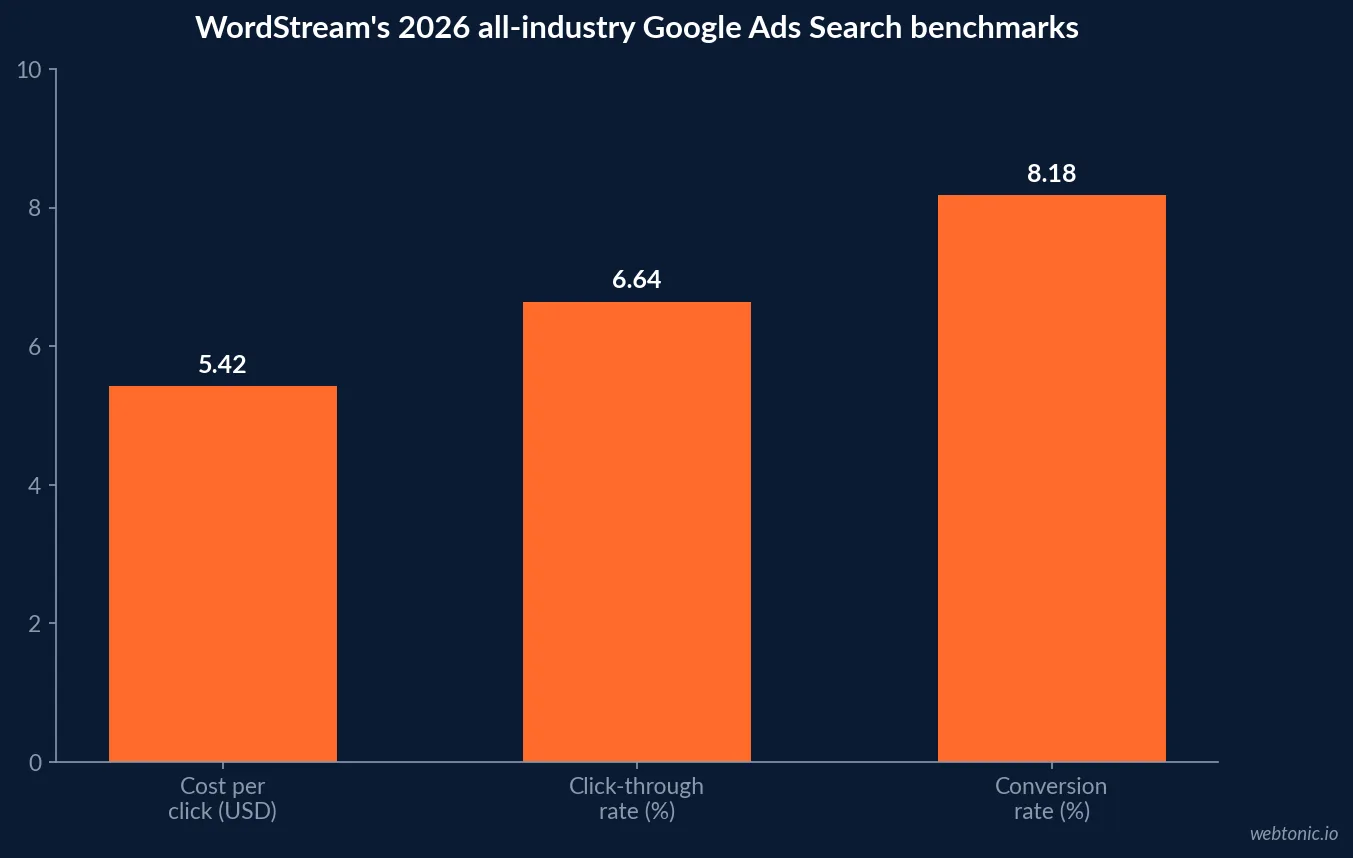
Sizing a 2026 PPC budget starts with four numbers: a USD 5.42 average cost per click, a 6.64% click-through rate, an 8.18% conversion rate, and roughly one in ten clicks that may never have come from a real prospect. Every one of those numbers moves by industry, and the fourth one is the reason a clean CTR does not automatically mean a clean account.
Key Takeaways
- Average Google Ads CPC across industries is USD 5.42 (WordStream, 2026).
- Average Search click-through rate is 6.64% across the same dataset.
- Average Search conversion rate is 8.18%, with a USD 66.69 average cost per lead.
- Attorneys & Legal Services pay USD 9.87 per click, the highest tracked vertical.
- Arts & Entertainment pays USD 1.63 per click, among the lowest.
- An estimated 11.4% of PPC clicks are invalid, per Fraud Blocker's account analysis.
- Global invalid traffic runs 8.51% of all digital ad spend, per Lunio's 2026 report.
- That 8.51% rate implies roughly USD 63 billion lost to invalid traffic in 2025.
- 75.6% of surveyed marketers lose over 5% of budget to invalid traffic, per Lunio.
- 85.6% are concerned about agentic AI driving further invalid-traffic growth.
- Performance Max adoption reached 71% of surveyed advertisers in one 2026 report.
- PMax's share of Google Ads spend is estimated near 20% to 38% depending on the study.
- About 30% of Google search spend now runs through AI Max or PMax, per Digiday reporting.
The four numbers that size a budget
WordStream's 2026 Google Ads Benchmarks report, drawn from more than 13,000 US-based Search campaigns running April 2025 through March 2026, is the most widely cited named methodology behind the "average PPC costs X" claim repeated across the industry. Its headline figures: a USD 5.42 average cost per click, a 6.64% average click-through rate, an 8.18% average conversion rate and a USD 66.69 average cost per lead.
| Metric (WordStream 2026, all-industry avg.) | Figure | Window measured |
|---|---|---|
| Cost per click (CPC) | USD 5.42 | Apr 2025 - Mar 2026 |
| Click-through rate (CTR) | 6.64% | Apr 2025 - Mar 2026 |
| Conversion rate (CVR) | 8.18% | Apr 2025 - Mar 2026 |
| Cost per lead (CPL) | USD 66.69 | Apr 2025 - Mar 2026 |
Cost per click by industry: a five-fold spread
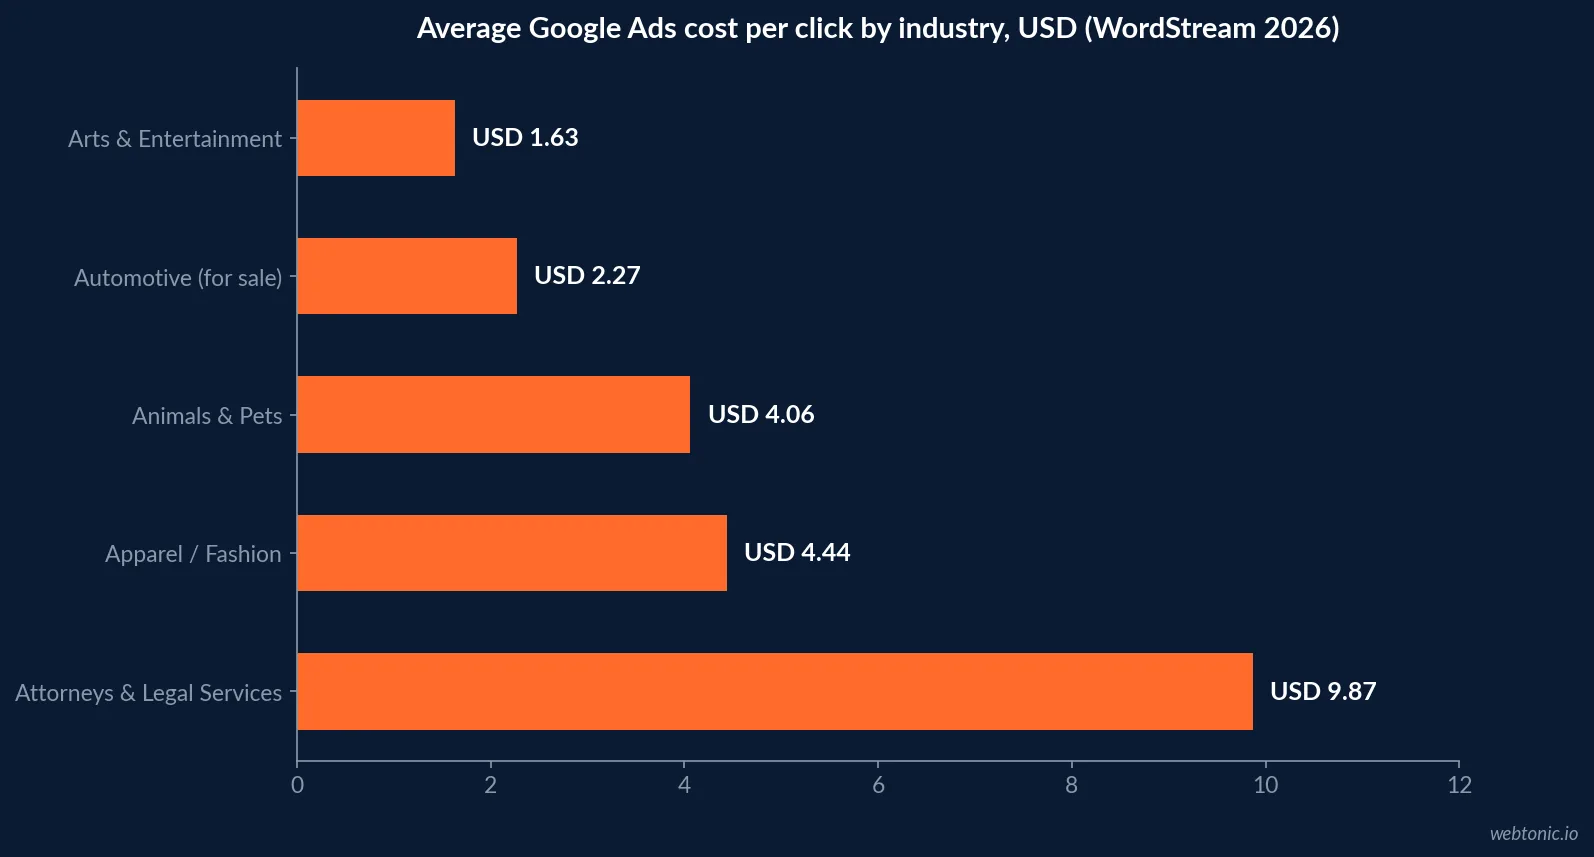
The all-industry USD 5.42 average sits between a wide range. WordStream's industry table shows Attorneys & Legal Services averaging USD 9.87 per click, the highest tracked vertical, against Arts & Entertainment at USD 1.63 - roughly a six-fold spread inside the same benchmark set. That range is the reason a single quoted CPC figure is close to useless for budgeting without knowing which vertical it came from.
| Industry (WordStream 2026) | Average CPC |
|---|---|
| Attorneys & Legal Services | USD 9.87 |
| Animals & Pets | USD 4.06 |
| Apparel / Fashion & Jewelry | USD 4.44 |
| Automotive - For Sale | USD 2.27 |
| Arts & Entertainment | USD 1.63 |
| All-industry average | USD 5.42 |
What "8.18% conversion rate" is actually measuring
Conversion rate benchmarks are the easiest PPC number to misread, because the definition of a conversion is set inside each advertiser's own account, not standardized across the industry. WordStream's 8.18% average blends form fills, calls, purchases and other configured goals across its full campaign sample. An account tracking only completed purchases should expect a materially lower rate than an account tracking a lead-form submission, and comparing the two against the same 8.18% benchmark will make one look artificially strong and the other artificially weak.
Cost per lead follows the same logic: USD 66.69 average across the WordStream sample is only meaningful once you know what counted as a "lead" in that calculation.
Invalid clicks: the number sitting inside every one of those figures
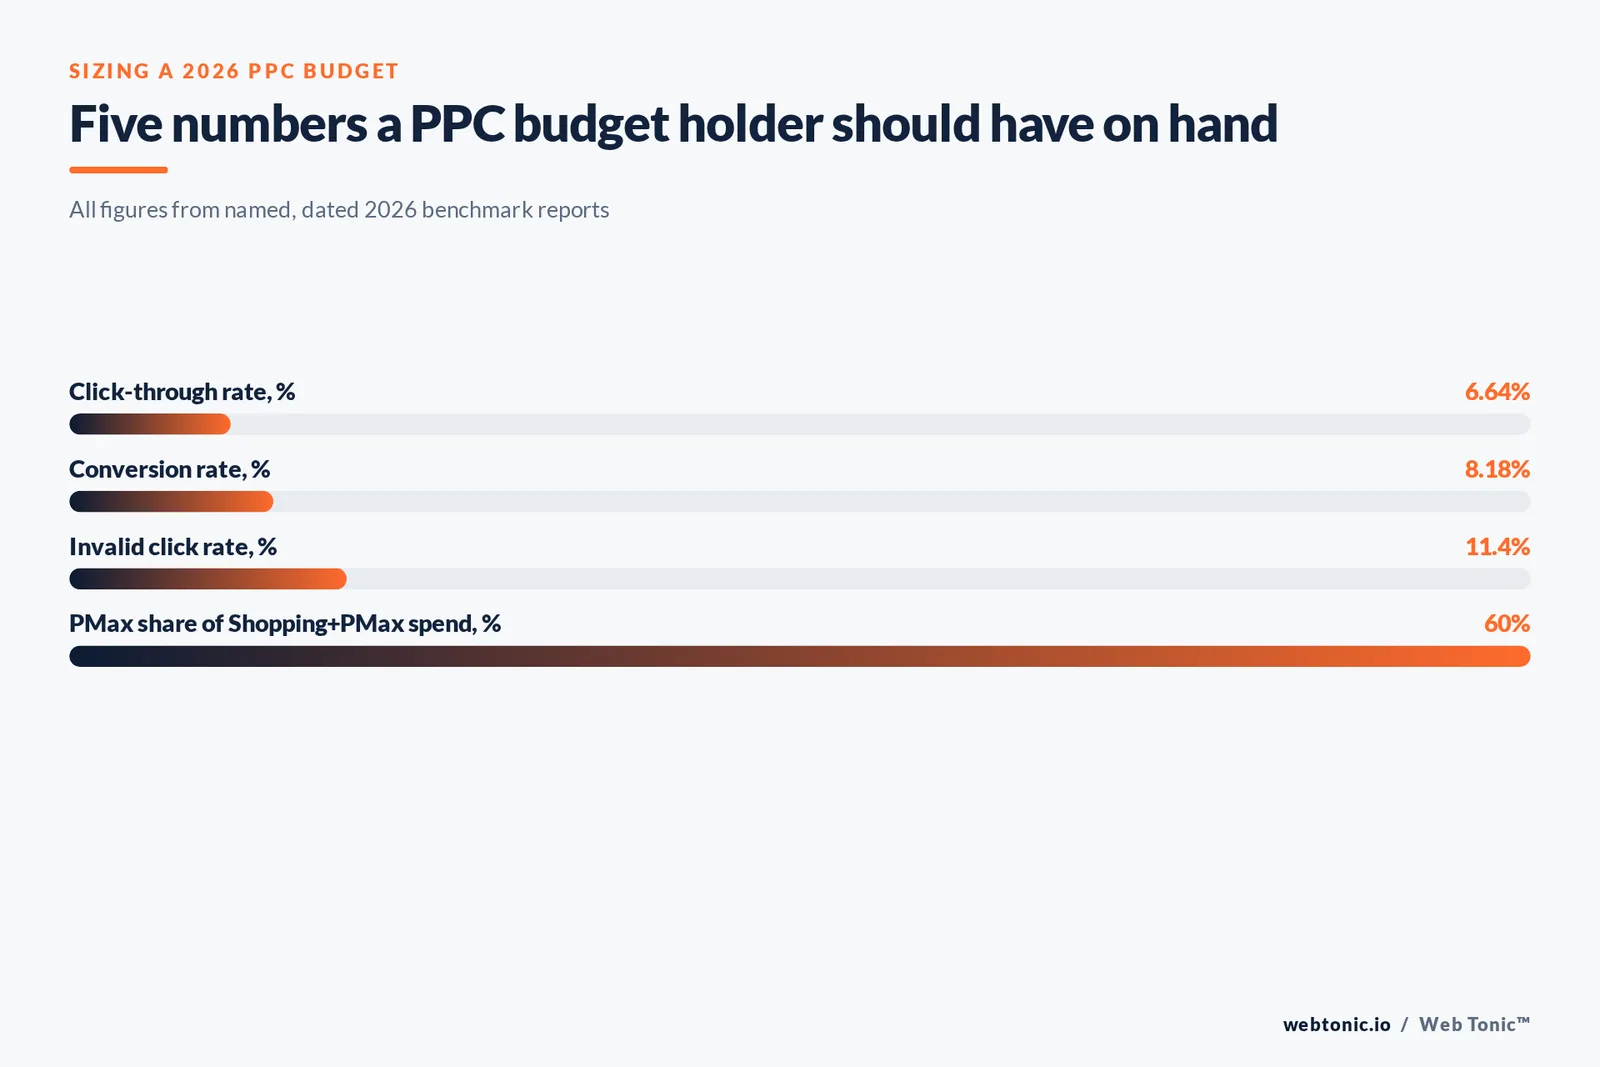
None of the benchmarks above separate a genuine prospect's click from a bot's. Estimates of that share vary by vendor and methodology, which is itself the honest headline. Fraud Blocker's analysis of thousands of Google Ads accounts reports an average invalid click rate of 11.4% specifically inside PPC campaigns. Lunio's 2026 State of Click Fraud Report, surveying 131 senior marketers in May 2026, found 75.6% losing more than 5% of their monthly budget to invalid traffic and 85.6% concerned specifically about agentic AI driving that rate higher.
Lunio's separate global invalid-traffic report calculates an 8.51% average IVT rate across all measured digital ad spend, translating that percentage into roughly USD 63 billion lost in 2025 against total digital ad spend projected above USD 740 billion. The two Lunio figures (8.51% overall digital, versus Fraud Blocker's 11.4% PPC-specific) are close enough to describe the same order of magnitude - somewhere between one in twelve and one in nine clicks - without either vendor claiming the other's exact number.
| Invalid-click / fraud metric (2026 sources) | Figure | Source |
|---|---|---|
| Average invalid click rate, PPC specifically | 11.4% | Fraud Blocker |
| Average IVT rate, all digital ad spend | 8.51% | Lunio Global Invalid Traffic Report |
| Estimated dollars lost to invalid traffic (2025) | ~USD 63 billion | Lunio |
| Marketers losing 5%+ of budget to invalid traffic | 75.6% | Lunio, 131 senior marketers surveyed |
| Marketers concerned about agentic AI + invalid traffic | 85.6% | Lunio |
A second dataset, to check the first one against
Benchmarks are only useful once you have confirmed they are not an outlier. PPC Chief's consolidated 2026 dataset, built by blending multiple publicly reported benchmark sets rather than running one proprietary panel, lands close to WordStream's figures without matching them exactly: a USD 5.26 average CPC, a 6.7% average CTR, a 7.5% average conversion rate and a USD 70.11 average cost per lead or acquisition. The two sets agreeing within a narrow band, despite drawing on different campaign samples, is a useful sanity check before you present either figure as gospel to a client or a board.
| Metric | WordStream 2026 (13,000+ campaigns) | PPC Chief 2026 (consolidated dataset) |
|---|---|---|
| Average CPC | USD 5.42 | USD 5.26 |
| Average CTR | 6.64% | 6.7% |
| Average conversion rate | 8.18% | 7.5% |
| Average cost per lead/acquisition | USD 66.69 | USD 70.11 |
Where the budget is actually flowing: PMax and AI-run campaigns
Adoption of Performance Max has moved from a minority tactic to a default. One 2026 industry report cites 71% of surveyed advertisers running Performance Max, up from 60% the prior year, with PMax accounting for close to 20% of total Google Ads spend among those advertisers. Tinuiti's Q2 2026 Digital Ads Benchmark Report, built from more than USD 4 billion in managed annual ad spend, found PMax accounting for 60% of combined Google Shopping and PMax spend among advertisers running both, down from 67% the prior quarter as some advertisers rebalance back toward standard Shopping. Skai's Q1 2026 Quarterly Digital Trends Report separately tracked Google shipping its largest PMax transparency update to date in the same quarter, including channel-level performance reporting - a response to advertiser pressure for more visibility into where an automated campaign is actually spending.
| PMax share of combined Shopping+PMax spend (Tinuiti, advertisers running both) | Quarter |
|---|---|
| 53% | Q1 2025 |
| 67% | Q1 2026 |
| 60% | Q2 2026 |
The gap between the different adoption figures cited across reports reflects different advertiser sizes and different denominators (all Google Ads spend versus Shopping-specific spend), not a contradiction in the underlying trend.
Digiday's September 2026 reporting, citing comments from Alphabet and Meta executives, put close to 30% of Google's search spend now running through AI Max or Performance Max, alongside Meta's Advantage+ run rate tracking toward USD 75 billion for the year. Read together, both major platforms are steering an increasing share of paid budget into automated, broad-match-adjacent campaign types rather than manually built keyword campaigns.
| Automation adoption metric (2026) | Figure | Source |
|---|---|---|
| Advertisers running Performance Max | 71% | Industry PMax adoption survey |
| PMax share of Google Ads spend (broad advertiser set) | ~20% | Same survey, platform-level data |
| PMax share of spend, large retail advertisers | ~38% | Separate 2026 benchmark report |
| Google search spend running through AI Max/PMax | ~30% | Digiday, citing Alphabet executive comments |
What "average CPL" hides about account maturity
A newly launched account and a five-year-old account with a clean negative-keyword list and years of conversion data will not land on the same cost per lead even inside the identical vertical row of the same benchmark table. Smart Bidding strategies need meaningful conversion volume to exit their learning phase, and an account still accumulating that volume will show a noisier, typically higher, cost per lead for months before it settles near whatever the benchmark table implies is "normal" for that industry. Reading a benchmark as a same-week target for a brand-new account is one of the more common budgeting mistakes we see when a PPC program moves in-house or changes agencies.
The same caution applies in the other direction: an account that has been running the same campaign structure for years without a search-term or negative-keyword refresh can post a cost per lead well above the benchmark not because the vertical is expensive, but because years of accumulated wasted spend on low-intent queries have never been cleaned out.
What this means for a 2026 PPC budget
Benchmark your own CPC, CTR and CVR against the vertical row that matches your account, not the all-industry blend, and build a 5-12% invalid-traffic tax into any projected cost-per-lead model rather than discovering it after the fact. If automation now controls a fifth to a third of the typical account's spend, the manual keyword layer that remains deserves proportionally more scrutiny per dollar, not less, since it is the part still fully under your control.
Our Google Ads benchmark breakdown goes deeper into the same WordStream dataset from a campaign-structure angle, and our complete Google Ads pricing guide walks through budget sizing by business size. If you want a named account audited against these figures, reach out or see how our performance creative team approaches CTR improvement before you touch bids.
Frequently Asked Questions
What is the average cost per click on Google Ads in 2026?
WordStream's 2026 Google Ads Benchmarks report, built from more than 13,000 US-based Search campaigns running April 2025 through March 2026, puts the all-industry average cost per click at USD 5.42. That number moves a great deal by vertical - Attorneys & Legal Services averaged USD 9.87 per click in the same report, while Arts & Entertainment averaged USD 1.63 - so an all-industry figure is a starting point for a budget conversation, not a target for any specific account.
What conversion rate should a PPC campaign expect?
WordStream's same 2026 dataset reports an all-industry average Search conversion rate of 8.18%, against an average cost per lead of USD 66.69. Both figures vary sharply by vertical and by how narrowly "conversion" is defined in the account - a lead-form fill and a completed purchase are very different actions to benchmark against the same percentage.
How much of PPC ad spend is lost to invalid clicks?
Estimates vary by measurement methodology and vendor, which is itself worth flagging before quoting one number as fact. Fraud Blocker's analysis of thousands of Google Ads accounts reports an average invalid click rate of 11.4% specifically for PPC campaigns. Lunio's global report, covering all digital ad spend rather than PPC alone, calculates an 8.51% average invalid-traffic rate translating to roughly USD 63 billion lost in 2025. Treat any single figure as an order-of-magnitude estimate - around one in ten to one in twelve clicks - rather than a precise universal rate.
Is Performance Max replacing standard Search campaigns?
It is taking a growing share of budget without fully replacing Search. Multiple 2026 industry reports converge on Performance Max reaching roughly 20% to 38% of an advertiser's total Google Ads spend, with adoption reported as high as 71% of surveyed advertisers running at least one PMax campaign. Reports citing Tinuiti's Digital Ads Benchmark put standard Search still commanding a comparable or larger share for large retail advertisers, so the honest read for 2026 is co-existence with PMax's share rising, not a full replacement.
Why do PPC benchmark reports disagree with each other so often?
Different sample windows, different account-size mixes, and different ways of classifying an industry all move the reported average. WordStream's 2026 figures (13,000+ campaigns, April 2025-March 2026) and a separate consolidated dataset citing USD 5.26 average CPC and 6.7% CTR are close but not identical, because they are not drawing from the same accounts. Anchor to one named, dated methodology when you report a benchmark internally, and note the date range every time - a number from an April-2024 window is already a year stale by the time a 2026 budget is set.
Sources
WordStream - Google Ads Benchmarks 2026: Competitive Data & Insights
WordStream - Digital Benchmarks by Industry: PPC
Fraud Blocker - 2026 Click Fraud Statistics
Fraud Blocker - Invalid Click Rate: Averages and Benchmarks for Google Ads
Lunio - The State of Click Fraud Report 2026
Lunio - Global Invalid Traffic Report 2026
Digiday - US ad spend set to rise as more ad dollars are handled by AI tools
PPC Chief - 2026 Google Ads Benchmarks, consolidated dataset
Tinuiti - Digital Ads Benchmark Report Q2 2026
Skai - Q1 2026 Quarterly Digital Trends Report


