Table of contents
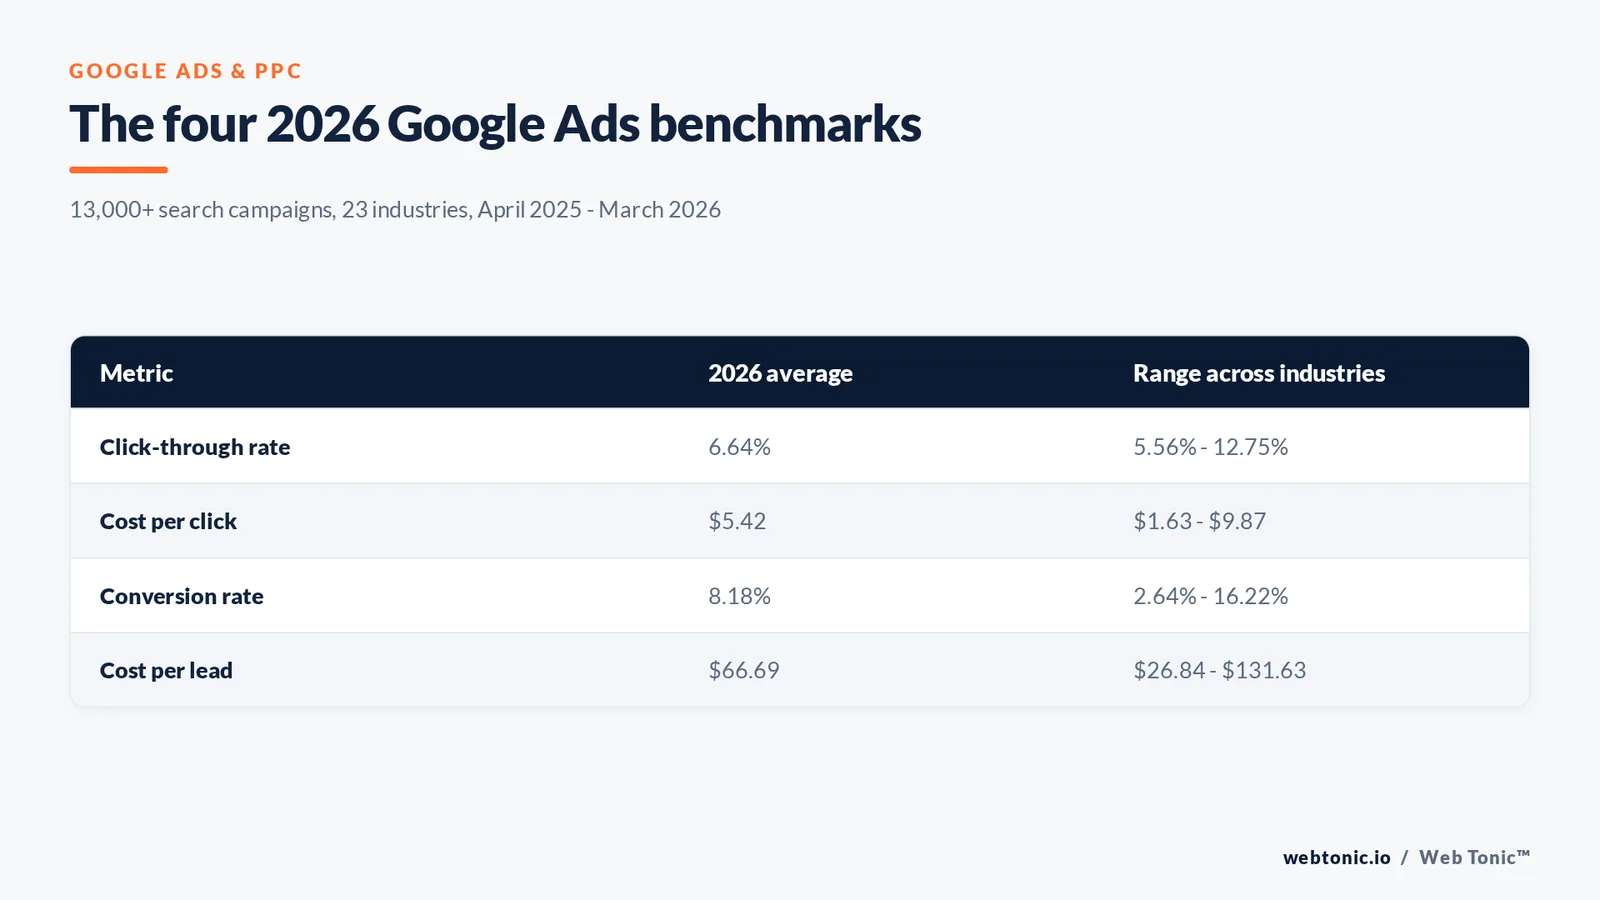
The 2026 all-industry averages in Google Ads are a 6.64% click-through rate, a $5.42 cost per click, an 8.18% conversion rate and a $66.69 cost per lead. Those four numbers come from more than 13,000 search campaigns across 23 industries measured between April 2025 and March 2026.
Key Takeaways
- Average CPC is $5.42 — more than double the $2.32 recorded when these benchmarks began in 2016.
- Cost per lead fell for the first time in five years, landing at $66.69 against $59.18 a decade ago.
- Conversion rate improved in 87% of industries, so cheaper leads are coming from better closing, not cheaper clicks.
- The spread is enormous: $1.63 CPC in Arts & Entertainment versus $9.87 in Attorneys & Legal Services.
- A single industry average hides campaign type — Search, Display, Shopping and Performance Max should never be benchmarked against the same figure.
Google Ads benchmarks 2026: the four headline numbers
Every benchmark below is a median rather than a mean, which keeps a handful of very large or very wasteful accounts from distorting the picture. The source is the 2026 WordStream benchmarks report, now in its tenth year, with the same dataset published by LocaliQ.
| Metric | 2026 average | Range across industries | What it tells you |
|---|---|---|---|
| Click-through rate (CTR) | 6.64% | 5.56% – 12.75% | How relevant your message looks on the results page |
| Cost per click (CPC) | $5.42 | $1.63 – $9.87 | How expensive your auction is |
| Conversion rate (CVR) | 8.18% | 2.64% – 16.22% | How well the click and the landing page match |
| Cost per lead (CPL) | $66.69 | $26.84 – $131.63 | The money metric — CPC divided by CVR |
Note the arithmetic in the last row: CPL is not an independent number. It is CPC divided by conversion rate, which is why a campaign can post an ugly cost per click and still deliver the cheapest leads in its category. Semrush's cost data shows the same pattern across search and display inventory.
Average click-through rate by industry
Click-through rate is the cheapest diagnostic in the account because it moves within days of a copy change. It is also the metric most distorted by brand demand: an entertainment advertiser bidding on its own show name will beat a legal advertiser bidding on generic injury terms every single time.
| Business category | Average CTR | Read |
|---|---|---|
| Arts & Entertainment | 12.75% | Highest of all 23 categories |
| Finance & Insurance | 9.83% | Up 18.01% year over year |
| Travel | 9.32% | Consistently top three |
| Sports & Recreation | 8.75% | High intent, low competition |
| Automotive — For Sale | 8.28% | Model-name queries lift it |
| Shopping, Collectibles & Gifts | 8.28% | Product terms convert on sight |
| Real Estate | 7.61% | Local intent, heavy volume |
| Education & Instruction | 7.56% | Biggest gainer, up 31.71% |
| Animals & Pets | 7.49% | Service and product mix |
| Personal Services | 7.16% | Local service queries |
| Restaurants & Food | 6.83% | Down 9.89% year over year |
| Beauty & Personal Care | 6.75% | Up 18.21% year over year |
| Apparel / Fashion & Jewellery | 6.64% | Exactly the all-industry average |
| Physicians & Surgeons | 6.61% | Symptom queries are broad |
| Furniture | 6.57% | Long consideration cycle |
| Industrial & Commercial | 6.57% | Small, specific audiences |
| Home & Home Improvement | 6.47% | Crowded auction |
| Business Services | 6.10% | B2B terms overlap heavily |
| Career & Employment | 5.88% | Down 10.50% year over year |
| Attorneys & Legal Services | 5.87% | Lowest CTR, highest CPC |
| Health & Fitness | 5.81% | Down 19.08% year over year |
| Dentists & Dental Services | 5.66% | Near the bottom |
| Automotive — Repair, Service & Parts | 5.56% | Lowest of all categories |
Broader market studies report falling click-through rates on both paid and organic results as AI-generated answers absorb more of the page. The benchmark figures above stayed flat instead, which the report attributes to platform-side optimisation — Smart Bidding, intent-based keyword management and visual-first creative doing the work that manual bidding used to.
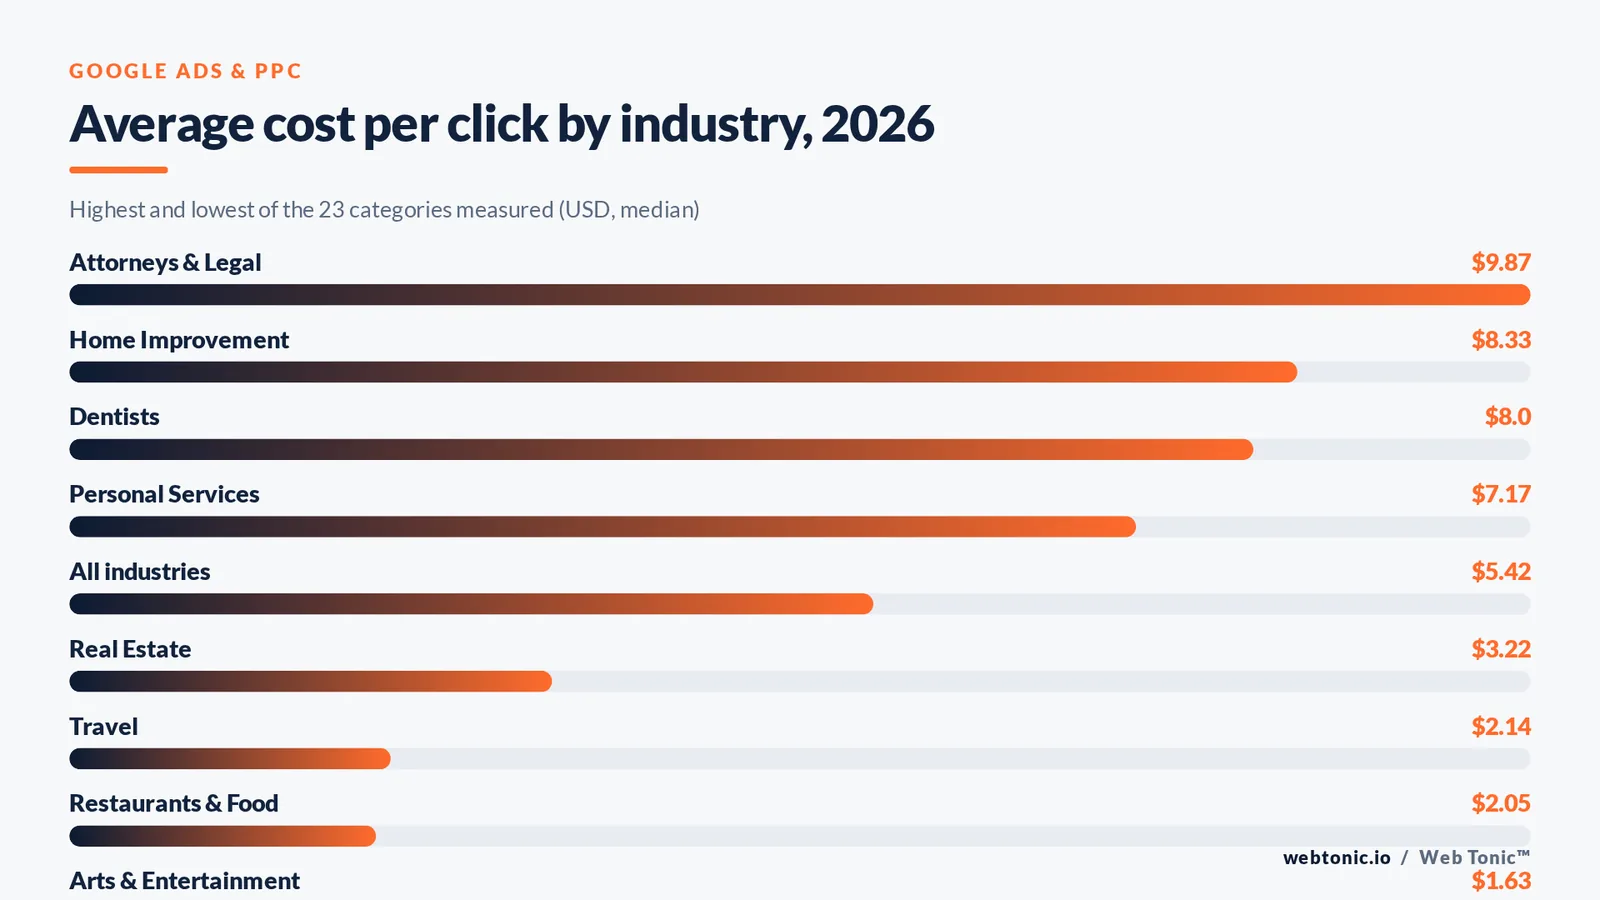
Average cost per click by industry
Cost per click is set by competition, not by your skill. What you control is whether an expensive click reaches a page worth the money. Advertisers in the top three categories are paying five to six times what an entertainment advertiser pays for the same click volume.
| Business category | Average CPC | Year-over-year note |
|---|---|---|
| Attorneys & Legal Services | $9.87 | The most expensive category, again |
| Home & Home Improvement | $8.33 | Contractor demand keeps it high |
| Dentists & Dental Services | $8.00 | Implant and cosmetic terms lead |
| Personal Services | $7.17 | Up about 23.41% |
| Health & Fitness | $6.17 | Up about 23.41% |
| Business Services | $5.87 | At the all-industry line |
| Industrial & Commercial | $5.87 | Low volume, high value |
| Career & Employment | $5.81 | Restricted category rules apply |
| Education & Instruction | $4.81 | Down 22.79% — biggest drop |
| Physicians & Surgeons | $4.76 | Down 29.54% on CPL |
| Beauty & Personal Care | $4.62 | Down 18.95% |
| Apparel / Fashion & Jewellery | $4.44 | Retail seasonality |
| Automotive — Repair, Service & Parts | $4.35 | Emergency intent |
| Shopping, Collectibles & Gifts | $4.14 | Feed-driven demand |
| Animals & Pets | $4.06 | Strong conversion offsets it |
| Furniture | $3.97 | Highest CPL relative to CPC |
| Finance & Insurance | $3.39 | Cheap clicks, weakest CVR |
| Real Estate | $3.22 | Up 27.27% — biggest rise |
| Sports & Recreation | $2.77 | Low competition |
| Automotive — For Sale | $2.27 | Down 5.81% |
| Travel | $2.14 | CPL down 39.35% |
| Restaurants & Food | $2.05 | Near-free clicks |
| Arts & Entertainment | $1.63 | Cheapest clicks measured |
If your own cost per click sits above the category line, the fastest levers are negative keywords, match-type discipline and ad relevance rather than bid cuts. WordStream's analysis of more than 15,000 accounts found that adding a single negative keyword to a search campaign can triple its conversion rate, and their CPC playbook starts there for the same reason.
Average conversion rate by industry
Conversion rate is where the 2026 data is genuinely good news: it improved in 87% of categories, on top of an increase the previous year. Read it alongside what you count as a conversion — an account tracking phone calls, form fills and chats will always look better than one tracking purchases only.
| Business category | Average CVR | Movement |
|---|---|---|
| Animals & Pets | 16.22% | Up 24.10% |
| Automotive — Repair, Service & Parts | 15.51% | Emergency demand converts |
| Education & Instruction | 13.14% | Enquiry forms count as leads |
| Physicians & Surgeons | 12.43% | Appointment intent |
| Personal Services | 12.34% | Up 26.69% |
| Dentists & Dental Services | 10.67% | Call tracking helps |
| Beauty & Personal Care | 10.35% | Up 32.34% — biggest gain |
| Industrial & Commercial | 8.20% | Quote requests |
| Home & Home Improvement | 8.05% | Estimate requests |
| Restaurants & Food | 8.05% | Orders and bookings |
| Sports & Recreation | 7.69% | Membership signups |
| Health & Fitness | 6.94% | Trial offers |
| Automotive — For Sale | 6.01% | Down 22.56% |
| Arts & Entertainment | 5.91% | Ticket purchases |
| Travel | 5.83% | Long research cycle |
| Attorneys & Legal Services | 5.55% | High value per lead |
| Business Services | 4.85% | Down 5.65% |
| Apparel / Fashion & Jewellery | 4.50% | Ecommerce purchase rate |
| Shopping, Collectibles & Gifts | 4.01% | Purchase, not enquiry |
| Real Estate | 3.70% | Browsing intent dominates |
| Career & Employment | 3.05% | Down 29.42% |
| Furniture | 2.99% | High ticket, slow decision |
| Finance & Insurance | 2.64% | Lowest measured CVR |
Average cost per lead by industry
Cost per lead is the number a business owner actually feels, and it is the one that finally moved in the right direction. Compare it against your own closing rate and average order value before you call any figure expensive — a legal lead at $131.63 is cheap against a five-figure case, while a furniture lead at $106.70 may not be.
| Business category | Average CPL | Cross-check |
|---|---|---|
| Attorneys & Legal Services | $131.63 | Highest measured |
| Furniture | $106.70 | Weak CVR drives it |
| Real Estate | $102.51 | Cheap clicks, poor conversion |
| Apparel / Fashion & Jewellery | $97.51 | Purchase-based |
| Business Services | $93.69 | Long B2B cycle |
| Home & Home Improvement | $90.92 | High CPC category |
| Education & Instruction | $77.48 | Strong CVR offsets CPC |
| Industrial & Commercial | $75.19 | Few, large deals |
| Finance & Insurance | $74.44 | 2.64% CVR is the culprit |
| Dentists & Dental Services | $72.97 | $8.00 clicks, 10.67% CVR |
| Career & Employment | $67.36 | Up 7.26% |
| Health & Fitness | $67.36 | Up 7.26% |
| Personal Services | $54.60 | Improving on both axes |
| Shopping, Collectibles & Gifts | $49.40 | Feed-led performance |
| Travel | $44.70 | Down 39.35% — biggest fall |
| Automotive — For Sale | $44.26 | Up 13.90% |
| Sports & Recreation | $44.26 | Stable |
| Physicians & Surgeons | $40.04 | Down 29.54% |
| Beauty & Personal Care | $39.25 | Down 34.95% |
| Animals & Pets | $31.50 | Best CVR in the set |
| Restaurants & Food | $30.57 | Down and cheap |
| Automotive — Repair, Service & Parts | $29.96 | Up 5.12% |
| Arts & Entertainment | $26.84 | Cheapest lead measured |
Ten years of Google Ads benchmarks: what actually changed
The long view matters more than any single year. Clicks doubled in price while the cost of a lead moved barely at all, which means the entire gain came from conversion rate and tracking quality — not from cheaper auctions.
| Dimension | 2016 | 2026 | Change |
|---|---|---|---|
| Average CPC | $2.32 | $5.42 | Up roughly 134% |
| Average CPL | $59.18 | $66.69 | Up about 13% |
| Direction of CPL | Rising | First fall since before 2020 | Reversal |
| Industries covered | 16 | 23 | Broader sample |
| Dominant bidding model | Manual CPC | Smart Bidding and AI-assisted | Automation |
| Dominant campaign mix | Search plus Display | Search, Performance Max, Demand Gen | Consolidation |
Search still carries the load, which is unsurprising when Statcounter puts Google above 91% of global search. But the channel mix around it has changed enough that a 2019 benchmark is a museum piece — eMarketer's channel view and the IAB revenue report both show spend shifting into automated and retail-media formats over the same decade.
Which benchmark applies to your campaign type
This is the mistake that ruins most benchmark reviews. The averages above describe search campaigns in Google Ads and Microsoft Ads. Drop a Display or Performance Max number into the same table and you will fire a campaign that was doing its job.
| Campaign type | Expect CTR | Expect CPC | How to judge it |
|---|---|---|---|
| Search (exact and phrase) | At or above 6.64% | Near the category CPC | CPL against category average |
| Search (broad match) | Lower than exact | Often lower | Search-term quality before CPL |
| Display | Well under 1% | Far below search | Assisted conversions and reach, not CPL |
| Shopping | 2% – 4% typical | Below search | ROAS by product, not CPL |
| Performance Max | Blended, not comparable | Blended across channels | Incremental conversions and channel split |
| Demand Gen | Video and feed norms | CPM-led | View-through and new-customer share |
| Microsoft Ads search | Similar to Google | Usually lower | Same CPL logic, smaller volume |
Performance Max is the clearest example: one campaign spends across search, shopping, display, video and discovery inventory, so its blended click-through rate is a weighted average of six very different auctions. Judge it on incremental conversions and channel distribution instead. On the Microsoft side, the Microsoft Advertising guides document the equivalent campaign types, and the report's averages already blend both platforms.
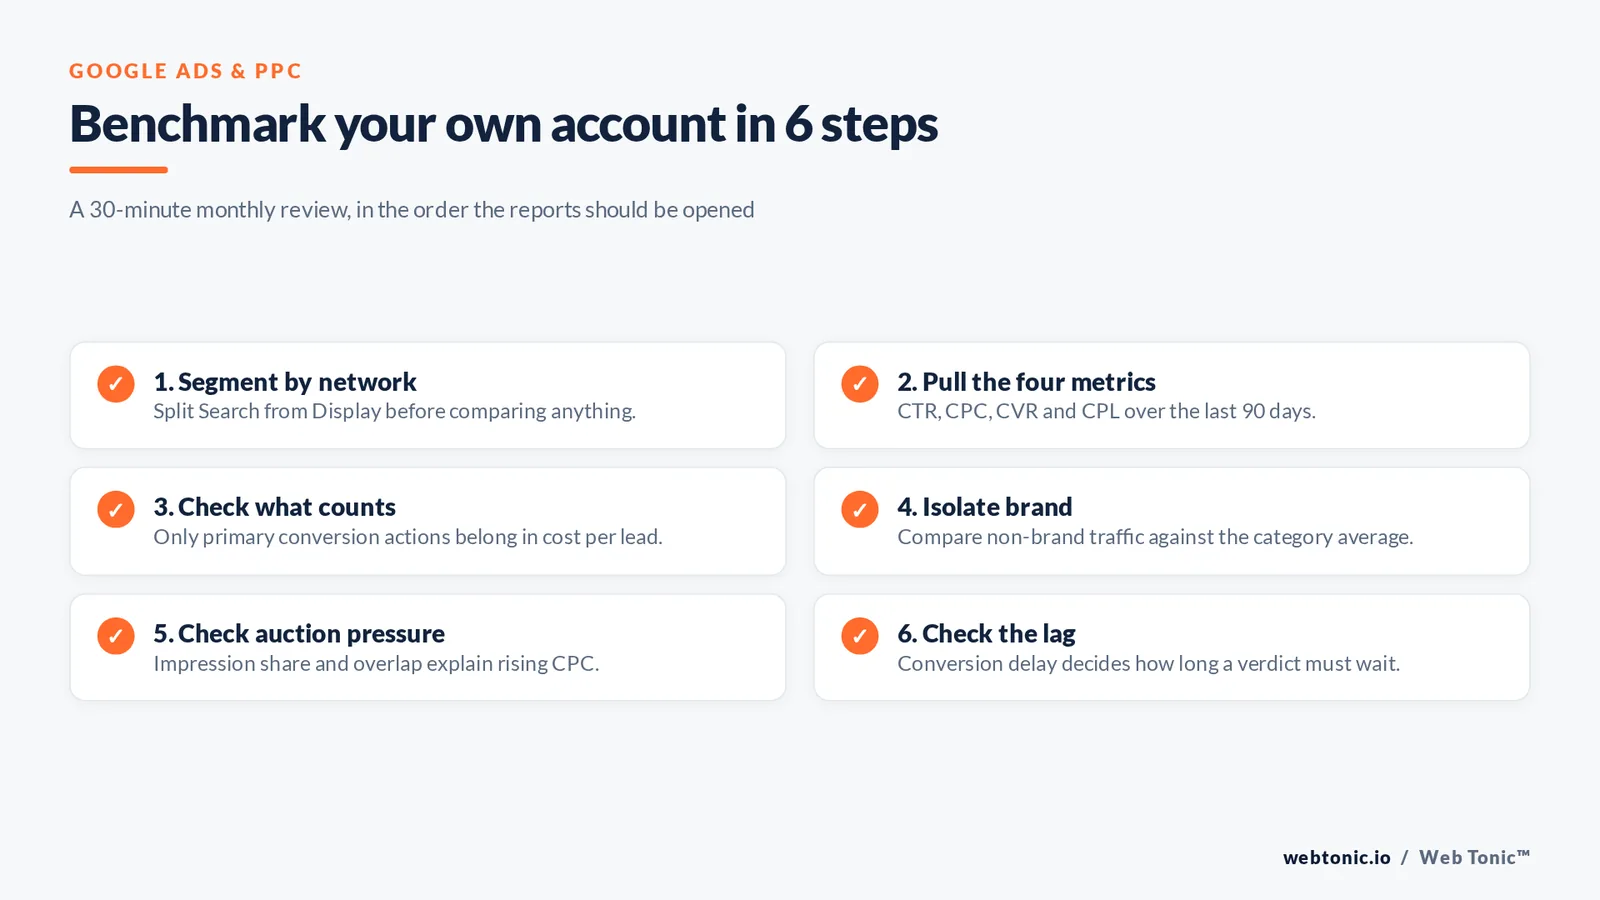
How to benchmark your own account in six steps
Benchmarking is a 30-minute job if you know which report to open. Do it monthly — most account changes take about 30 days to settle, so a weekly comparison is mostly noise.
| Step | Where to look | What to pull | Compare against |
|---|---|---|---|
| 1. Segment by network | Campaigns > Segment > Network | Search vs Display split | Never mix the two |
| 2. Pull your four metrics | Campaigns, last 90 days | CTR, CPC, CVR, CPL | Your category row above |
| 3. Check what counts | Goals > Conversions | Primary vs secondary actions | Only primary in CPL |
| 4. Isolate brand | Search terms report | Brand vs non-brand | Non-brand only |
| 5. Check auction pressure | Auction insights | Impression share, overlap | Category CPC trend |
| 6. Check the lag | Attribution reports | Conversion delay | Lookback window length |
Two traps live in step three and step four. Counting every micro-action as a conversion flatters your cost per lead, and leaving brand terms in the blend flatters everything. Google's own guidance on managing spend is worth reading alongside this: the monthly charging limit is your daily budget multiplied by 30.4, and a single day can overdeliver up to twice the daily figure, which regularly makes a week look off-benchmark when the month is fine.

What to do when you are behind the benchmark
Match the symptom to the fix rather than to a bid change. Nearly every gap between an account and its category average traces back to one of six causes.
| Symptom vs category average | Most likely cause | First action | Time to signal |
|---|---|---|---|
| CTR low, CPC normal | Weak or generic ad copy | Rewrite headlines around the query | 3 – 7 days |
| CTR high, CVR low | Query and page mismatch | Align landing page to the search intent | 2 – 4 weeks |
| CPC high, CTR fine | Broad match leakage | Add negatives, tighten match types | 1 – 2 weeks |
| CVR fine, CPL high | Expensive traffic mix | Reallocate budget to converting terms | 2 – 4 weeks |
| Everything volatile | Too little conversion data | Consolidate campaigns, widen the goal | 30 days |
| Good platform numbers, poor sales | Lead quality, not media | Track leads to revenue, feed values back | 1 quarter |
The last row is the one agencies see most. A cost per lead that beats the category average is worthless if the leads never close, which is why offline conversion imports and value-based bidding matter more than shaving cents off a click. Our data intelligence work usually starts by rebuilding that feedback loop before touching a single bid.
Benchmarks that matter more than these four
CTR, CPC, CVR and CPL are the shared language, not the whole scoreboard. Five more numbers separate accounts that look average from accounts that are actually healthy.
| Metric | Healthy signal | Why it beats the big four |
|---|---|---|
| Non-brand share of conversions | Above 50% | Proves the account creates demand |
| Search impression share (lost to budget) | Under 10% | Shows how much demand you are leaving unbought |
| Quality Score components | Ad relevance and landing page "above average" | Diagnostic on the three inputs you control |
| Lead-to-sale rate by campaign | Stable or rising | Turns CPL into cost per customer |
| Conversion lag | Known and documented | Stops premature verdicts on new campaigns |
| Blended new-customer share | Tracked monthly | Separates growth from remarketing to existing buyers |
On Quality Score specifically: the 1–10 figure is a diagnostic, not an auction input. Use its three components to find weak ad groups; do not chase the number itself. And when you build the reporting layer for all of this, Think with Google's search research and Search Engine Land's Google Ads library are the two places platform changes surface first. If you would rather have the whole benchmark review run for you, that is what our growth marketing team does monthly, and you can see the wider service set on our services page.
FAQ
What is a good click-through rate in Google Ads?
Above 6.64% puts you ahead of the 2026 all-industry average for search campaigns, but the category line is what matters. A 6% CTR is strong for a dental practice and weak for an entertainment brand bidding on its own show titles.
Why is my cost per click so much higher than the average?
Three causes cover most cases: you are in a category where clicks genuinely cost more, you are buying broad-match traffic outside your intent, or your ad relevance is dragging the auction. Check the search terms report before you touch bids.
Are these benchmarks for Google Ads only?
No. The 2026 dataset blends Google Ads and Microsoft Ads search campaigns across 23 industries. Microsoft Ads clicks typically cost less, so a Microsoft-only account will often read better than the blended line.
How often should I compare my account to these figures?
Monthly. Most changes need about 30 days to stabilise, and conversion lag means a fortnight of data will understate performance in any considered purchase category.
Should I benchmark Performance Max against these numbers?
No. A Performance Max campaign spends across search, shopping, display, video and discovery inventory, so its blended metrics are not comparable to a search campaign. Judge it on incremental conversions, channel distribution and new-customer share.
Sources
WordStream / LocaliQ, Google Ads Benchmarks 2026 (13,000+ campaigns, 23 industries, April 2025 – March 2026) · LocaliQ Search Advertising Benchmarks · WordStream, Online Advertising Costs 2026 · Semrush, Google Ads Cost · Google Ads Help: Quality Score, Smart Bidding, Performance Max, Manage your spend · Microsoft Advertising Guides · Statcounter Search Engine Market Share · eMarketer Digital Advertising · IAB Internet Advertising Revenue Report · Think with Google Search · Search Engine Land Google Ads library. Figures are medians in USD. Retrieved 6 August 2026.