



Table of contents
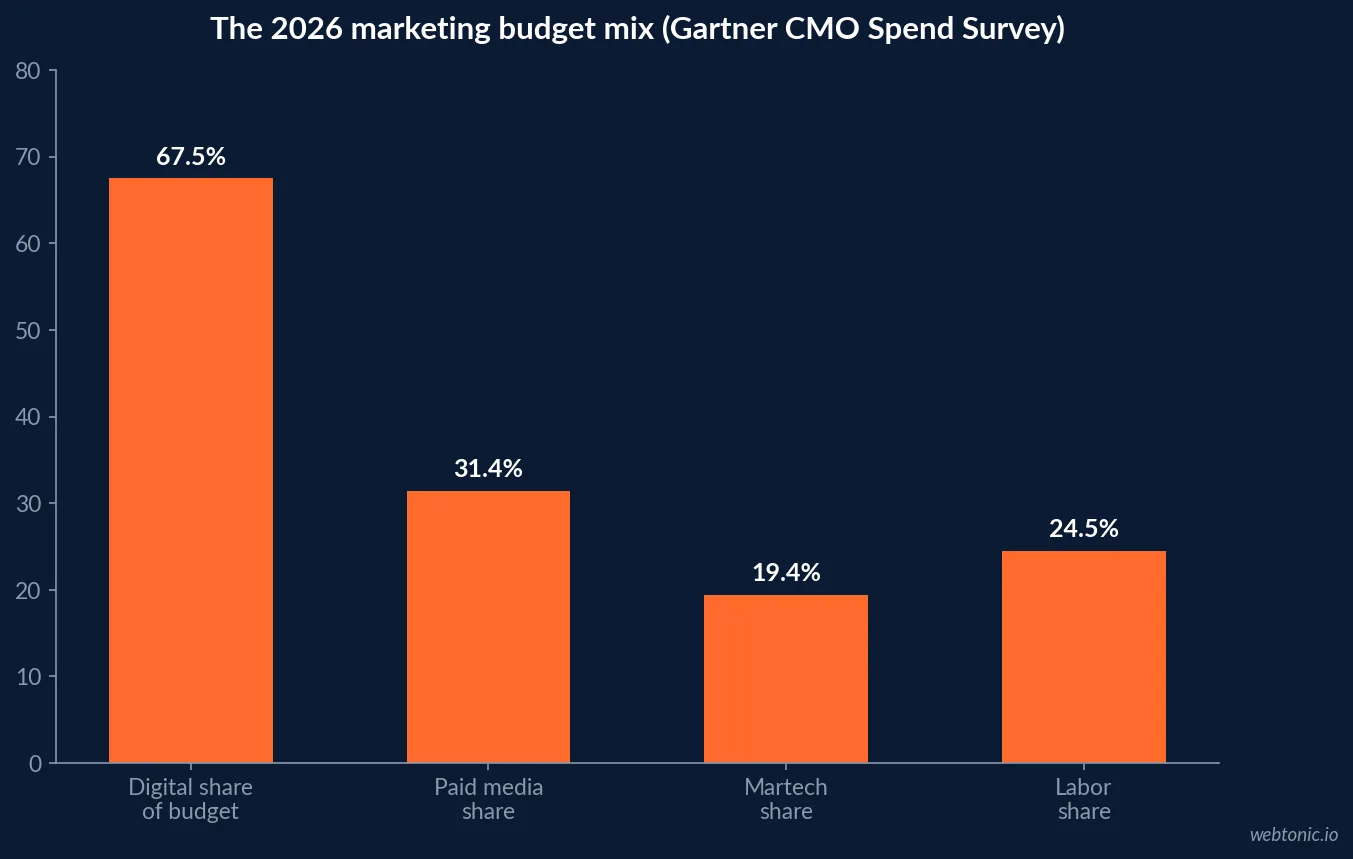
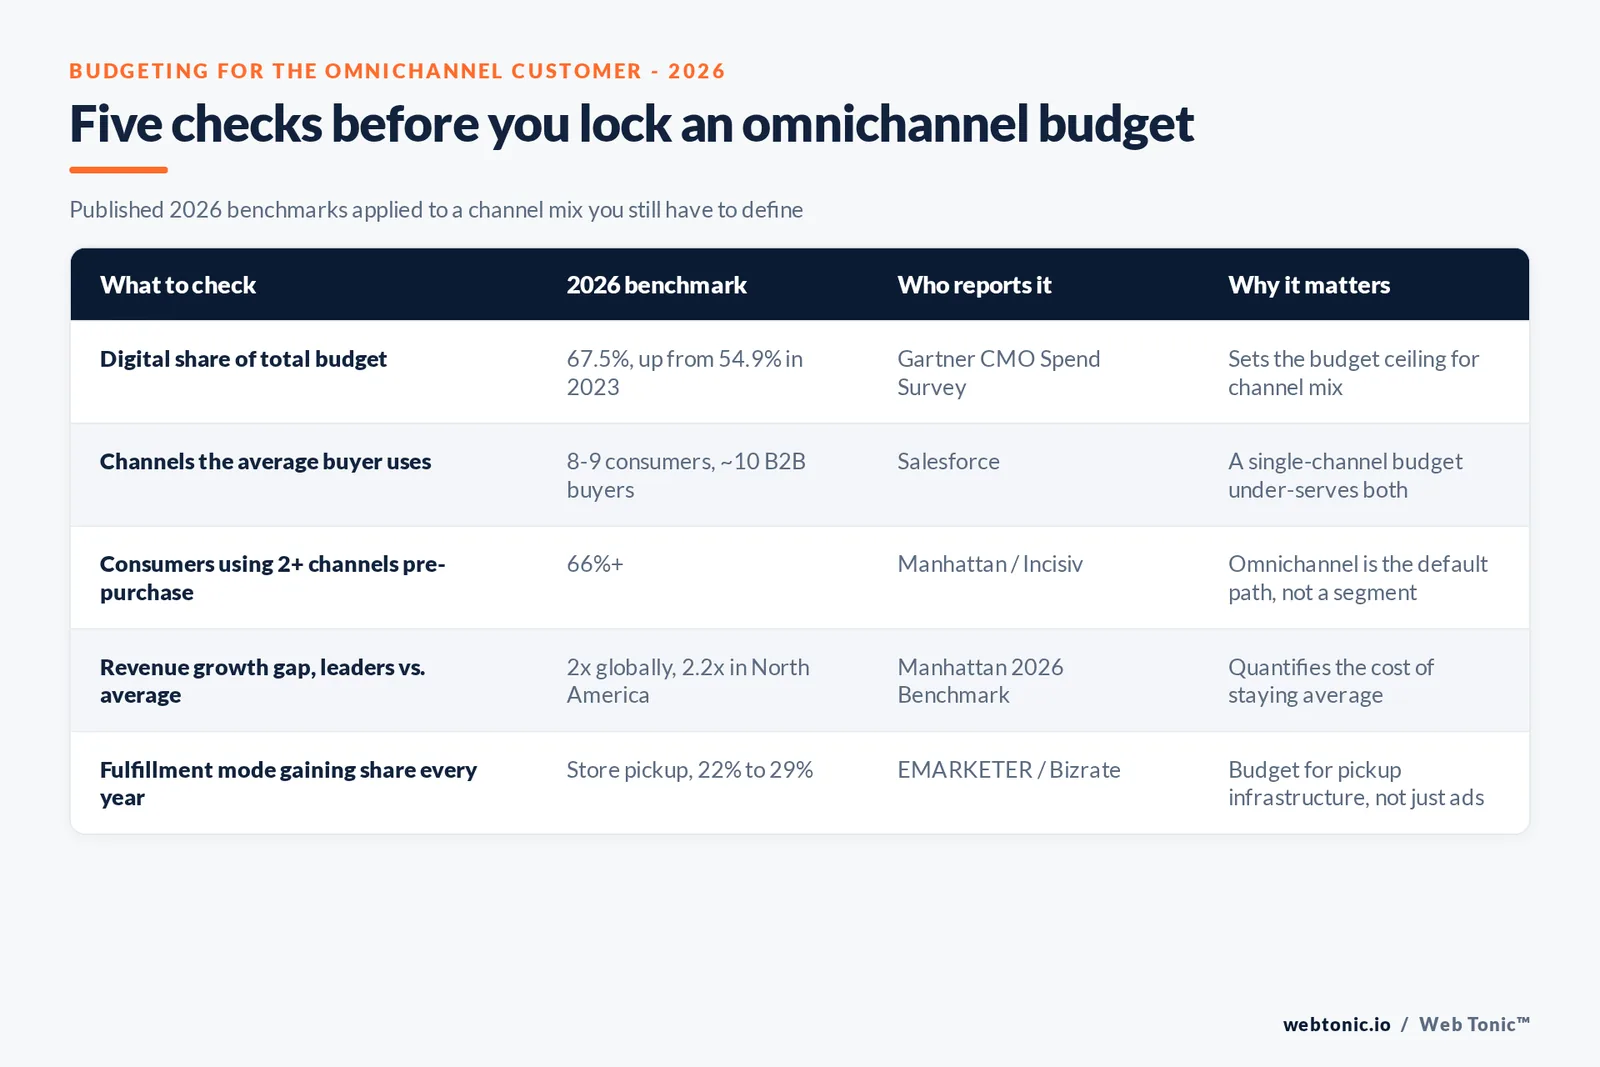
Digital channels now absorb 67.5% of marketing budgets, up from 54.9% just three years ago, while the average customer is juggling eight to ten channels before they buy anything. That gap between budget concentration and customer behavior is the actual omnichannel budgeting problem in 2026, not a lack of channels to choose from.
Key Takeaways
- Digital channels are 67.5% of marketing budgets in 2026.
- That is up from 54.9% of budgets in 2023.
- Paid media reached a five-year high of 31.4% of marketing spend.
- Martech fell to a five-year low of 19.4% of marketing spend.
- Search advertising is 16% of the digital marketing budget.
- Social advertising is a close second at 15.7%.
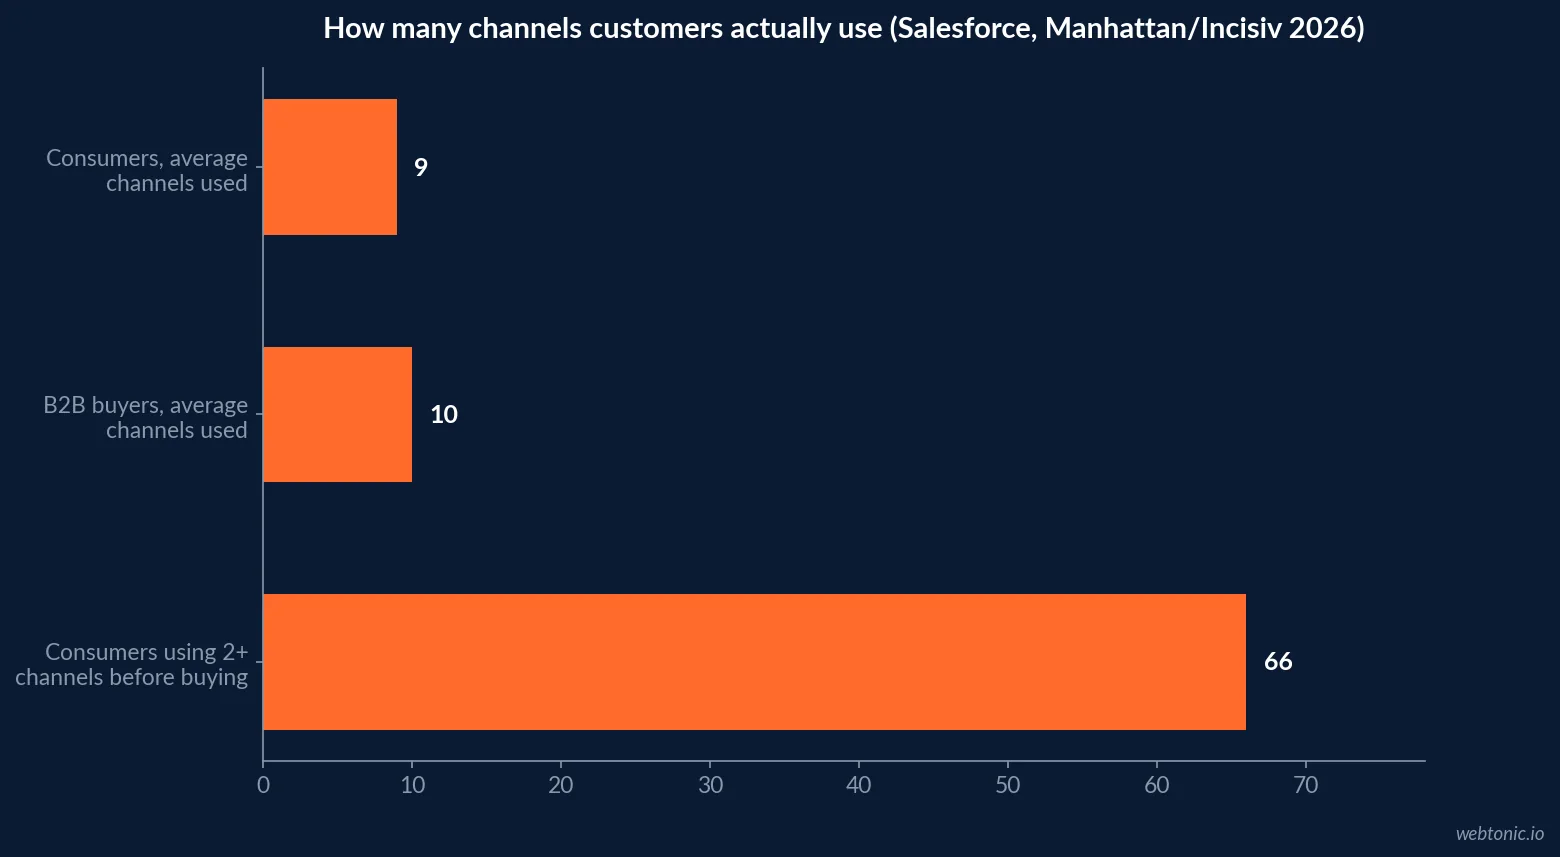
- Consumers use an average of eight to nine channels with a brand.
- B2B buyers use roughly ten channels on average.
- Over 66% of consumers use two or more channels before buying.
- Unified commerce leaders grow revenue 2 times faster globally.
- That gain reaches 2.2 times faster in North America.
- Only 7% of brands reach true unified commerce leadership.
- Store pickup share of digital orders hit 29% in May 2026.
- That is up from 22% in 2023, growing every single year.
- Grocery pickup (31%) has already overtaken home delivery (29%).
- In-store task completion reaches 97% for grocery and restaurants.
- Last-mile fulfillment costs can fall up to 31% in North America.
Omnichannel budget benchmarks at a glance
| Line item | 2026 figure | Prior benchmark |
|---|---|---|
| Digital share of marketing budget | 67.5% | 54.9% (2023) |
| Paid media share of marketing budget | 31.4% | 25.1% (2021) |
| Martech share of marketing budget | 19.4% | 26.6% (2021) |
| Labor share of marketing budget | 24.5% | 21.9% (2025) |
| Marketing budget as % of company revenue | 7.8% | 7.7% (2025) |
The skeleton for these numbers is Gartner's 2026 CMO Spend Survey of 401 CMOs, reported by Chief Marketer. Digital channels have gained 12.6 points of budget share in three years, largely by taking share from martech, which fell from 26.6% to 19.4% of marketing spend over the same window even as 62% of CMOs said they planned to invest more in it - a sign that budgets are shifting toward paid usage of channels rather than toward the tools that manage them.
Where the digital budget itself is going
| Digital channel | Share of digital marketing budget | Change |
|---|---|---|
| Search advertising | 16% | Up from 14.8% last year |
| Social advertising | 15.7% | Up year over year |
| All other digital channels combined | ~68.3% | Split across remaining formats |
How many channels the customer is actually using
Budget concentration only tells half the story. Salesforce's State of the Connected Customer research puts the average consumer at roughly eight to nine channels used to communicate with a brand, and the average business buyer at closer to ten. Manhattan Associates' 2026 benchmark, run with analyst group Incisiv, independently found over 66% of consumers use two or more channels before completing a single purchase - the omnichannel behavior is not a segment, it is the default.
| Audience | Average channels used | Source |
|---|---|---|
| Consumers (general) | ~8-9 | Salesforce State of the Connected Customer |
| B2B buyers | ~10 | Salesforce State of the Connected Customer |
| Consumers using 2+ channels before purchase | 66%+ | Manhattan / Incisiv, 2026 |
| Millennial/Gen Z preferred-channel breadth vs. Boomers | +51% | Salesforce |
What unified commerce leadership is worth
The 2026 Global Unified Commerce Benchmark, sponsored by Manhattan Associates and covering 400-plus retailers across North America, EMEA and Latin America, quantifies the payoff for closing the channel gap: leaders grow revenue 2 times faster globally (2.2x in North America), post 8-13% higher average order values, and cut last-mile fulfillment costs by up to 31% in North America. The catch is how few brands get there - only 7% reach true leadership, and 38% of the capabilities that separated leaders a year ago have already become table stakes for everyone else.
| Unified commerce leader gain (2026 benchmark) | Global | North America |
|---|---|---|
| Revenue growth speed vs. basic-maturity peers | 2x | 2.2x |
| Average order value lift | 8-13% | 22-65% |
| Customer lifetime value lift | n/a | Up to 23% |
| Last-mile fulfillment cost reduction | n/a | Up to 31% |
| Brands reaching true leadership tier | 7% | 7% |
Fulfillment behavior: pickup keeps taking share
EMARKETER's analysis of a June 2026 Bizrate Insights survey found 29% of US digital buyers picked up their online order in store in May 2026, up from 22% in 2023 - the only delivery method to grow every single year. Grocery, the largest digital category, has already flipped: 31% of grocery shoppers now use click-and-collect versus 29% who choose home delivery, according to FMI and NielsenIQ data cited in the same report. Budgeting for omnichannel campaigns without a pickup-ready fulfillment story is increasingly budgeting against the customer's own preference.
The martech-versus-paid-media trade-off inside the budget
The three-point swing in martech's share of budget (26.6% in 2021 down to 19.4% in 2026) is easy to misread as underinvestment in tools. Chief Marketer's read of the Gartner survey suggests the opposite dynamic: 56% of organizations running consumption-based martech pricing have increased how much of their martech budget sits on that usage-based model in the past year, and half of all organizations using it are continually renegotiating contracts to avoid cost spikes. Budgets are shifting from fixed licenses toward pay-for-what-you-use tooling, which frees dollars to move into paid media - the 31.4% figure - without a net increase in total marketing spend as a share of revenue, which sat essentially flat at 7.8% in 2026 versus 7.7% in 2025.
That flat top-line budget is the real constraint behind every allocation decision in this article: omnichannel plans are being funded by reshuffling an unchanged pool of money, not by a growing one, which is exactly why the channel-by-channel evidence above matters more than a simple "spend more everywhere" recommendation.
| Budget dynamic | 2026 figure | What is driving it |
|---|---|---|
| Organizations increasing consumption-based martech allocation | 56% | Cost control on underused licenses |
| Organizations continually renegotiating martech contracts | 50% | Avoiding usage-based cost spikes |
| Marketing budget as % of company revenue | 7.8% | Essentially flat vs. 7.7% in 2025 |
| CMOs planning to increase paid media spend | 53% | Shift from tooling into channel spend |
The grocery case study: when pickup overtakes delivery
Grocery is worth isolating because it is the largest digital retail category and the first place pickup has overtaken delivery outright. FMI and NielsenIQ data cited by EMARKETER put grocery click-and-collect at 31% of digital orders against 29% for home delivery - a reversal driven mostly by cost, not convenience: GWI research finds 78% of online grocery shoppers say they are actively watching their spending, and pickup lets them avoid a delivery fee entirely. For any category with comparable fee sensitivity, that is the leading indicator of where fulfillment budget should move next, ahead of the broader market catching up.
| Grocery fulfillment channel | Share of digital orders | Source |
|---|---|---|
| Click-and-collect / pickup | 31% | FMI & NielsenIQ |
| Home delivery | 29% | FMI & NielsenIQ |
| Online grocery shoppers watching spend closely | 78% | GWI |
The read for budget owners outside grocery is not to copy grocery's exact channel split, but to treat it as an early signal: whichever category has the tightest fee sensitivity and the highest purchase frequency is the one most likely to tip toward pickup next, and the fastest way to find out is to check whether a delivery fee - rather than a shipping delay or a trust concern - is the top-cited reason customers give for choosing pickup in your own post-purchase survey.
Which channel actually resolves the customer's problem
Qualtrics' 2025 Omnichannel Benchmark Study measured task completion, ease and satisfaction across six channels and found in-store grocery and restaurant interactions hit 97% task completion, the highest of any channel and industry combination measured. Mobile apps ranked a consistent second, ahead of every other digital channel, while virtual agents and call centers ranked near the bottom - useful context for teams deciding which channel gets the next round of experience investment rather than just the next round of media spend.
The study's most actionable finding is what happens when resolution succeeds: the gap between channels narrows dramatically once an issue is actually resolved, even for a lagging channel like a virtual agent, which approaches in-store satisfaction levels once the customer's problem is solved. When it is not resolved, everything collapses together at the bottom - customers who are unsure whether their issue was resolved score nearly as poorly as those who know it was not. That reframes a budget debate over which channel to fund into a simpler one: fund the resolution rate first, on whichever channel the customer already chose, and channel-level satisfaction differences shrink on their own.
Put together with the budget-share data above, a practical order of operations for 2026 follows: fix resolution rate on the channels customers already use, fund the pickup and fulfillment infrastructure the data says they prefer, and only then debate whether the next incremental dollar goes to paid media, martech or labor - a channel mix built on an unresolved service gap underperforms regardless of which budget line absorbs the increase. That sequencing also happens to be the cheapest of the three: fixing resolution rate is largely a process and staffing question, while shifting the budget mix or the fulfillment footprint both require new spend.
For teams translating this into a media plan, the fastest place to start is auditing which paid channels are actually reinforcing the fulfillment options customers already prefer; our growth marketing and performance creative teams build that channel mix around real purchase-path data rather than a fixed budget template, and our ROI breakdown of Facebook Ads is a useful companion read for the social share of that digital budget. Reach out through our team page if you want a second read on your own channel mix.
Frequently Asked Questions
What share of a 2026 marketing budget should go to digital channels?
Gartner's 2026 CMO Spend Survey of 401 CMOs found digital channels now account for 67.5% of marketing expenses, up from 54.9% in 2023. Inside that digital line, paid media reached a five-year high of 31.4% of marketing budget, while martech fell to a five-year low of 19.4%. Treat that split as the current market center of gravity, not a fixed rule - it moved 13 points in three years and will keep moving.
How many channels do customers actually use before buying?
Salesforce's State of the Connected Customer research puts the average consumer at roughly eight to nine channels and the average B2B buyer at about ten. That number has been climbing for years, and Manhattan's 2026 Global Unified Commerce Benchmark separately found over 66% of consumers now use two or more channels before completing a single purchase, which is the practical floor for any omnichannel plan.
Does investing in omnichannel fulfillment actually pay back?
Manhattan Associates' 2026 Global Unified Commerce Benchmark, covering 400-plus retailers, found leaders grow revenue twice as fast as basic-maturity peers globally (2.2x in North America), with 8-13% higher average order values and up to 31% lower last-mile fulfillment costs in North America. Only 7% of brands in the benchmark reached true leadership, so the gap between average and leading is still wide open.
Is store pickup growing or shrinking as a fulfillment channel?
Growing, and it is the only delivery method gaining share every year according to EMARKETER and Bizrate Insights: 29% of US digital buyers picked up an online order in store in May 2026, up from 22% in 2023. In grocery, the largest digital category, pickup has already overtaken home delivery, 31% to 29%.
Which channel actually resolves customer problems best?
In-store, by a wide margin. Qualtrics' 2025 Omnichannel Benchmark Study measured task completion across six channels and found in-store grocery and restaurant interactions hit 97% task completion, the highest of any channel measured, with mobile apps a consistent second and virtual agents and call centers trailing the field.
Sources
Chief Marketer - Gartner 2026 CMO Spend Survey
Salesforce - State of the Connected Customer
EMARKETER - Shoppers Keep Heading Back to the Store
Manhattan Associates - 2026 Global Unified Commerce Benchmark
Qualtrics - Customer Experience Benchmarking


