Table of contents
A mortgage dashboard that ends at leads and clicks is measuring the wrong business. Independent mortgage banks earned a pretax net production profit of $727 per loan in Q1 2026 against $11,898 in production costs — a 6% margin on cost that no lead-count report can protect.
Key Takeaways
- IMBs posted a pretax net production profit of $727 per loan in Q1 2026, up from $674 in Q4 2025.
- Total loan production expenses climbed to $11,898 per loan, up from $11,102 the prior quarter.
- Production expenses have averaged $7,903 per loan since Q1 2008 — today’s cost base is roughly 50% above the long-run norm.
- Production expenses reached 336 basis points, up from 323 bps.
- 76% of lenders were profitable overall in Q1 2026, up from 68% in Q4 2025.
- Average production volume per company was $621 million and 1,729 loans, both down quarter over quarter.
- The average first-mortgage loan balance rose to $387,881, with a 65% purchase share among reporting companies.
- Servicing net financial income improved to $77 per loan serviced, from $13 the prior quarter.
- Application-to-fund cycle time benchmarks at 45 days against an automation target of 12–18 days.
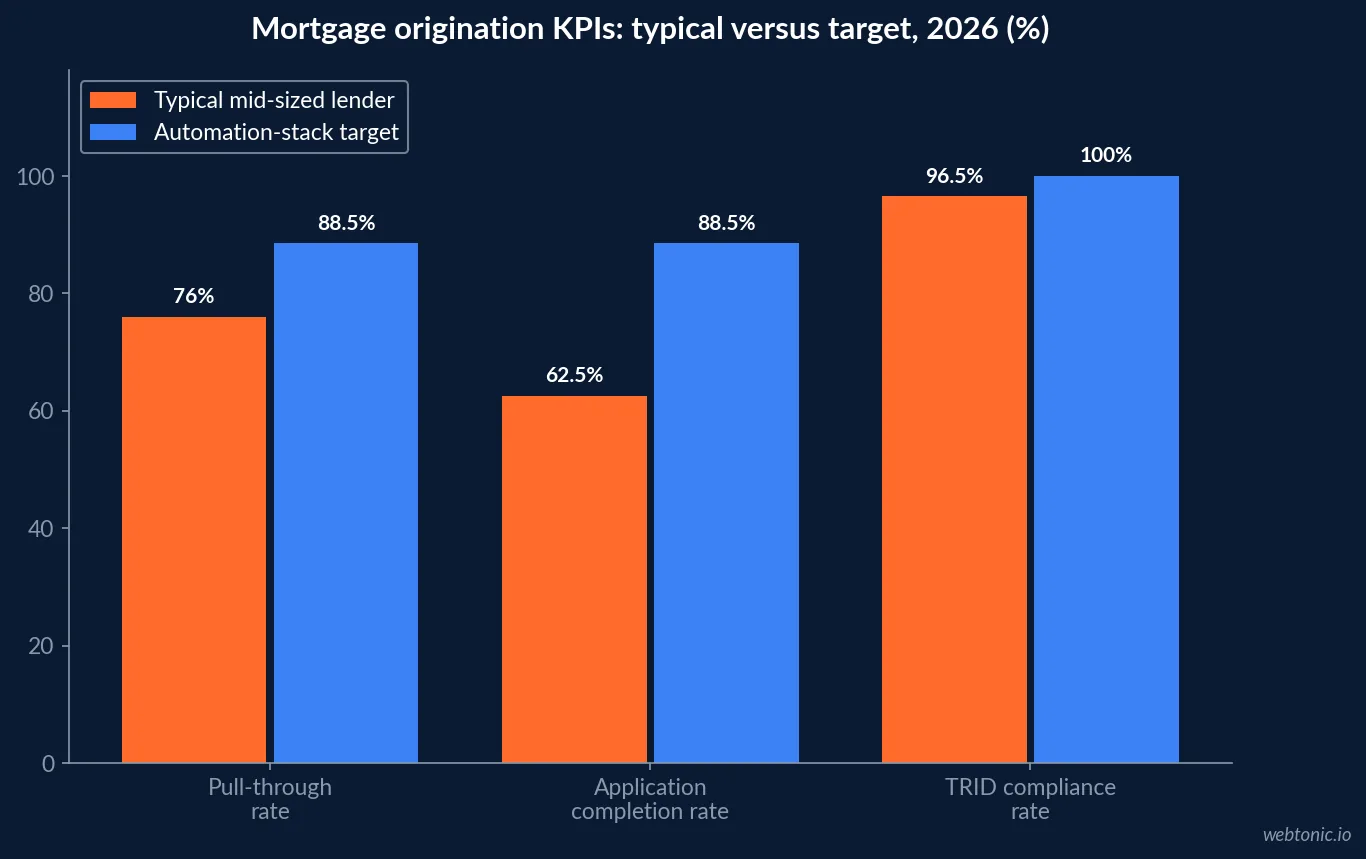
- Pull-through runs 70–82% at typical mid-sized lenders versus an 85–92% target.
- Application completion sits at 55–70% against the same 85–92% target.
- Critical defect rate benchmarks at 1.79% with a target below 0.5%.
- Loan officer productivity is 4–6 loans a month in purchase-heavy markets and 8–12 in refi-heavy ones.
- TRID compliance sits at 95–98% where the only acceptable target is 100%.
- HMDA filing preparation consumes 80–120 FTE-hours a year at typical lenders.
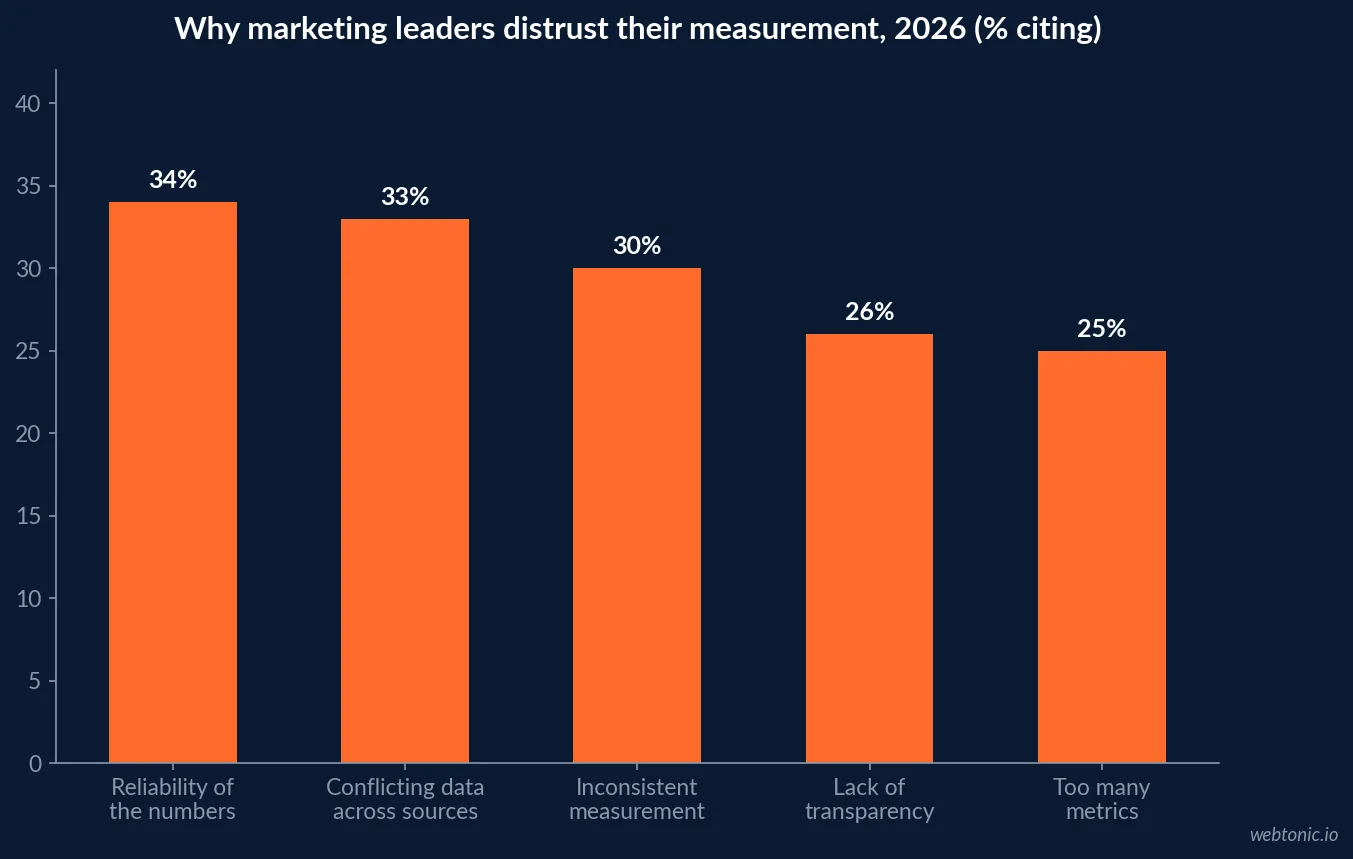
- 34% of marketing leaders are concerned about the reliability of their measurement and 33% cite conflicting data.
- 30% report inconsistent measurement across channels, 26% a lack of transparency and 25% too many metrics.
- 99% of organisations say defining metrics separately in each BI tool is a challenge.
- 49% name multiple data sources and 38% weak governance as their biggest obstacles — not a lack of tooling.
- 67% of marketing teams say data quality issues affect campaign decisions.
- 42% of CRM records contain at least one error, and poor marketing data quality costs enterprises about $12.9 million a year.
- 52% of marketers say an external data team defines their data strategy and measurement.
- Most teams spend 10–20 hours a week on manual reporting; automation cuts it to under 2.
- 79% of agencies save five or more hours a week with AI, with reporting the top use case at 42%.
- Agentic workflow automation is live at 38% of agencies, and 58% have increased human oversight.
- Self-service BI is used by 56% of organisations, mostly by non-technical staff.
- Reported BI ROI runs 188% for basic report automation, 389% for departmental systems and 400–1,000% for strategic deployments.
- 83% of lenders are evaluating AI tools but only 17% have deployed it in live production workflows.
The Margin That Defines The Dashboard
Every reporting decision in a mortgage business should start from unit economics. MBA’s Q1 2026 performance report shows independent mortgage banks earned a pretax net production profit of $727 per loan, up from $674 in Q4 2025, while total production expenses rose to $11,898 per loan and 336 basis points, average volume per company fell to $621 million and 1,729 loans, the average first-mortgage balance reached $387,881, and 76% of lenders were profitable overall.
| Metric | Q1 2026 | Q4 2025 | Dashboard implication |
|---|---|---|---|
| Net production profit per loan | $727 | $674 | The headline denominator |
| Production expense per loan | $11,898 | $11,102 | Marketing is a line inside this |
| Production expense (bps) | 336 | 323 | Track alongside volume mix |
| Volume per company | $621M | $643M | Fixed costs spread over fewer loans |
| Loans per company | 1,729 | 1,973 | Unit view, not dollar view |
| Average loan balance | $387,881 | $379,587 | Revenue per unit is rising |
| Lenders profitable overall | 76% | 68% | Servicing is carrying production |
| Servicing income per loan serviced | $77 | $13 | Report both business lines |
The historical anchor matters too: production expenses have averaged $7,903 per loan since Q1 2008, so the current cost base sits roughly 50% above the long-run norm. On a $727 margin, a marketing dashboard that cannot express spend as cost per funded loan is not a management tool.
The Operational KPI Board
Marketing reporting in mortgage is meaningless without the operational half beside it, because operations decides how many marketing-sourced applications survive. Benchmarks put cycle time at 45 days against a 12–18 day target, production cost per loan at $11,800 against a $5,400–$7,200 target, critical defect rate at 1.79% against sub-0.5%, pull-through at 70–82% against 85–92%, application completion at 55–70%, TRID compliance at 95–98%, loan officer productivity at 4–6 loans a month purchase-heavy or 8–12 refi-heavy, pre-close exception rates of 8–15%, and HMDA filing preparation at 80–120 FTE-hours.
| KPI | Industry baseline | Target | Owner |
|---|---|---|---|
| Application-to-fund cycle time | 45 days | 12–18 days | Operations |
| Pull-through rate | 70–82% | 85–92% | Shared |
| Application completion rate | 55–70% | 85–92% | Marketing and product |
| Production cost per loan | $11,800–$11,898 | $5,400–$7,200 | Finance |
| Critical defect rate | 1.79% | <0.5% | Quality control |
| Loans per LO per month | 4–6 purchase / 8–12 refi | 10–18 with automation | Sales management |
| TRID compliance rate | 95–98% | 100% | Compliance |
| HMDA filing prep | 80–120 FTE-hours | <10 hours review | Compliance |
Note where the marketing team is genuinely accountable: application completion. A 55–70% completion rate is a product and page problem before it is an operations problem, which is why it belongs on the marketing dashboard rather than buried in an origination report. Our mortgage landing page statistics cover that surface directly.
Why Leaders Do Not Believe Their Own Numbers
Distrust is now the default posture, and it is specific rather than vague. Marketing leaders cite concerns about reliability (34%), conflicting data (33%), inconsistent measurement across channels (30%), lack of transparency (26%), too many metrics (25%) and lack of access to data.
The root cause is definitional, not technical. Research across large organisations finds 99% say defining metrics separately in each BI or analytics tool is a challenge, with 49% naming multiple data sources and 38% weak governance as their biggest obstacles — in other words, the problem is rarely a missing dashboard.
| Symptom | Share reporting it | Real cause | Fix |
|---|---|---|---|
| Numbers look unreliable | 34% | Undefined metric logic | One written definition per KPI |
| Sources conflict | 33% | Platform vs CRM vs LOS | Declared source of truth per metric |
| Inconsistent across channels | 30% | Different conversion events | Standardise on funded units |
| No transparency | 26% | Black-box modelled data | Label modelled vs observed |
| Too many metrics | 25% | Dashboard sprawl | Seven-metric executive view |
| Metric drift between tools | 99% see it as a challenge | No semantic layer | Central definitions layer |
Data Quality Is The Hidden Line Item
Dashboards inherit the quality of what feeds them. Analytics benchmarking reports 67% of marketing teams saying data quality issues affect campaign decisions, 42% of CRM records containing at least one error, an average annual cost of poor marketing data quality near $12.9 million at enterprise scale, and 52% year-over-year growth in marketing data volume. Supermetrics research adds that 52% of marketers say an external data team defines their data strategy and measurement.
In a mortgage CRM, that error rate is not abstract. A duplicated borrower record splits a funded loan across two lead sources. A missing referring-agent field turns a partner-sourced loan into “direct.” A mistyped loan amount distorts revenue-weighted channel reporting for the whole quarter.
| Data defect | Where it originates | What it corrupts |
|---|---|---|
| Duplicate borrower records | Multiple entry points | Cost per funded loan by source |
| Missing referring-partner field | Manual intake | Referral programme ROI |
| Lead source overwritten at handoff | CRM-to-LOS sync | All channel attribution |
| Unmapped call sources | No dynamic number insertion | Phone-driven volume |
| Stale campaign taxonomy | Ad-hoc UTM naming | Period-over-period comparisons |
| Untagged database campaigns | Email sent outside the CRM | Reactivation performance |
Fixing intake beats buying visualisation. Our mortgage tracking and analytics statistics and our mortgage Google Ads statistics cover the upstream wiring and channel benchmarks these dashboards depend on.
What Manual Reporting Actually Costs
The labour case for automation is now well quantified. Most marketing teams spend 10–20 hours a week pulling data, formatting charts and writing summaries, and automated pipelines typically cut that to under 2. Agency benchmarking shows 79% of agencies save five or more hours a week with AI, reporting and performance summaries lead adoption at 42%, agentic AI already runs workflow automation at 38% of agencies, and 58% have increased human oversight to keep quality high.
| Reporting mode | Weekly hours | Cadence achieved | Risk |
|---|---|---|---|
| Manual spreadsheet pulls | 10–20 | Monthly, often late | Transcription errors |
| Semi-automated connectors | 3–6 | Weekly | Metric drift between tools |
| Governed pipeline plus BI | <2 | Daily or live | Requires definitions upfront |
| AI-drafted commentary | <2 plus review | Weekly narrative | Needs human sign-off |
The gain is cadence rather than headcount. A weekly review that takes two hours actually happens weekly; a monthly report that takes twelve hours slips into the following month and stops changing decisions. Reported BI returns run about 188% for basic report automation, 389% for departmental systems and 400–1,000% for mature strategic deployments, and self-service BI is now used by 56% of organisations, mostly by non-technical staff.
Where AI Sits In The Mortgage Reporting Stack
Evaluation is near-universal, deployment is not. Lender survey data shows 83% of firms evaluating AI tools across the business but only 17% with it deployed in live production workflows, with volume growth from existing staff the top priority for the second half of 2026.
| AI application | Risk level | Recommended stance |
|---|---|---|
| Drafting weekly report commentary | Low | Adopt now, human sign-off |
| Anomaly detection on spend and pacing | Low | Adopt now |
| Lead-source classification cleanup | Medium | Pilot with audit trail |
| Forecasting funded volume | Medium | Pilot alongside existing model |
| Automated budget reallocation | High | Human-in-the-loop only |
| Any credit or underwriting decision | Highest | Governed, documented, out of scope for marketing dashboards |
That last row is not a stylistic caution. Reporting layers that begin to influence pricing or eligibility decisions inherit fair-lending obligations, and the governance expectations placed on lender AI use in 2026 are explicit. Keep the marketing dashboard on the marketing side of that line.
A Dashboard Specification Worth Copying
One executive view, one operating view, one diagnostic layer. The executive view carries seven numbers and nothing else; the operating view is where channel and loan officer detail lives; the diagnostic layer holds the click and cost metrics teams need weekly but leaders do not.
| View | Metrics | Audience | Cadence |
|---|---|---|---|
| Executive | Cost per funded loan, funded units, pull-through, cycle time, marketing-attributable share, spend, profit per loan | Owner and CFO | Monthly |
| Operating | By channel: applications, cost per application, lead-to-funded, loans per LO | Marketing and sales leads | Weekly |
| Diagnostic | CPC, CPL, CTR, landing page CVR, call answer rate | Practitioners | Daily |
| Partner | Loans per referring agent, partner-sourced share | Business development | Quarterly |
| Compliance | TRID rate, defect rate, disclosure timing | Compliance | Continuous |
Two rules keep it honest. First, every metric has one written definition and one declared source system — that alone addresses the 33% conflicting-data complaint and the 99% metric-definition problem. Second, lead-level metrics never appear without their funded-loan counterpart, because lead-to-funded rates range from 0.5–2% on shared aggregator leads to 40–60% on agent referrals, so a cost-per-lead comparison between them is actively misleading.
Built that way, the reporting layer earns its keep in the same quarter it ships. If you want it designed around funded-loan economics rather than platform screenshots, our data intelligence and growth marketing teams do exactly this, and our mortgage digital marketing statistics supply the channel benchmarks to calibrate against.
Frequently Asked Questions
What KPIs belong on a mortgage marketing dashboard in 2026?
Seven, in this order: cost per funded loan, funded units, pull-through rate, application completion rate, application-to-fund cycle time, loans per loan officer per month, and marketing-attributable share of funded volume. Cost per lead and click metrics belong on a second tab as diagnostics. The reason is margin: MBA data shows independent mortgage banks earned a pretax net production profit of $727 per loan in Q1 2026 while total production expenses reached $11,898 per loan. At that spread, a dashboard that cannot connect spend to funded units cannot inform a single meaningful decision.
What are current mortgage origination KPI benchmarks?
Application-to-fund cycle time has an industry baseline near 45 days with automation-stack targets of 12–18 days. Pull-through runs 70–82% at typical mid-sized lenders against an 85–92% target. Application completion is 55–70% versus an 85–92% target. Critical defect rate benchmarks at 1.79% with a sub-0.5% target. Loan officer productivity is 4–6 loans a month in purchase-heavy markets and 8–12 in refi-heavy ones. TRID compliance sits at 95–98% where the only acceptable target is 100%, and HMDA filing preparation consumes 80–120 FTE-hours a year at most lenders.
How much time does manual marketing reporting actually cost?
Most teams spend 10–20 hours a week pulling data, formatting charts and writing summaries, and reporting automation typically cuts that to under two hours. Agency benchmarking shows 79% of agencies now save five or more hours a week using AI, with reporting and performance summaries the single most automated task at 42%, agentic workflow automation at 38%, and 58% of agencies increasing human oversight to protect quality. For a lender, the recovered hours matter less than the cadence change: weekly reporting that takes two hours actually happens weekly.
Why do marketing leaders distrust their own dashboards?
Because the numbers disagree and nobody owns the definitions. Survey data shows 34% of leaders concerned about reliability, 33% citing conflicting data, 30% inconsistent measurement across channels, 26% a lack of transparency and 25% simply too many metrics. Nearly every organisation studied — 99% — reports that defining metrics separately in each BI or analytics tool is a challenge, with 49% naming multiple data sources and 38% weak governance as the biggest obstacles. Separately, 67% of marketing teams say data quality issues affect campaign decisions and 42% of CRM records carry at least one error. The fix is governance, not another dashboard tool.
Is AI actually running mortgage reporting yet?
Evaluation is near-universal; production use is not. Lender survey data from 2026 shows 83% of firms evaluating AI tools across the business but only 17% with the technology deployed in live production workflows, with volume growth from existing staff ranking as the top priority for the second half of the year. On the reporting side the picture is further along, because summarisation is a low-risk application: reporting and performance summaries are the most commonly automated marketing task. The sensible sequencing is to let AI draft commentary on governed data while humans keep sign-off, which is exactly what 58% of agencies report doing.
Sources
HousingWire — IMB Profit and Costs, Q1 2026 (MBA Performance Report)
MBA — IMB Production Profits Remain Flat in Q1 2026
Confer Solutions — 10 Mortgage LOS KPIs for Mid-Sized Lenders
eMarketer — Confidence in Marketing Measurement Falters
Digital Applied — Marketing Analytics Statistics 2026
AgencyAnalytics — 2026 Marketing Agency Benchmarks Report
Supermetrics — Marketing Data Report 2026
The Mortgage Collaborative — H2 2026 Lender Priorities Survey
Technova Partners — Business Intelligence 2026: Tools and ROI
Gitnux — Business Intelligence Statistics 2026
leadPops — Mortgage Lead Conversion Rates by Source