



Table of contents
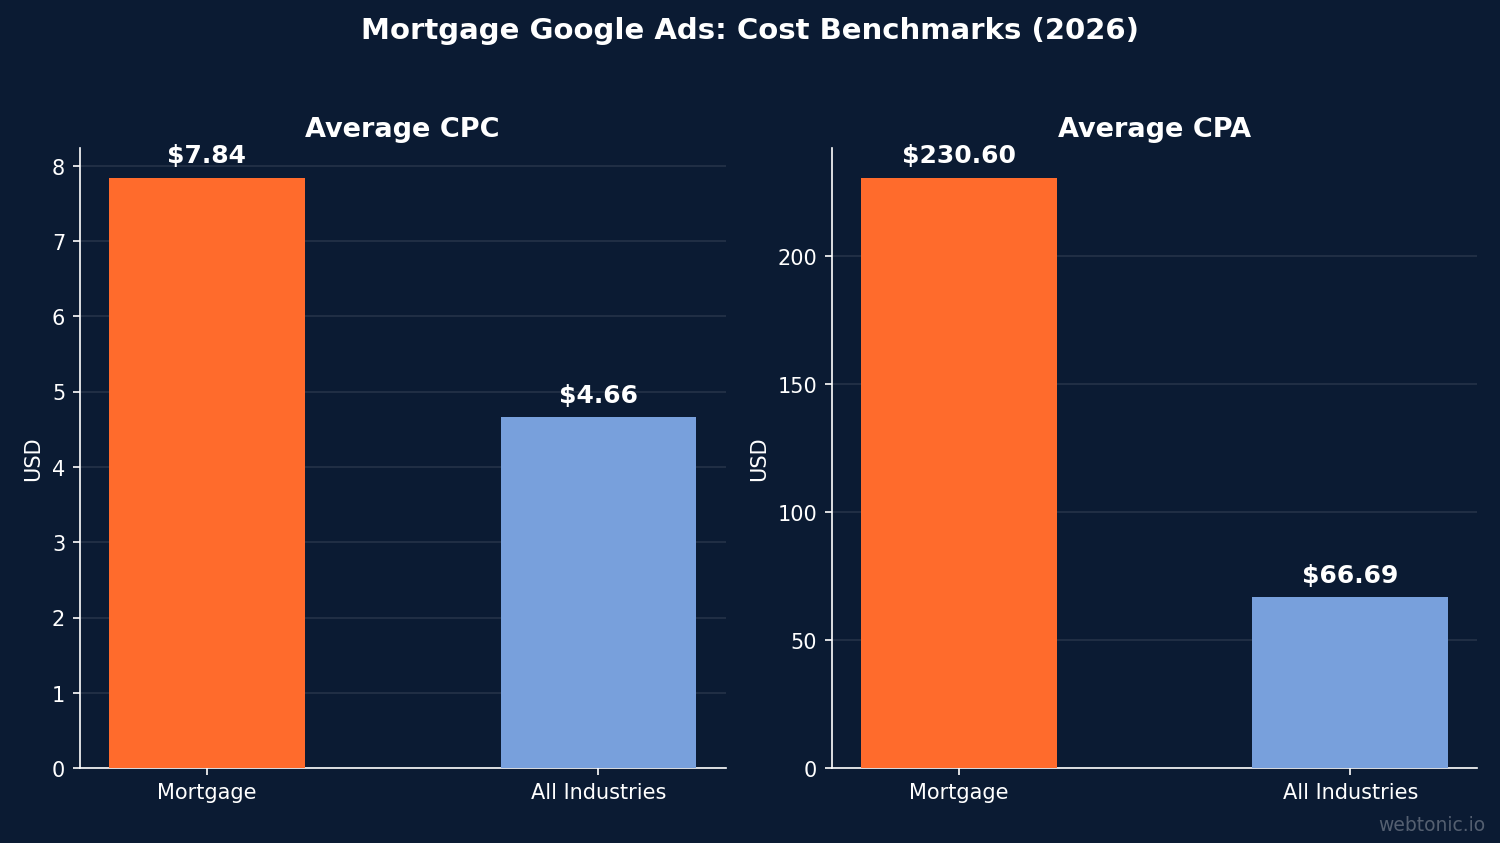
Google Ads is the primary high-intent lead generation channel for mortgage brokers and lenders in 2026. With an average CPC of $7.84 and a cost per lead ranging from $30 to $70, the platform delivers borrowers who are actively searching for rates, pre-approvals, and lender comparisons. This report compiles the latest performance benchmarks from industry studies published between late 2025 and mid-2026, covering search, display, and Performance Max campaigns specific to the mortgage vertical.
Key Takeaways
- $7.84 average CPC for mortgage search ads — with competitive keywords reaching $25–$50.
- 2.64% average CTR for mortgage search campaigns.
- 3.40% average landing page conversion rate; optimized pages reach 8–10%.
- $230.60 average CPA, but first-party campaigns can achieve $28–$150 CPL.
- Cost per funded loan (CPFL) ranges from $1,200–$2,000 for first-party campaigns to $5,000–$15,000+ for aggregator channels.
- 20–30% landing page conversion rate is achievable with dedicated mortgage funnels vs. 5–10% industry average.
| Metric | Mortgage / Lending | All Industries |
|---|---|---|
| Average CPC | $7.84 | $4.66 |
| CPC Range | $8–$50 | $1–$15 |
| CTR (Search) | 2.64% | 3.17% |
| Conversion Rate | 3.40% | 4.40% |
| CPA | $230.60 | $66.69 |
| CPL (first-party) | $30–$70 | $40–$80 |
| Landing Page CVR (optimized) | 20–30% | 5–10% |
Sources: Benchmarketing, Creekside Marketing, WordStream.
CPC by Keyword Category
Mortgage keywords span a wide CPC range depending on intent and competition. Transactional keywords like "mortgage lender near me" or "apply for mortgage online" command the highest bids, while informational keywords like "how much house can I afford" cost significantly less but drive top-of-funnel traffic.
| Keyword Category | Avg CPC | Search Intent | CVR Potential |
|---|---|---|---|
| Brand + Mortgage | $2–$6 | Navigational | 8–15% |
| Rate Comparison | $8–$18 | Commercial | 4–7% |
| Mortgage Broker + City | $12–$30 | Transactional | 5–10% |
| Pre-Approval / Application | $15–$35 | Transactional | 6–12% |
| Refinance Keywords | $20–$50 | Transactional | 3–6% |
| Calculator / Affordability | $3–$8 | Informational | 1–3% |
Creekside Marketing's 2026 data across their mortgage client portfolio shows that refinance keywords consistently command the highest CPCs ($20–$50) due to rate-sensitive demand surges. When rates drop, competition — and CPCs — spike within days.
Conversion Rate by Landing Page Type
The gap between average and optimized conversion rates in mortgage PPC is enormous. The industry-wide average sits at 3.40%, but dedicated mortgage landing pages with a single CTA (rate check, pre-qualification) achieve 20–30% according to LeadPops' 2026 benchmark data.
The difference comes down to page design: generic lender homepages present too many options (purchase, refinance, HELOC, about us, blog) and dilute intent. A purpose-built landing page that mirrors the ad's promise — "Check today's rates in 30 seconds" — eliminates friction and captures the borrower at peak intent.
Cost Per Funded Loan: The True ROI Metric
| Lead Source | Avg CPL | Lead-to-Close Rate | Avg CPFL |
|---|---|---|---|
| Google Ads (first-party) | $30–$70 | 3–5% | $1,200–$2,000 |
| LendingTree | $30–$100 | 0.5–2% | $5,000–$15,000+ |
| Bankrate | $100–$250+ | 1–3% | $6,700–$10,000+ |
| Meta/Facebook Ads | $15–$45 | 1–3% | $1,500–$3,000 |
| Organic/SEO | $0 (content cost) | 3–6% | $500–$1,500 |
The cost per funded loan is the metric that separates sophisticated mortgage advertisers from those chasing vanity CPL numbers. A $70 Google Ads lead that closes at 5% yields a $1,400 CPFL — dramatically better than a $30 aggregator lead that closes at 0.5% for a $6,000 CPFL. This is why first-party Google Ads strategies consistently outperform lead aggregators on total cost efficiency (LeadPops).

Campaign Type Performance
Search campaigns remain the core of mortgage PPC, delivering the highest-intent traffic. Performance Max is increasingly used by mortgage advertisers to extend reach across Search, Display, YouTube, and Discover — but it requires careful asset group setup to avoid wasting budget on low-intent display placements.
CuFinder's 2026 loan officer benchmarks show that search ads deliver a $98 CPA per qualified lead, while display and video campaigns serve primarily as awareness and retargeting layers that support — but don't replace — search volume.
Local search campaigns are particularly effective for mortgage brokers. Location-based modifiers ("mortgage broker [city]") convert at 40–60% higher rates than generic national terms, though they carry lower search volume. Brokers covering a defined service area should allocate 60–70% of budget to geo-modified keywords.
Quality Score and Ad Rank in Mortgage PPC
Quality Score is a critical lever for reducing CPC in the competitive mortgage auction. The three components — expected CTR, ad relevance, and landing page experience — each play an outsized role when CPCs run $8–$50. A Quality Score improvement from 5 to 7 can reduce CPC by 20–30% without changing bids.
Mortgage landing pages that achieve "Above Average" landing page experience scores share common traits: page load under 2.5 seconds, mobile-responsive design, clear rate display above the fold, and a single-step form with 3–5 fields (name, phone, loan amount, property type). Pages with calculator tools embedded see 15–20% higher Quality Scores than static form pages.
Ad relevance benefits from tight keyword-to-ad group alignment. The best-performing mortgage accounts use single-theme ad groups (STAGs) with 5–15 closely related keywords per group, enabling highly specific ad copy that mirrors search intent. This ad group architecture also improves reporting granularity. Accounts restructured from broad to STAG format typically see Quality Score improvements of 1.5–2.5 points within 30 days.
Seasonal CPC Trends and Rate Sensitivity
Mortgage Google Ads costs are highly sensitive to both seasonal patterns and interest rate movements. Spring (March–May) drives the highest search volume and competition, with CPCs running 15–25% above annual average. The fall market (September–November) sees a secondary peak, while winter months offer the lowest CPCs but also reduced volume.
Interest rate announcements from the Federal Reserve create immediate CPC spikes. When rates drop, search volume surges within 24–48 hours and CPCs can jump 20–40% as competitors increase bids to capture rate-motivated borrowers. Sophisticated advertisers pre-build rate-drop campaigns with responsive search ads featuring rate-specific headlines, enabling instant activation when rates move.
Refinance keywords show the most extreme rate sensitivity. During rate-drop periods, "refinance mortgage" CPCs can double overnight as homeowners rush to explore lower payments. Creekside Marketing recommends maintaining separate budgets for purchase and refinance campaigns to prevent rate-driven refinance surges from consuming purchase-intent budget.
Offline Conversion Tracking and Smart Bidding
The gap between a mortgage lead and a funded loan is 45–90 days, making offline conversion tracking essential for accurate Google Ads optimization. Lenders who upload CRM data (application starts, approvals, funded loans) back to Google Ads enable Smart Bidding algorithms to optimize for downstream value rather than just form submissions.
According to WordStream's 2026 benchmarks, advertisers using offline conversion imports with value-based bidding achieve 15–25% lower CPFL compared to those optimizing for front-end conversions only. The algorithm learns which click patterns lead to funded loans versus abandoned applications.
Google's Enhanced Conversions for Leads feature, which matches first-party CRM data using hashed email addresses, has improved match rates to 70–85% for mortgage advertisers. This higher match rate gives Smart Bidding significantly more conversion signals to work with, reducing the learning period from 4–6 weeks to 2–3 weeks for new campaigns.
Budget Benchmarks and Scaling Guidelines
According to Bill Rice Strategy's 2026 mortgage marketing budget analysis, the median mortgage broker allocates $3,000–$8,000 per month to Google Ads. At the $5,000/month level, a well-optimized campaign generates approximately 70–165 leads and 2–8 funded loans.
Scaling beyond $10,000/month requires expanding keyword coverage (adding informational and long-tail terms), launching Performance Max for incremental reach, and continuously optimizing landing pages. The marginal CPL tends to increase by 15–25% when doubling spend, as the most efficient keywords are already captured at lower budgets. Mortgage brokers approaching the $15,000–$20,000/month level should also explore YouTube pre-roll ads as a complementary awareness channel — short rate-update videos targeting homebuyer intent audiences deliver impressions at $15–$25 CPM while building brand recognition that improves search ad CTR by 8–12%.
Local Search and Geo-Targeting for Mortgage PPC
For mortgage brokers serving defined geographic markets, local search strategy is the highest-ROI segment of Google Ads. Geo-modified keywords ("mortgage broker Dallas," "home loan rates Austin TX") convert at 40–60% higher rates than generic national terms because they capture borrowers actively looking for local lenders.
Location targeting settings have a significant impact on budget efficiency. Setting campaigns to "Presence: People in your target location" (rather than the default "Presence or interest") prevents budget waste from users searching about your market from elsewhere. Mortgage advertisers who make this single change typically see 10–20% improvement in lead quality without reducing volume.
Google Business Profile integration amplifies local PPC performance. Mortgage brokers with optimized GBP listings (100+ reviews, complete service descriptions, regular posts) see location extensions drive 15–25% of total clicks at a lower CPC than headline-only ads. The trust signal of a physical office with reviews reduces the perceived risk of contacting an unfamiliar lender.
Best Practices for Mortgage Google Ads
- Build dedicated landing pages per keyword theme — rate-check pages for rate queries, pre-qualification pages for application-intent queries.
- Bid aggressively on brand + geo terms — these deliver the lowest CPCs ($2–$6) and highest CVR (8–15%).
- Track to funded loan, not just CPL — integrate CRM data with Google Ads offline conversions for Smart Bidding optimization.
- Use negative keywords extensively — exclude "jobs," "calculator," "license," and competitor brand terms that waste budget.
- Refresh ad copy when rates change — rate-specific headlines ("6.25% fixed — apply today") outperform generic copy by 25–40% on CTR.
- Daypart bids for business hours — mortgage search intent peaks Tuesday–Thursday, 8 AM–6 PM; reduce bids 30–40% overnight.
- Test Performance Max cautiously — start with 20% of budget and monitor placement reports for low-quality display spend.
FAQ
How much does Google Ads cost for mortgage brokers?
Mortgage brokers pay an average CPC of $7.84, with competitive keywords reaching $25–$50. Monthly budgets of $3,000–$8,000 are typical. The cost per qualified lead ranges from $30–$70 for well-optimized first-party campaigns, compared to $100–$250 for aggregator platforms.
What is a good conversion rate for mortgage Google Ads?
The industry average is 3.40%, but dedicated mortgage landing pages routinely achieve 8–10%, and top performers reach 20–30%. If your conversion rate is below 3%, audit your landing page experience, page speed, and form length before increasing bids.
Are Google Ads worth it for mortgage companies?
Yes — when measured by cost per funded loan rather than cost per click. First-party Google Ads campaigns deliver a $1,200–$2,000 CPFL, which is 3–7× more efficient than aggregator lead sources. The key is optimizing the full funnel from click to close, not just the ad spend.
How do mortgage Google Ads compare to buying leads from aggregators?
Google Ads leads are exclusive to your business and arrive with higher intent. While the per-lead cost ($30–$70) may seem higher than some shared aggregator leads, the close rate is 3–5% vs. 0.5–2% for shared leads, making the cost per funded loan dramatically lower.
What keywords should mortgage brokers target on Google Ads?
Start with high-intent local terms ("mortgage broker [city]," "home loan rates [state]") for the best CVR. Layer in rate-comparison and pre-approval keywords for volume. Use informational keywords ("how much house can I afford") only with dedicated content landing pages, not lead forms.
Sources
https://www.benchmarketing.org/benchmarks/industries/mortgage
https://creeksidemarketingpros.com/blog/how-much-do-google-ads-cost-for-mortgage-companies/
https://leadpops.com/blog/google-ads-mortgage-brokers
https://leadpops.com/blog/mortgage-leads-cost-2026
https://leadpops.com/blog/cost-per-funded-loan
https://cufinder.io/blog/benchmarks/loan-officers/
https://www.wordstream.com/blog/2026-google-ads-benchmarks
https://billricestrategy.com/blog/mortgage-marketing-budget-allocation-2026


