



Table of contents
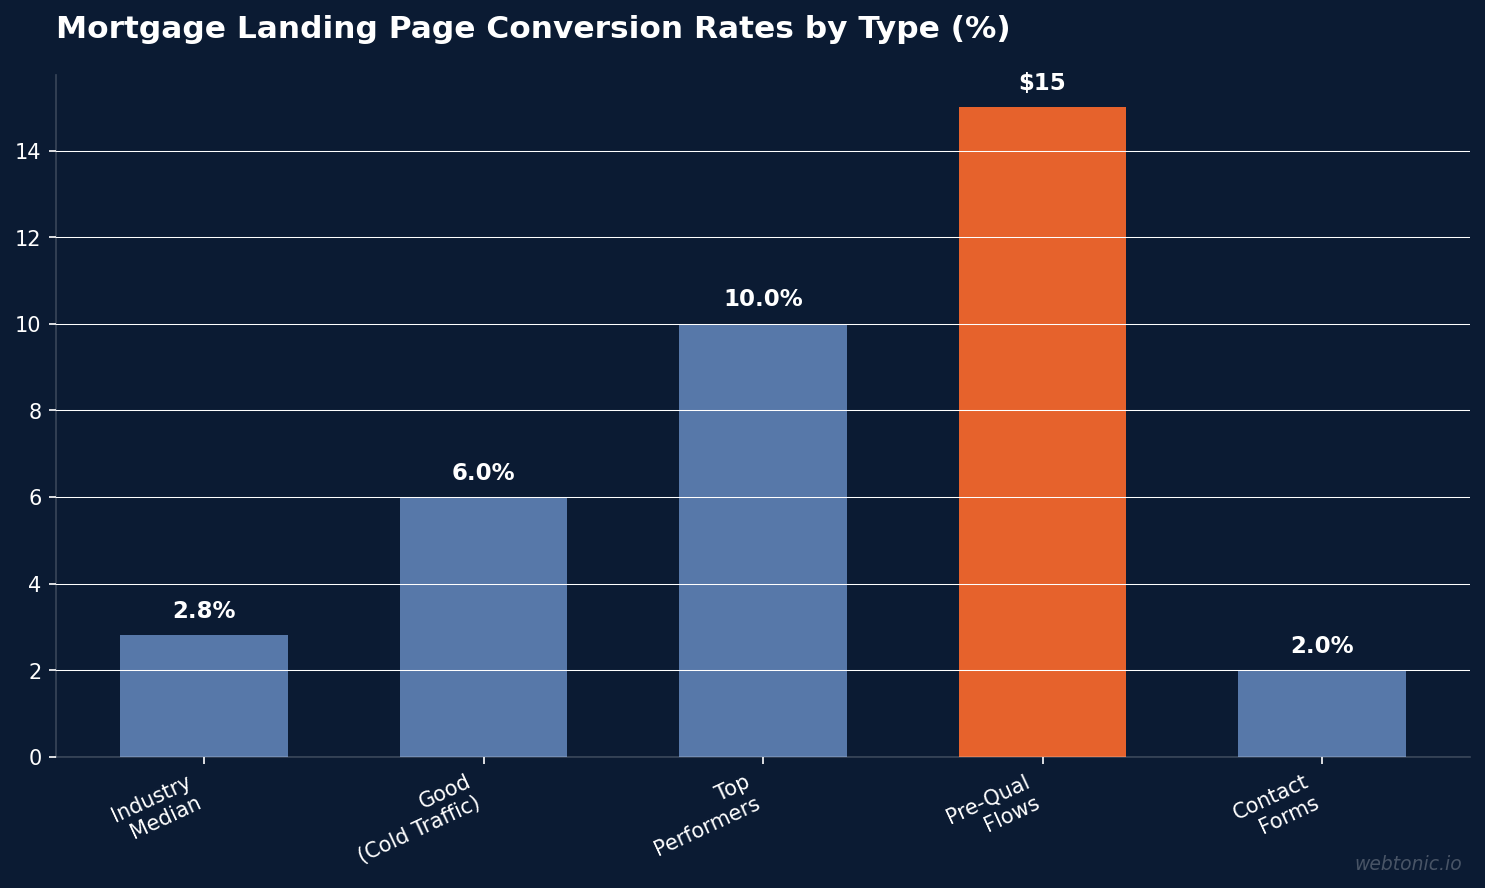
The median mortgage landing page converts at just 2.80% — but top performers hit 10% or higher by combining interactive calculators, minimal form fields, and personal loan officer branding. These benchmarks and test results reveal exactly what separates high-converting mortgage pages from the rest.
Key Takeaways
- The median mortgage landing page conversion rate is 2.80% across the industry (Benchmarketing, 2026).
- Top mortgage landing pages convert at 4–8% on cold paid traffic and above 10% with a qualifier, personal broker photo, and single CTA (Perspective).
- Pre-qualification flows convert 3–5× better than contact forms — 10–20% vs. 1–3% (QuantaTasks).
- Each additional form field beyond 3 drops completion by 20–30% (BNTouch).
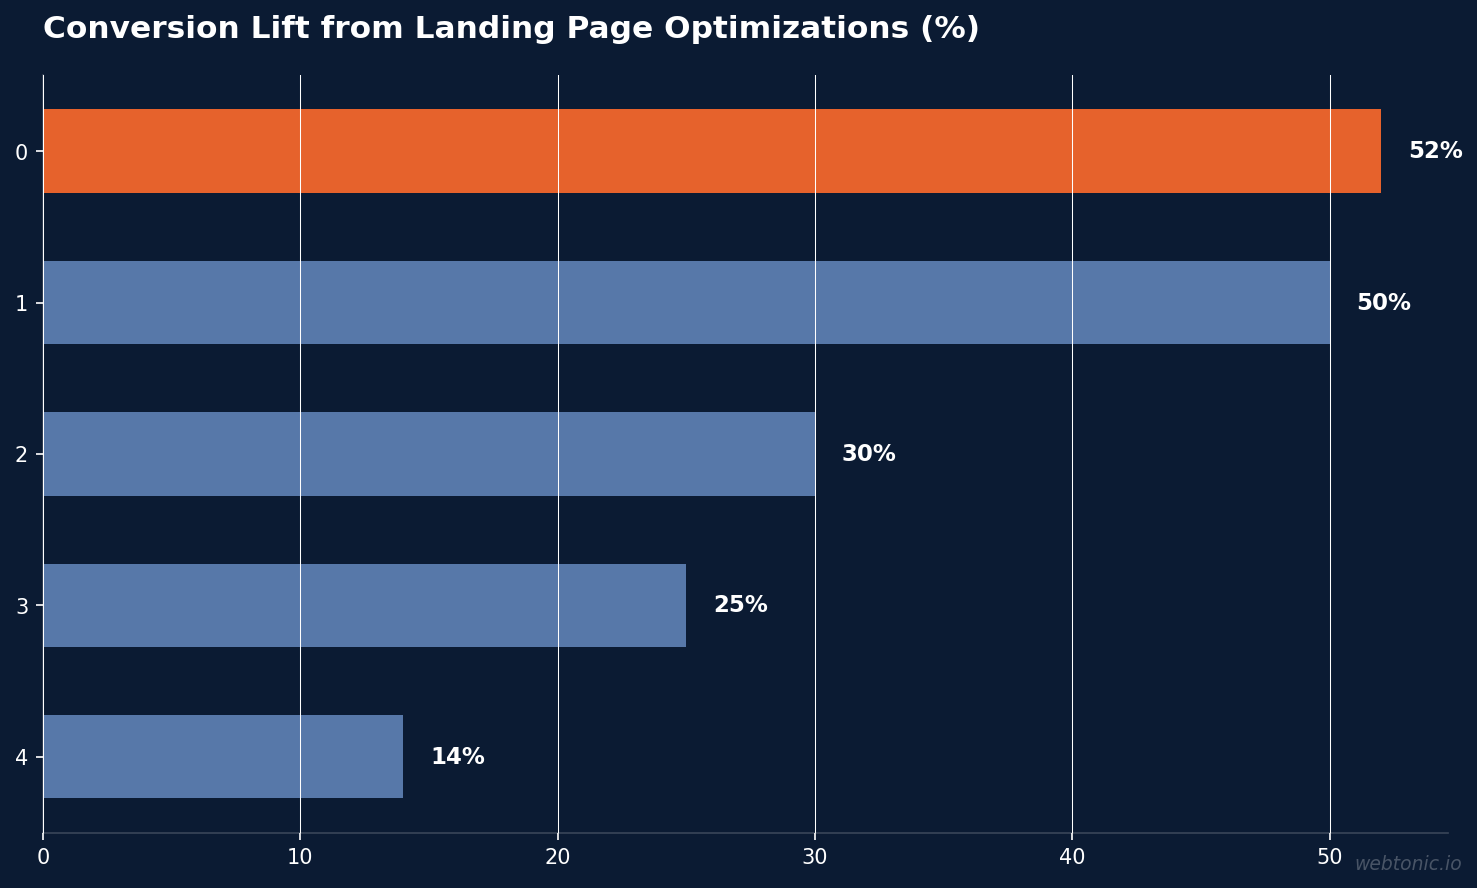
- Interactive calculators raise landing page conversion 30–50% versus pages without one (BNTouch).
- A/B testing delivered a 52% conversion rate increase in a mortgage funnel — 10.6% vs. 7% — by optimizing form design and branding (AgedLeadStore).
Mortgage Landing Page Conversion Rate Benchmarks
Conversion rates vary dramatically depending on traffic source, page design, and funnel type. The table below maps the performance tiers that mortgage lenders should benchmark against when evaluating their growth marketing landing pages.
| Performance Tier | Conversion Rate | Characteristics |
|---|---|---|
| Industry median | 2.80% | Generic form, no personalization, weak message match |
| Good (cold paid traffic) | 4–8% | Message-matched headline, LO photo, 3-field form |
| Top performers | 10%+ | Qualifier + personal broker + single CTA + calculator |
| Pre-qualification flows | 10–20% | Interactive multi-step, embedded rate calculator |
| Contact forms (baseline) | 1–3% | Standard name/email/phone form only |
Sources: Benchmarketing, Perspective, QuantaTasks
Form Optimization Statistics
Form length is the single most measurable conversion lever on a mortgage landing page. BNTouch reports the optimal configuration: 3 fields — name, phone, and email. Each additional field beyond three drops completion rates by 20–30%. Detailed qualification happens on the follow-up call, not on the landing page.
An A/B test documented by AgedLeadStore reinforces this finding. The test compared a 7-field form with minimal branding (Variant A) against an optimized version with clear CTAs and branded design elements (Variant B). Results:
- 52% increase in conversion rate — 10.6% vs. 7% for the original.
- 14% uplift in qualified applications post-submission.
- The optimized form reduced cognitive load while maintaining enough friction to filter casual browsers from genuine borrowers.
Pre-Qualification Flows vs. Static Forms
Pre-qualification flows convert 3–5× better than standard contact forms (QuantaTasks). The difference: a pre-qual flow captures intent at the moment the borrower needs information. They enter their financial data, the calculator returns a result, and the form submission follows naturally as part of the flow.
| Funnel Type | Conversion Rate | Lead Quality | Implementation Complexity |
|---|---|---|---|
| Static contact form | 1–3% | Low — unqualified inquiries | Low |
| Lead form ad (Meta/Google) | Higher volume | Lower qualification | Low |
| Pre-qualification flow | 10–20% | High — self-qualified | Medium |
| Calculator + embedded form | +30–50% vs. no calculator | High — intent-driven | Medium |
Sources: QuantaTasks, BNTouch, LeadPops
Interactive calculators are the highest-impact single element: they raise conversion by 30–50% versus pages without one (BNTouch). The borrower is already trying to calculate their numbers somewhere — embedding that tool on the landing page captures the intent at the exact moment they need it.
Page Speed and User Experience Impact
30% of mortgage website visitors abandon due to slow load times (WorldMetrics). The average session duration on mortgage lender websites is 2 minutes and 15 seconds — any latency in that window directly reduces conversion probability.
MyABT emphasizes that the P95 load time matters more than the average. The P50 average is meaningless when 1 in 20 borrowers hits a 10-second load. The P95 number matches what most abandoning borrowers actually experience, making it the metric that correlates with real revenue loss.
A $10,000 Google Ads campaign by BankingBridge revealed that the highest-traffic VA IRRRL landing page variant (364 sessions, 58% of all clicks) had the worst bounce rate at 34.9%. Meanwhile, workflow start rates ranged from 7.7% to 37.8% across four landing page designs — a 4.9× difference from the same ad traffic, proving that page design, not ad targeting, determined lead volume.
Landing Page Elements That Drive Conversion
Perspective analyzed the common elements of mortgage landing pages converting at 4–8% on cold paid traffic and identified three non-negotiables: a message-matched headline (reflecting the exact ad copy), a personal loan officer photo with credentials, and a single-purpose CTA. Pages above 10% add a qualifier step and interactive rate tool.
- Message-matched headline: Repeat the ad's promise on the page. Mismatch drops conversion by 50%+ in mortgage contexts where trust is paramount.
- Loan officer photo + credentials: Borrowers want to know who they are working with before submitting personal financial data.
- 3-field form maximum: Name, phone, email. Each additional field costs 20–30% of completions (BNTouch).
- Interactive calculator: 30–50% conversion lift. Embeds the value exchange into the page rather than asking for data with nothing in return.
- CAPI / server-side event tracking: Strongly recommended for feeding conversion signals back to Meta and Google ad algorithms for optimization (BNTouch).
A/B Testing Results in Mortgage Funnels
Systematic testing produces outsized results in mortgage landing pages because the baseline is often poorly optimized. The AgedLeadStore case study showed that testing form layout, branding, and CTA placement simultaneously delivered a 52% conversion improvement and a 14% improvement in qualified application rates.
EmpowerLO tested three landing page variations for mortgage leads and found a clear winner, reinforcing that even small design changes compound into significant CPL differences when applied at the scale of a $5,000+ monthly ad budget. The variation that won combined a clean visual hierarchy, above-the-fold CTA, and social proof indicators.
For lenders running Meta Ads to mortgage landing pages, the creative-to-page alignment is equally critical. A message-matched landing page that echoes the ad's headline and visual treatment converts significantly better than a generic corporate page receiving the same traffic. The CPL difference between a matched and unmatched experience can be 40–60%, making landing page testing inseparable from ad creative testing.
| Test Element | Typical Lift | Testing Priority |
|---|---|---|
| Form field reduction (7→3) | +40–60% | Highest — test first |
| Calculator integration | +30–50% | High — major UX change |
| Pre-qual flow vs. form | +200–400% | High — architectural change |
| Headline message match | +20–40% | Medium — quick win |
| LO photo + credentials | +10–25% | Medium — trust signal |
| Page speed optimization | Reduced abandonment | Foundational — fix first |
Sources: AgedLeadStore, BNTouch, QuantaTasks
Mobile Optimization for Mortgage Landing Pages
Mortgage research happens on mobile devices — but conversion happens on desktop. This behavioral split means mortgage landing pages must optimize for two distinct user journeys. The average time on a mortgage lender's website is 2 minutes and 15 seconds (WorldMetrics), and mobile sessions tend to be even shorter. Every element that adds friction — unresponsive forms, slow-loading images, horizontal scrolling — costs completions disproportionately on mobile.
The BankingBridge VA IRRRL case study revealed a critical mobile insight: the page that received 58% of all traffic had the worst bounce rate (34.9%), while the best-performing design achieved a 37.8% workflow start rate. The difference between the two designs came down to mobile-first form placement, thumb-friendly CTA sizing, and above-the-fold value proposition clarity. For lenders spending $5,000+ monthly on Google Ads, this 4.9× performance difference between page designs translates directly to cost per funded loan.
Trust Signals and Social Proof Impact
Mortgage borrowers are sharing sensitive financial information with a stranger on the internet. Trust elements on landing pages are not optional — they are conversion infrastructure. 60% of consumers base their mortgage lender choice on perceived trust (WorldMetrics), making trust signals the bridge between ad click and form submission.
The most effective trust elements for mortgage landing pages, ranked by conversion impact:
- Personal loan officer photo with credentials — converts 10–25% better than faceless corporate pages (Perspective).
- NMLS license number displayed prominently — regulatory requirement that doubles as a trust signal when positioned near the CTA.
- Review count and star rating — specific numbers ("4.8 stars from 312 reviews") outperform generic "highly rated" claims.
- Secure form indicators — SSL badge, "256-bit encryption" language, and privacy policy links reduce abandonment for financial data entry.
- Response time promise — "We'll call within 5 minutes" sets expectations and reduces anxiety about submitting personal information.
Landing Page CPL Benchmarks by Traffic Source
The same landing page converts at wildly different rates depending on the traffic source. Understanding this variation prevents false conclusions about page performance when the real variable is audience intent.
| Traffic Source | Typical LP Conversion Rate | Avg. CPL | Lead Quality |
|---|---|---|---|
| Google Search (branded) | 8–15% | $15–$40 | High — brand-aware |
| Google Search (non-branded) | 3–6% | $45–$120 | Medium-high — active shoppers |
| Meta Ads (cold traffic) | 2–5% | $15–$60 | Variable — depends on creative |
| Meta Ads (retargeting) | 6–12% | $8–$25 | High — prior engagement |
| Organic / SEO | 5–12% | ~$0 | High — self-directed research |
Sources: LeadPops, Benchmarketing, LeadPops Guide
The key insight: retargeting traffic converts 3–6× higher than cold traffic on the same landing page. This means a page that appears to "underperform" at 3% on cold Meta traffic may actually be performing well — while a page showing 10% on branded search may be underperforming its potential. Segment analytics by traffic source before drawing conclusions about page effectiveness.
Frequently Asked Questions
What is the average mortgage landing page conversion rate?
The industry median mortgage landing page conversion rate is 2.80% according to Benchmarketing's 2026 data. However, well-optimized pages with message-matched headlines, personal loan officer branding, and 3-field forms convert at 4–8% on cold paid traffic. Top performers using pre-qualification flows reach 10–20%.
How many form fields should a mortgage landing page have?
The optimal number is 3 fields: name, phone, and email (BNTouch). Each additional field beyond three reduces form completion rates by 20–30%. Detailed qualification should happen on the follow-up call, not on the landing page. An A/B test showed that simplifying from 7 fields to an optimized layout increased conversion by 52%.
Do mortgage calculators improve landing page conversion?
Yes. Interactive mortgage calculators raise landing page conversion by 30–50% versus pages without one (BNTouch). The calculator creates a value exchange — the borrower gets useful information in return for their contact data — and captures intent at the exact moment they are researching rates and payments.
What is a pre-qualification flow and how does it perform?
A pre-qualification flow is an interactive, multi-step form that guides borrowers through basic financial questions and returns an estimated pre-approval result before requesting contact information. These flows convert at 10–20% compared to 1–3% for standard contact forms — a 3–5× improvement (QuantaTasks). They can be added without a developer using embedded widget tools.
How much does page speed affect mortgage landing page performance?
30% of mortgage website visitors abandon due to slow load times (WorldMetrics). The critical metric is P95 load time — the speed experienced by the slowest 5% of visitors — not the average. When 1 in 20 borrowers hits a 10-second load, the revenue impact from that tail is disproportionately large relative to the overall average.
Sources
https://www.benchmarketing.org/benchmarks/industries/mortgage
https://www.perspective.co/article/mortgage-landing-page
https://bntouch.com/mortgage-blog/mortgage-landing-pages-that-convert/
https://quantatasks.com/blog/how-to-add-pre-approval-flow-mortgage-website
https://agedleadstore.com/ab-testing-mortgage-lead-funnels/
https://worldmetrics.org/marketing-in-the-mortgage-industry-statistics/
https://www.bankingbridge.com/post/va-irrrl-lead-generation-what-10-000-in-google-ads-taught-us-about-landing-page-design
https://www.myabt.com/blog/user-experience-in-online-mortgage-banking-the-role-of-infrastructure-apis-and-latency
https://empowerlo.com/blog/mortgage-landing-pages
https://leadpops.com/guide/mortgage-marketing-2026


