



Table of contents
The mortgage industry operates in one of the most competitive digital marketing environments, with cost per lead ranging from $4 on Facebook to $250+ through aggregator platforms depending on the channel and lead exclusivity. As interest rates fluctuate and consumer behavior shifts increasingly online, mortgage professionals need precise benchmarks to evaluate their marketing investments. This article compiles 40+ verified statistics covering lead generation costs, email marketing benchmarks, Google Ads performance, SEO metrics, social media advertising, and CRM adoption across the mortgage and lending vertical for 2026.
Key Takeaways
- Google Ads CPL for mortgage sits at $30–$70, while Facebook delivers leads at $4–$25 and aggregators charge $30–$250+ for shared or exclusive leads.
- 78% of mortgage loan officers report gaining new business directly from social media, making it a proven acquisition channel for the lending industry.
- Google Ads conversion rate for mortgage averages 3.40% with a cost per click of $7.84 and CPA of $230.60.
- Email open rates for real estate and mortgage average 24.8–25%, with welcome emails reaching 48.5% open rates.
- Organic search generates a cost per funded loan 45–65% lower than paid aggregator channels once SEO campaigns reach 9–12 months of maturity.
- 70% of lenders have implemented CRM systems integrated with mortgage processes, while CRM adoption cuts loan processing time by 25–40%.
- Landing page conversion rates average 4.1–5.2% for mortgage, while optimized leadpops-style pages reach 20–30%.
Mortgage Digital Marketing Benchmarks at a Glance
| Metric | Benchmark | Source |
|---|---|---|
| Google Ads CPC | $7.84 | Benchmarketing |
| Google Ads CTR | 2.64% | Benchmarketing |
| Google Ads conversion rate | 3.40% | Benchmarketing |
| Google Ads CPA | $230.60 | Benchmarketing |
| Meta Ads CPC | $3.24 | Benchmarketing |
| Meta Ads ROAS | 2.4× | Benchmarketing |
| Facebook CPL | $4–$25 | LeadPops |
| Email open rate | 24.8–25% | CuFinder / Blastrow |
| Landing page conversion | 4.1–5.2% | CuFinder |
Lead Generation Cost Benchmarks by Channel
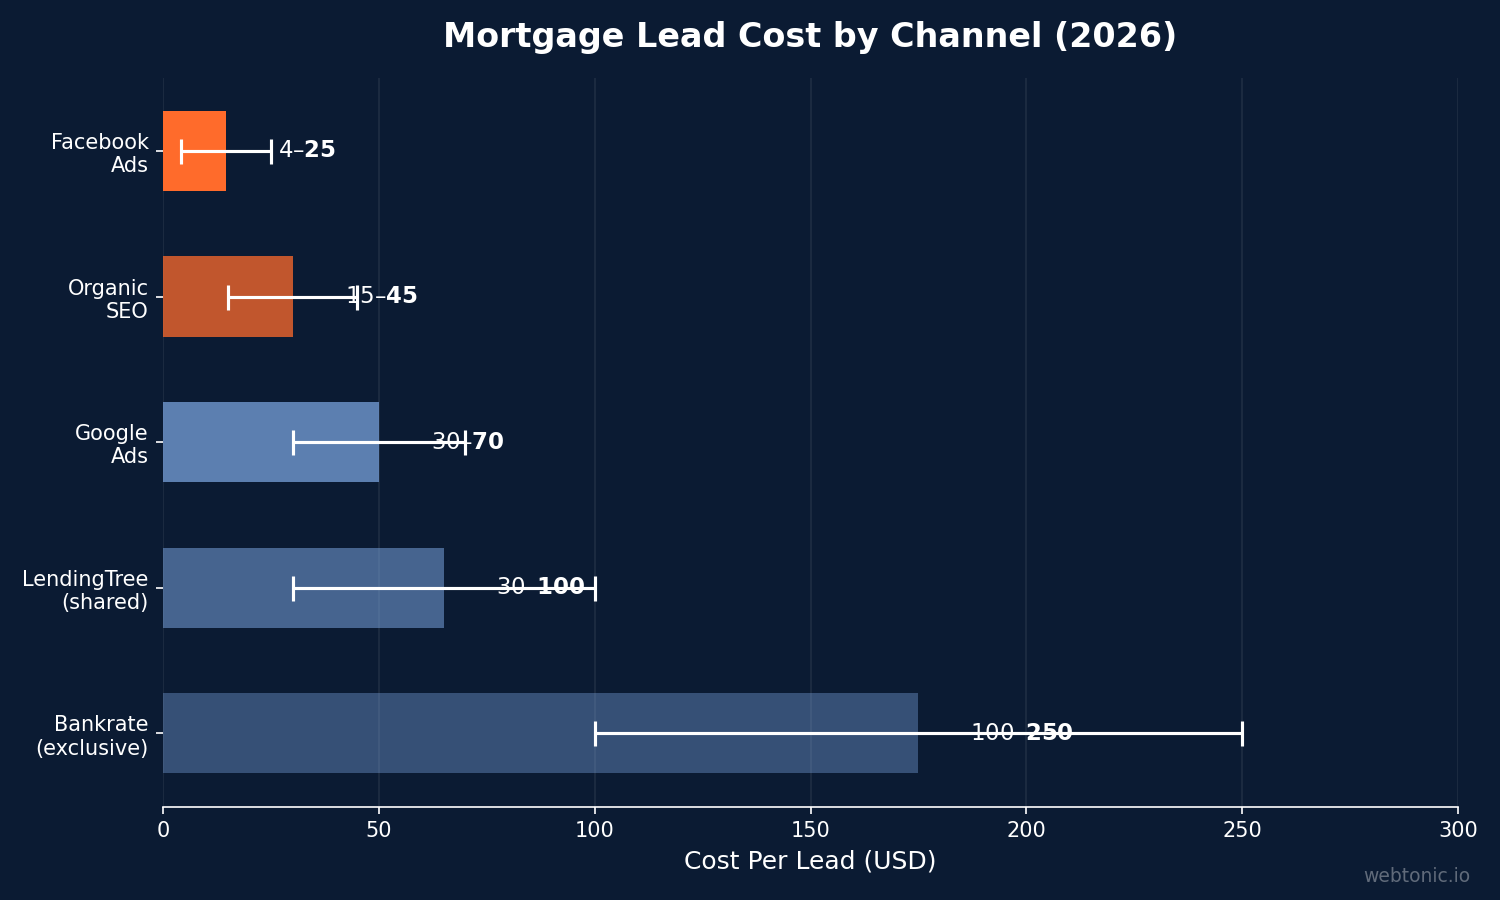
Lead cost varies dramatically across channels in the mortgage industry, and understanding the full-funnel economics — from lead to funded loan — is critical for marketing budget allocation. The following table breaks down realistic cost ranges for the major acquisition channels.
| Channel | CPL Range | Lead Quality |
|---|---|---|
| Facebook / Meta Ads | $4–$25 | Medium (targeting-dependent) |
| Google Ads | $30–$70 | High (search intent) |
| LendingTree (shared) | $30–$100 | Medium (shared leads) |
| Bankrate (exclusive) | $100–$250+ | High (exclusive) |
| Organic / SEO | $15–$45 | High (intent-driven) |
| LinkedIn Ads | $40–$80 | High (B2B / referral partner) |
| TikTok Ads | $15–$45 | Low–Medium (awareness) |
- Facebook delivers the lowest CPL at $4–$25 with strong targeting, though quality varies significantly based on audience selection and creative. (LeadPops)
- Google Ads CPL sits at $30–$70 for mortgage, with conversion rates of 3.40% and an average CPC of $7.84. (Benchmarketing)
- Exclusive leads from aggregators like Bankrate cost $100–$250+, while shared leads from LendingTree run $30–$100 per lead. (LeadPops)
- A $5K/month ad spend typically generates 85–125 leads at a blended CPL of $40–$59 across channels. (LeadPops)
- Cost per funded loan (CPFL) ranges from $1,200–$2,000 when factoring in the full funnel from lead to closing, a critical metric that raw CPL alone obscures.
Google Ads Performance Metrics
Google Ads remains the highest-intent paid channel for mortgage professionals, with borrowers actively searching for rates, lenders, and loan products. The platform demands careful optimization given the high CPCs in the financial services vertical.
- Average CPC for mortgage Google Ads is $7.84, with competitive markets pushing above $12 for high-value keywords like "mortgage rates" and "refinance." (Benchmarketing)
- Click-through rate averages 2.64% across mortgage search campaigns, reflecting strong commercial intent in search queries. (Benchmarketing)
- Conversion rate sits at 3.40–5.2%, depending on landing page quality and whether leads are directed to dedicated mortgage-specific landing pages vs. generic homepages. (CuFinder)
- CPA for mortgage averages $230.60, making budget allocation and keyword strategy critical for profitability. (Benchmarketing)
- Mortgage companies typically spend $2,000–$10,000/month on Google Ads, with conversion-optimized campaigns achieving $8–$50 per click depending on keyword competitiveness. (Creekside Marketing)
Email Marketing Benchmarks
Email remains one of the most cost-effective channels for mortgage professionals, particularly for nurturing leads through the lengthy decision cycle and maintaining referral partner relationships.
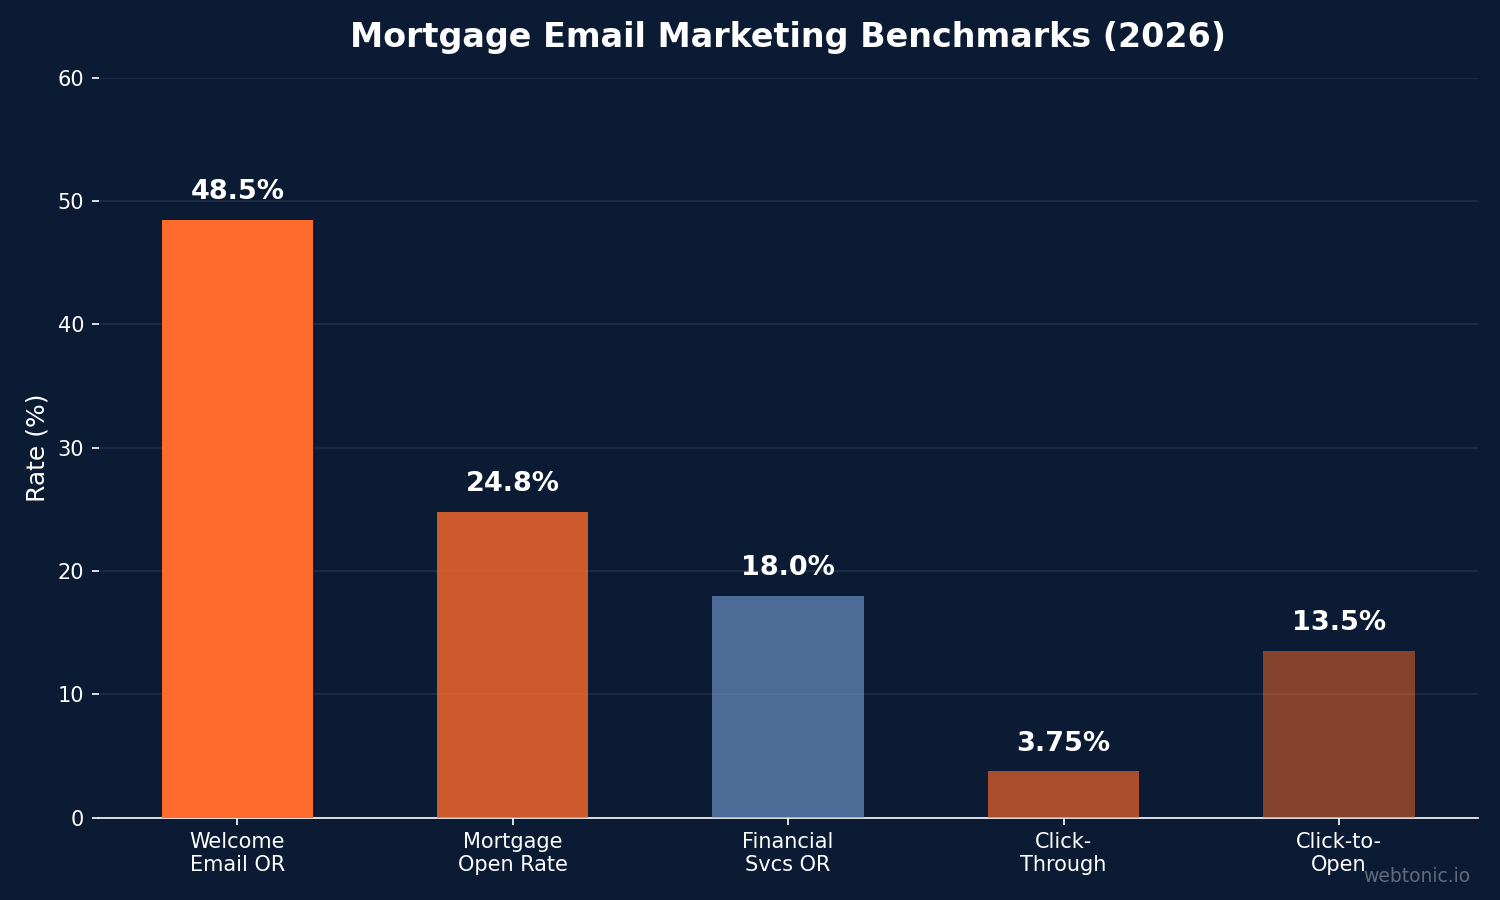
- Email open rates for mortgage and real estate average 24.8–25%, sitting above the general financial services benchmark of 18%. (CuFinder)
- Welcome emails achieve a 48.5% open rate, making the first-touch email sequence a critical conversion opportunity for new leads. (CuFinder)
- Click-through rates target 2.5–5%, with click-to-open rates of 10–17% indicating strong content relevance. (Blastrow)
- Unsubscribe rates should stay below 0.3%, with delivery rates maintaining 98%+ to protect sender reputation. (Blastrow)
- Drip campaigns targeting borrowers at different pipeline stages — pre-qualification, application, processing, post-close — drive the highest engagement by matching content to borrower intent and anxiety points.
SEO and Organic Search Performance
Organic search is the most cost-efficient long-term acquisition channel for mortgage lenders and brokers, though it requires sustained investment and content authority building — particularly given the YMYL classification of financial content.
- Top-3 organic rankings for purchase-intent mortgage keywords generate CTRs 4–6× higher than positions 5–10 in the lending vertical. (Authority Specialist)
- Organic search generates a cost per funded loan 45–65% lower than paid aggregator channels once SEO campaigns reach 9–12 months of maturity. (Authority Specialist)
- 65–80% of mortgage website traffic comes from mobile devices, making mobile-first design and page speed optimization essential for SEO performance. (CuFinder)
- Content authored by verified financial professionals sees 15–30% better ranking stability through Google core updates, as mortgage content falls under YMYL classification. (Authority Specialist)
- Mortgage brokers investing in local SEO and Google Business Profile optimization see branded search volume increase by 20–35% within the first 6 months.
Social Media Advertising Statistics
Social media has evolved from a brand awareness tool into a measurable lead generation channel for mortgage professionals, with Meta platforms leading in volume and LinkedIn gaining traction for B2B referral partnerships.
- 78% of mortgage loan officers report gaining new business directly from social media, confirming the channel's role as a proven acquisition tool. (Sendible)
- Meta Ads CPC for mortgage averages $3.24 with a 2.4× ROAS, making it the highest-volume paid social channel for lenders. (Benchmarketing)
- Meta social CPL ranges $15–$45 with strong targeting, rising to $50+ when creative or targeting is weak. (BNTouch)
- One mortgage broker generated $50 million in production through social media, demonstrating the channel's potential at scale when combined with consistent content and lead nurturing. (Sendible)
- The "lo-fi" authentic content aesthetic outperforms polished production in the mortgage space, with audiences responding better to loan officers who share genuine market insights and personal expertise.
CRM and Marketing Technology Adoption
Technology adoption rates in the mortgage industry reveal a clear divide between digitally mature organizations and those still relying on manual processes for lead management and client communication.
- 70% of lenders have implemented CRM systems integrated with their mortgage processes, up from approximately 55% two years ago. (Zipdo)
- CRM adoption cuts loan processing time by 25–40%, with 58% of institutions reporting this efficiency gain. (SureSend)
- 74% of institutions without CRM automation experience processing delays longer than 15 days, directly impacting borrower satisfaction and pull-through rates. (SureSend)
- 60.5% of mortgage professionals prioritize marketing and lead generation technology, followed by AI/automation (58%) and CRM/LOS systems (48%) in their technology investment plans. (Zipdo)
Landing Page and Conversion Optimization
The gap between average and optimized landing page performance represents one of the largest revenue opportunities in mortgage digital marketing. Even small conversion improvements compound significantly given mortgage industry lead costs.
- Industry average landing page conversion rate sits at 4.1–5.2% for mortgage and loan officer pages. (CuFinder)
- Optimized mortgage landing pages achieve 20–30% conversion rates, a 4–6× improvement over industry average, through dedicated rate comparison tools, instant pre-qualification forms, and trust signals. (LeadPops)
- Exclusive leads with optimized landing pages deliver 30–40% lower cost per funded loan compared to aggregator or DIY approaches at median conversion. (Lurvo Digital)
- A sample of 20–30 leads over 2–3 weeks is sufficient to statistically measure real conversion rates for a mortgage landing page before scaling budget. (Lurvo Digital)
Best Practices for Mortgage Digital Marketing in 2026
- Diversify lead sources across 3–4 channels — relying solely on aggregators or a single paid channel creates vulnerability to cost spikes and policy changes.
- Invest in dedicated landing pages with pre-qualification tools, rate comparison widgets, and clear CTAs — the gap between 5% and 20% conversion represents a 4× efficiency multiplier.
- Build email nurture sequences for every pipeline stage — pre-qualification, application, processing, and post-close. Welcome emails alone achieve 48.5% open rates.
- Implement CRM automation for lead routing, follow-up sequencing, and processing efficiency — institutions with CRM see 25–40% faster loan processing times.
- Prioritize organic search and content marketing for long-term cost efficiency — SEO generates 45–65% lower cost per funded loan than aggregators at maturity.
- Leverage authentic social content over polished ads — loan officers sharing genuine market insights and expertise-driven content outperform traditional advertising in the mortgage vertical.
Marketing Budget Allocation Framework
How mortgage professionals distribute their digital marketing budget determines overall efficiency. The optimal allocation shifts based on market conditions, business maturity, and whether the focus is purchase or refinance volume.
- The 40/30/20/10 framework addresses most mortgage marketing needs: 40% to paid search (Google Ads), 30% to paid social (Meta + LinkedIn), 20% to content and SEO, and 10% to email marketing and nurture infrastructure. (Bill Rice Strategy)
- Marketing spend should adjust dynamically based on rate environment — when rates drop below key thresholds, refinance lead volume surges and CPLs temporarily decrease, creating opportunities to scale budget efficiently.
- Performance tracking should measure cost per funded loan, not just cost per lead, as the full-funnel conversion from lead to closing varies 3–5× across channels.
FAQ
How much do mortgage leads cost in 2026?
Mortgage lead costs vary dramatically by channel: Facebook delivers leads at $4–$25, Google Ads at $30–$70, shared aggregator leads at $30–$100, and exclusive aggregator leads at $100–$250+. The true cost metric is cost per funded loan (CPFL), which typically ranges $1,200–$2,000 across all channels.
What is a good conversion rate for mortgage landing pages?
The industry average sits at 4.1–5.2%. However, optimized landing pages with dedicated rate tools, instant pre-qualification forms, and strong trust signals achieve 20–30% conversion rates — a 4–6× improvement that dramatically reduces cost per lead.
Is social media effective for mortgage lead generation?
Yes — 78% of loan officers report gaining new business from social media. Meta platforms deliver CPLs of $15–$45 with strong targeting, and the channel's 2.4× average ROAS confirms it as a cost-effective acquisition tool when paired with optimized landing pages and lead nurturing.
What are good email marketing benchmarks for mortgage?
Target 24.8–25% open rates (welcome emails should hit 48.5%), 2.5–5% click-through rates, and keep unsubscribe rates below 0.3%. Delivery rates should maintain 98%+ to protect sender reputation and ensure inbox placement.
How long does mortgage SEO take to show results?
Mortgage SEO typically requires 6–9 months to show measurable traffic gains and 9–12 months to achieve cost-per-funded-loan parity with other channels. Once mature, organic search generates acquisition costs 45–65% lower than paid aggregator channels.
Sources
leadpops.com/blog/mortgage-leads-cost-2026
benchmarketing.org/benchmarks/industries/mortgage
cufinder.io/blog/benchmarks/loan-officers/
authorityspecialist.com/industry/real-estate/mortgage-industry/seo-statistics
blastrow.com/blog/2026-real-estate-email-marketing-benchmarks
suresend.ai/l/mortgage-crm-statistics
zipdo.co/digital-transformation-in-the-mortgage-industry-statistics/
bntouch.com/mortgage-blog/social-media-ads-mortgage-loan-officers/
creeksidemarketingpros.com/blog/how-much-do-google-ads-cost-for-mortgage-companies/
lurvodigital.com/resources/mortgage-lead-cost-comparison-2026/


