



Table of contents
Mortgage lenders that track marketing performance end-to-end close more loans at lower cost — yet 82.7% rely on CRM systems while only a fraction connect that data to ad-level attribution. These statistics reveal where the mortgage industry stands on analytics adoption, what the best-performing lenders measure differently, and where the biggest gaps remain.
Key Takeaways
- 87.3% of mortgage professionals have adopted e-signatures, making it the highest-adopted technology in the industry (AD Mortgage 2026 Survey).
- 82.7% use CRM or lead management systems, but most fail to connect CRM data back to marketing attribution (AD Mortgage).
- The average mortgage conversion rate from application to close is 82%, meaning 18% of applications fall through post-submission (WorldMetrics).
- Post-approval communication reduces loan abandonment by 25%, with 70% of borrowers citing clear communication as a closing factor (WorldMetrics).
- Google Ads delivers a $230.60 CPA while Meta Ads achieves a 2.4x ROAS — channel-level tracking determines which investment scales (Benchmarketing).
- 30% of mortgage website visitors abandon due to slow load times, costing lenders measurable pipeline value (WorldMetrics).
Technology Adoption in Mortgage Marketing
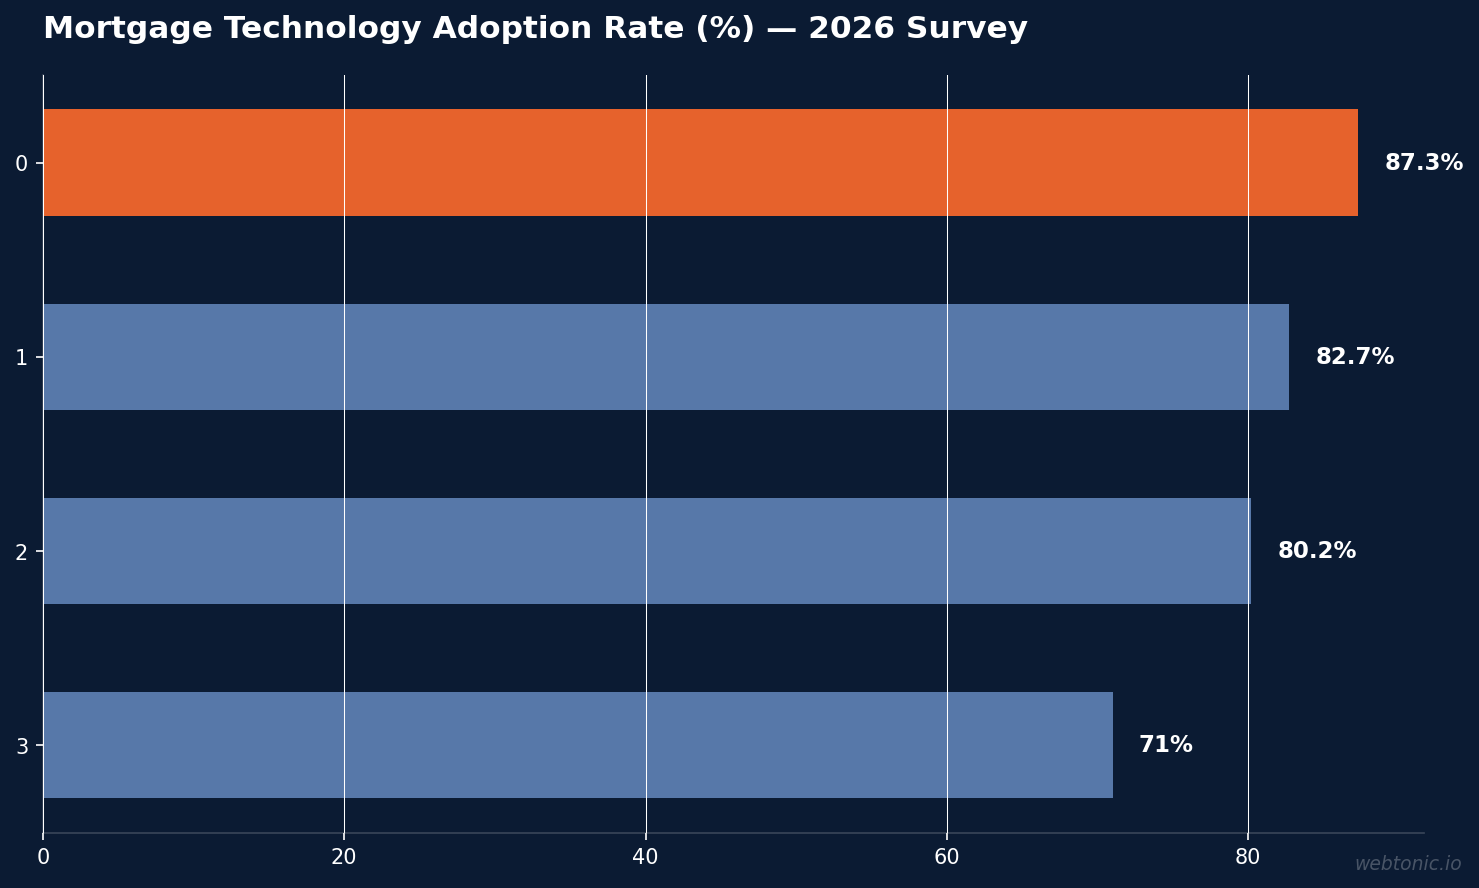
The 2026 AD Mortgage Broker Technology Survey reveals which tools mortgage professionals now consider baseline infrastructure versus emerging capabilities. The adoption gap between established and emerging technology highlights where data intelligence investments deliver the fastest returns.
| Technology | Adoption Rate | Category |
|---|---|---|
| E-signatures | 87.3% | Baseline |
| CRM / Lead management | 82.7% | Baseline |
| Pricing calculators | 80.2% | Baseline |
| AI-powered tools | ~71% | Emerging |
Source: HousingWire / AD Mortgage 2026 Survey
Marketing Attribution and ROI Measurement
Most mortgage lenders know their cost per lead. Far fewer know their cost per funded loan by channel. The gap between these two metrics is where marketing attribution separates high-performing lenders from the rest.
Bill Rice Strategy Group identifies the core challenge: mortgage sales cycles span 30–90 days from first touch to close, crossing regulatory checkpoints rather than arbitrary time periods. Standard last-click attribution misses the 5–8 touchpoints that actually influenced the borrower's decision. CRM integration needs to capture more than basic lead source data — it must track acquisition source, engagement depth, and conversion likelihood at each stage.
| Attribution Model | Complexity | Best For | Limitation |
|---|---|---|---|
| Last-click | Low | Quick reporting | Ignores 80%+ of touchpoints |
| First-touch | Low | Channel discovery | Over-credits awareness, ignores nurture |
| Linear / U-shaped | Medium | Multi-channel teams | Equal weighting may not reflect reality |
| Data-driven / ML | High | Enterprise lenders | Requires high volume + clean data |
Sources: Bill Rice Strategy Group, Cometly
Channel Performance Benchmarks
Effective analytics starts with knowing what "good" looks like by channel. The Benchmarketing 2026 dataset provides the most granular mortgage-specific benchmarks available, covering the core growth marketing channels.
| Channel / Metric | Benchmark Value | Source Period |
|---|---|---|
| Google Ads CTR | 2.64% | Q1 2023–Q4 2024 |
| Google Ads CPC | $7.84 | Q1 2023–Q4 2024 |
| Google Ads Conversion Rate | 3.40% | Q1 2023–Q4 2024 |
| Google Ads CPA | $230.60 | Q1 2023–Q4 2024 |
| Meta Ads CTR | 0.74% | Q1 2023–Q4 2024 |
| Meta Ads CPC | $3.24 | Q1 2023–Q4 2024 |
| Meta Ads ROAS | 2.4× | Q1 2023–Q4 2024 |
| Email Open Rate | 21.2% | Q1 2023–Q4 2024 |
| Email CTR | 2.2% | Q1 2023–Q4 2024 |
| Landing Page Conversion Rate | 2.80% | Q1 2023–Q4 2024 |
| LinkedIn CPL | $104.40 | Q1 2023–Q4 2024 |
Source: Benchmarketing
Conversion Funnel Analytics
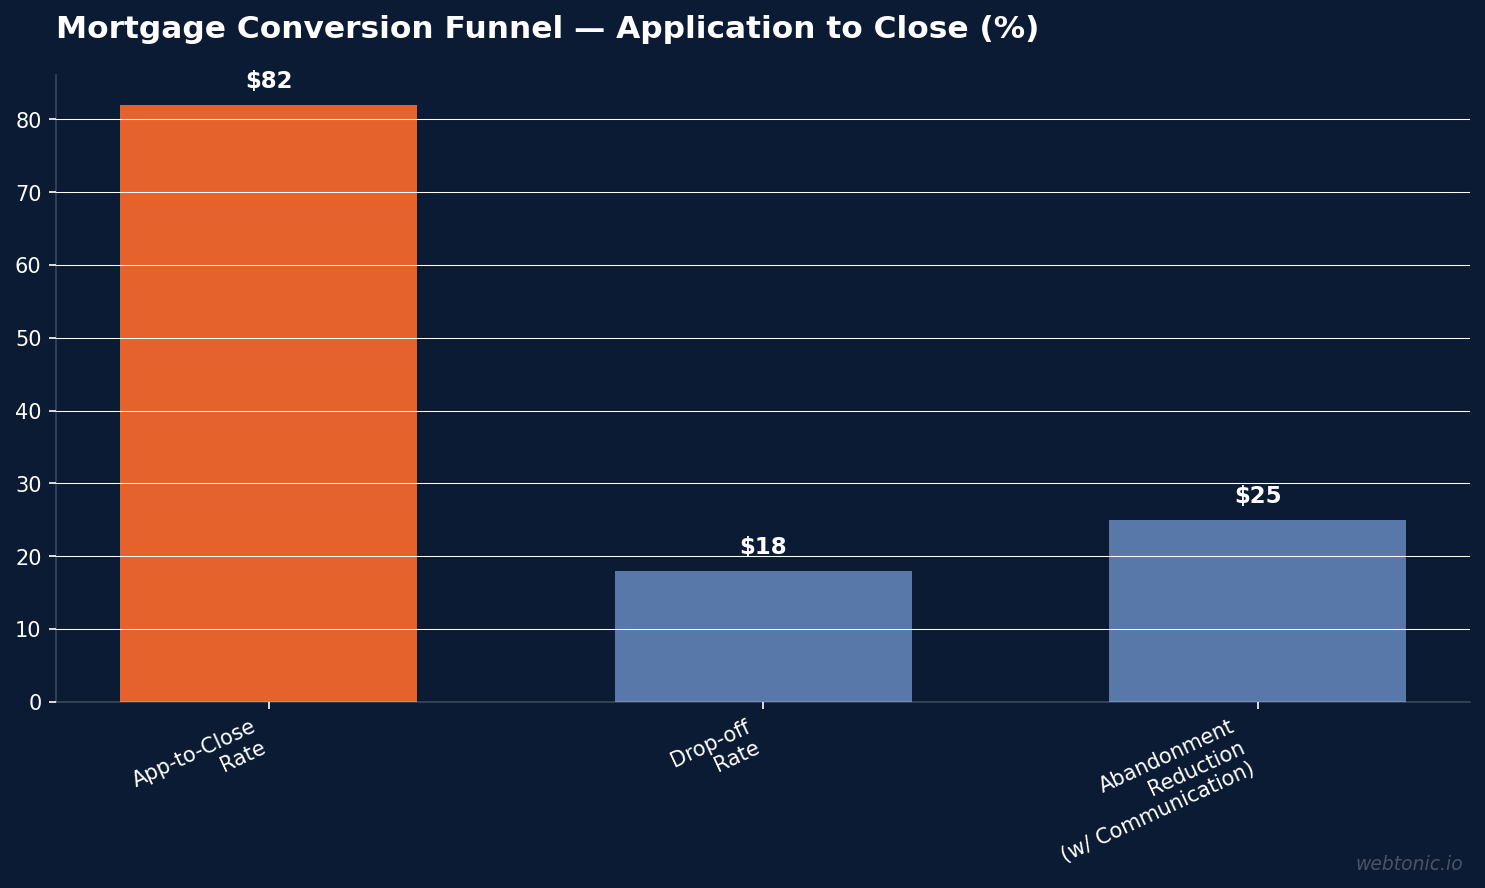
The mortgage conversion funnel has distinct measurement points that general marketing analytics often miss. The average conversion rate from application to close is 82% (WorldMetrics), meaning the 18% drop-off happens post-application — a stage where marketing analytics typically go dark.
Post-approval communication reduces loan abandonment rates by 25%, with 70% of borrowers citing clear communication as a key factor in completing their loan (WorldMetrics). For lenders using Google Ads, tracking conversions through to close — not just to application — reveals the true CPA and identifies which campaigns generate borrowers who actually fund.
Lead Scoring and Predictive Analytics
Not all mortgage leads deserve equal attention. MortgageLeads.com identifies predictive scoring as the next evolution: models that assess not just engagement signals but credit readiness, rate environment sensitivity, and timeline urgency. Modern mortgage CRMs like BNTouch and LoanPulse now offer real-time dashboards tracking pipeline value, conversion rates by stage, team performance, and commission forecasting.
Purchase mortgage leads convert 15% higher than refinance leads — a 3% vs. 2.6% close ratio (WorldMetrics). This insight is only actionable when analytics systems tag lead type at acquisition and track performance through to funding. Lenders that segment their funnel analytics by loan type, source, and rate environment make smarter allocation decisions than those relying on blended averages.
Website and Digital Analytics
Mortgage website performance metrics reveal critical friction points. The average time spent on a mortgage lender's website is 2 minutes and 15 seconds, with 30% of users abandoning due to slow load times (WorldMetrics). These numbers make page speed and user experience trackable revenue drivers, not just technical metrics.
68% of mortgage lenders use LinkedIn for lead generation (WorldMetrics), yet LinkedIn's $104.40 CPL (Benchmarketing) demands rigorous ROI tracking to justify the premium. Without attribution connecting LinkedIn leads to funded loans, the channel appears unprofitable — but lenders tracking the full funnel often find LinkedIn delivers higher-quality borrowers who close at above-average rates.
Data-Driven Marketing Performance
The analytics maturity of a mortgage operation directly predicts its marketing efficiency. Lenders who connect ad spend to funded-loan revenue operate on fundamentally different economics than those measuring CPL alone.
| Analytics Maturity Level | What Gets Tracked | Typical Outcome |
|---|---|---|
| Basic | Impressions, clicks, CPL | Spending decisions based on cheapest leads |
| Intermediate | CPL + application rate by channel | Better channel allocation, still blind post-app |
| Advanced | Click-to-close by source, rate environment overlay | Budget shifts toward highest CPFL channels |
| Elite | Predictive scoring + LTV + multi-touch attribution | Real-time allocation, rate-responsive budgets |
Sources: Bill Rice Strategy Group, MortgageLeads.com
Compliance Analytics
Mortgage advertising faces unique regulatory scrutiny. Regulatory fines against mortgage lenders totaled $450 million, with 35% related to advertising misrepresentation and 25% to disclosure violations (WorldMetrics). 70% of lenders report TRID compliance as their top challenge, with 20% citing complex documentation requirements. Tracking ad content compliance alongside performance ensures marketing analytics serve both growth and risk management.
Mortgage lenders spent $150,000 on average on compliance software, a 22% increase from prior years (WorldMetrics). This investment is only justified when analytics demonstrate its ROI — specifically, the reduction in violation risk and the speed at which compliant ad variations can be deployed and tracked through Meta and Google platforms.
CRM Integration and Pipeline Analytics
The gap between having a CRM (82.7% adoption) and using it for marketing attribution represents the single largest analytics opportunity in mortgage. Most CRM implementations capture lead source at the point of entry but fail to track the 5–8 marketing touchpoints that influenced the borrower before they submitted a form. Bill Rice Strategy Group emphasizes that CRM integration must go beyond basic source tagging — it needs to capture engagement depth, content consumption patterns, and rate-environment context at each interaction.
Modern mortgage CRM platforms like LoanPulse now offer real-time dashboards tracking pipeline value, conversion rates by stage, team performance, and commission forecasting. These dashboards transform raw data into actionable intelligence: which loan officers close fastest from which lead sources, which rate environments produce the highest application volumes, and where pipeline velocity stalls. Referral programs account for 32% of new mortgage originations, with referred clients showing 20% higher lifetime value (WorldMetrics) — a metric only visible when CRM data connects acquisition source to long-term revenue.
AI and Predictive Analytics Adoption
The 2026 AD Mortgage Broker Survey reveals that approximately 71% of mortgage professionals now use AI-powered tools, making it the fastest-growing technology category in the industry. However, HousingWire reports significant training gaps — adoption outpaces competence, meaning many lenders have AI tools they do not fully leverage.
MortgageLeads.com identifies predictive scoring as the next frontier: models that assess not just behavioral engagement signals but credit readiness, rate-environment sensitivity, and timeline urgency. These models go beyond simple lead scoring by incorporating external data — rate movements, local housing inventory, and seasonal patterns — to predict which leads are most likely to convert in the current market conditions.
For lenders with sufficient data volume, machine learning attribution models outperform rules-based approaches by identifying non-obvious patterns in the borrower journey (Cometly). A first-touch model might credit a Google Ads click, but an ML model might reveal that borrowers who engaged with a rate-alert email within 48 hours of that click close at 3× the rate of those who did not — an insight invisible to simpler attribution frameworks.
Speed-to-Contact Analytics
Response time is the most predictive single metric in mortgage lead conversion. BNTouch and LoanPulse both track contact rate, response time, and appointment rate as core pipeline metrics. The industry data is consistent: leads contacted within 5 minutes convert at 5–10× the rate of leads contacted after 30 minutes. For Facebook Ads campaigns where lead forms auto-submit, the speed-to-contact window starts the instant the form is completed — not when the CRM notification reaches the loan officer.
Analytics systems that track and display response time by loan officer, lead source, and time of day enable management to identify and correct bottlenecks. Purchase mortgage leads have a 15% higher conversion rate than refinance leads (WorldMetrics), but this advantage disappears if response time exceeds the borrower's attention window. Tracking this interaction between lead type and response time is where advanced analytics creates measurable revenue impact.
Frequently Asked Questions
What percentage of mortgage brokers use CRM systems?
82.7% of mortgage professionals use CRM or lead management systems according to the 2026 AD Mortgage Broker Technology Survey. E-signatures lead adoption at 87.3%, while pricing calculators sit at 80.2%. AI-powered tools are the fastest-growing category at approximately 71% adoption, though training gaps remain significant.
What is the average mortgage application-to-close rate?
The average mortgage conversion rate from application to close is 82% (WorldMetrics), meaning 18% of applications fail to result in a funded loan. Post-approval communication — status updates, next-step guidance, and proactive outreach — reduces this abandonment by 25%.
How long is the typical mortgage marketing attribution window?
Mortgage sales cycles typically span 30–90 days from first marketing touch to close, crossing multiple regulatory checkpoints. Standard 7-day or 28-day attribution windows used by ad platforms capture only a fraction of the borrower journey. Click-to-close tracking aligned to regulatory milestones provides a more accurate picture.
What are the key mortgage marketing benchmarks for 2026?
Benchmarketing's 2026 dataset reports median values of $7.84 CPC and 3.40% conversion rate on Google Ads, $3.24 CPC and 2.4x ROAS on Meta Ads, 21.2% email open rate, and 2.80% landing page conversion rate. LinkedIn CPL averages $104.40 for mortgage campaigns.
Why do mortgage lenders struggle with marketing attribution?
Three structural factors make mortgage attribution difficult: the 30–90 day sales cycle exceeds standard ad platform attribution windows, regulatory checkpoints create non-linear funnels, and offline touchpoints (phone calls, in-person meetings, document exchanges) are hard to connect to digital marketing data. Multi-touch models and CRM-to-ad-platform integrations address these gaps.
Sources
https://www.benchmarketing.org/benchmarks/industries/mortgage
https://www.housingwire.com/articles/ad-mortgage-broker-ai
https://billricestrategy.com/blog/mortgage-lender-marketing-attribution
https://worldmetrics.org/marketing-in-the-mortgage-industry-statistics/
https://www.cometly.com/post/attribution-for-financial-services-marketing
https://mortgageleads.com/best-lead-scoring-models-for-mortgage-lenders-in-2026/
https://bntouch.com/mortgage-blog/mortgage-landing-pages-that-convert/
https://www.loanpulse.com/features/
https://leadpops.com/blog/mortgage-lead-conversion-rates


