



Table of contents

Growth teams already track too many numbers and too few of the ones that predict anything. Cross-referencing 2026 SaaS, CMO and professional-services benchmarks against each other narrows the list to the handful that actually separate high-growth companies from flat ones.
Key Takeaways
- Median lifetime-value-to-CAC ratio is 4.1x across 342 B2B SaaS companies.
- Top-quartile companies reach 7.8x, up from 6.0x the year before.
- The bottom quartile sits at just 1.1x - barely above break-even.
- Median CAC payback period improved to 16 months, down from 18.
- That is an 11% improvement in a single year.
- Median blended CAC ratio sits at USD 1.30.
- Median gross revenue retention is 88%, down from 91%.
- Net revenue retention is 108% for usage-based products versus 95% seat-based.
- High-growth firms spend 12% of revenue on marketing.
- No-growth firms spend 5% - less than half as much.
- The broad market benchmark for marketing spend is 8% of revenue.
- AI use across marketing activities rose from 13.1% to 24.2% in two years.
- Generative AI use specifically grew 220%, from 7.0% to 22.4%.
- Content creation leads AI adoption at 73.9% of marketers.
- No martech capability scores above 5 out of 7 on self-rated ROI proof.
The metric problem: too many dashboards, not enough decisions
Most marketing dashboards report a dozen or more metrics at once, and most of them move together or not at all. The benchmarks that actually separate high-growth companies from flat ones cluster around three questions: are we still efficient at acquiring customers, are we keeping the customers we win, and is the spend itself scaling with revenue. Everything else is context.
What high-growth firms measure differently
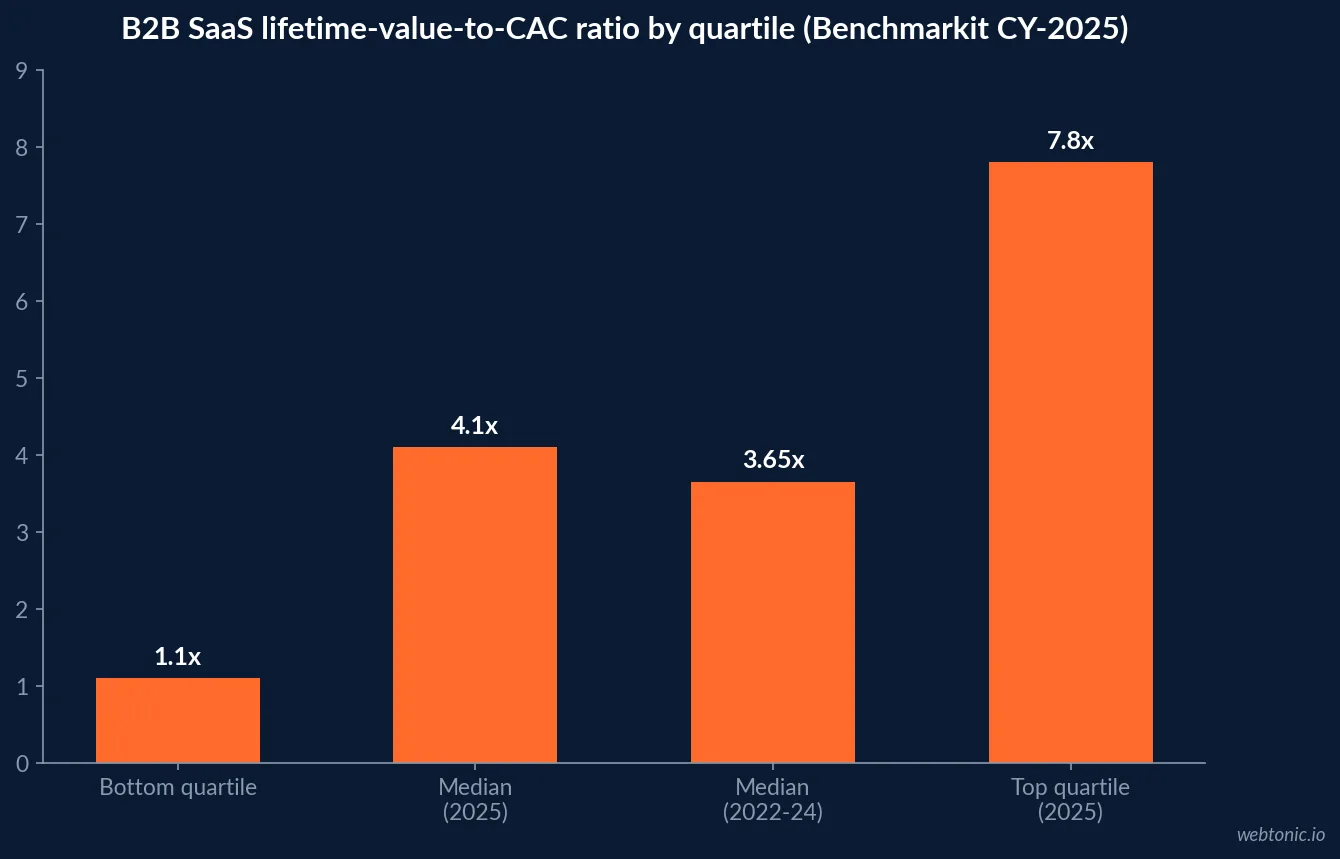
Benchmarkit's CY-2025 benchmarks, drawn from 342 B2B SaaS and AI-native companies, put the median customer acquisition cost payback period at 16 months, an 11% improvement from 18 months the prior year, and the median blended CAC ratio at USD 1.30. Aleph's read of the same dataset shows the median LTV-to-CAC ratio climbing to 4.1x in 2025 after holding flat at 3.6 to 3.7x from 2022 through 2024 — a real inflection, not noise — with the top quartile jumping from 6.0x to 7.8x and vertical SaaS outperforming horizontal SaaS, 5.6x versus 4.1x.
| Growth-efficiency metric (Benchmarkit CY-2025) | Figure | Direction vs. prior year |
|---|---|---|
| CAC payback period, median | 16 months | Improved from 18 months (+11%) |
| Blended CAC ratio, median | USD 1.30 | Improved on GTM rationalization |
| LTV-to-CAC ratio, median | 4.1x | Up from 3.6-3.7x (2022-24) |
| LTV-to-CAC ratio, top quartile | 7.8x | Up from 6.0x (+30%) |
| LTV-to-CAC ratio, bottom quartile | 1.1x | Barely above break-even |
The retention numbers that decide whether growth is real
Acquisition efficiency means little if the customers don't stay. Benchmarkit's data shows median gross revenue retention at 88%, down from 91% the year before, while net revenue retention diverges sharply by pricing model: 108% for usage-based products against 95% for seat-based ones. Tracking only net retention can hide a real churn problem if expansion revenue from a small set of accounts is masking losses elsewhere in the base — which is why gross and net retention belong on the same scorecard, not one standing in for the other.
| Retention metric (Benchmarkit CY-2025) | Figure |
|---|---|
| Gross revenue retention, median | 88% (down from 91%) |
| Net revenue retention, usage-based pricing | 108% |
| Net revenue retention, seat-based pricing | 95% |
| LTV:CAC, vertical SaaS | 5.6x |
| LTV:CAC, horizontal SaaS | 4.1x |
What the martech stack can actually prove
The CMO Survey's spring 2026 report has marketers self-rate their own capability across ten martech activities on a 7-point scale, and none score above 5. Generating ROI from marketing technologies rates 4.5, and demonstrating that ROI to stakeholders rates lower still at 4.4 — both up slightly from 2024, but nowhere near confident. Integrating martech across other company data systems rates just 4.0, unchanged. The gap between the metrics teams want to report and the metrics their stack can actually support is the real reason so many dashboards default to volume numbers instead.
| Martech self-rated capability (CMO Survey 2026, /7) | 2024 score | 2026 score |
|---|---|---|
| Generating ROI from martech | 4.5 | 4.5 |
| Demonstrating that ROI to stakeholders | 4.2 | 4.4 |
| Leveraging data for tactical decisions | 4.6 | 4.8 |
| Leveraging data for strategic decisions | 4.6 | 4.6 |
| Integrating martech across data systems | 4.0 | 4.0 |
Budget as the metric that funds all the others
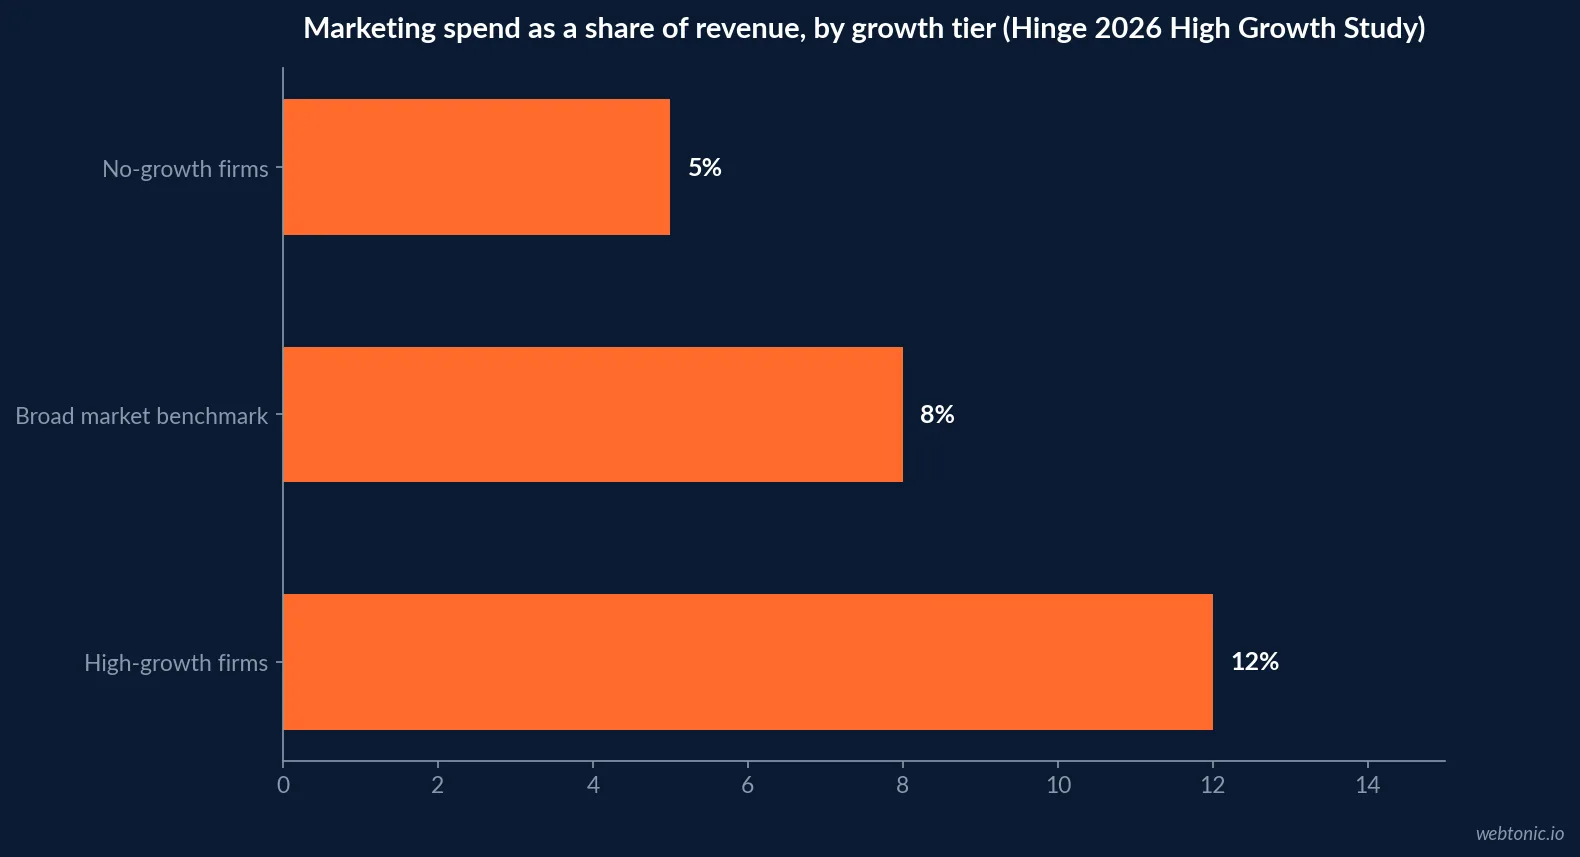
Hinge Marketing's 2026 High Growth Study found firms growing 20% or more annually for three consecutive years spend 12% of revenue on marketing — up from 10% in the 2025 edition, a 20% jump — against a broad market benchmark of 8% and just 5% for firms with flat or declining revenue. No-growth firms not only spent less; they kept their budget exactly flat year over year while their revenue kept declining. The correlation between spend and growth is one of the most consistent findings in the study's eleven annual editions, even though it cannot on its own prove which is causing the other.
| Marketing spend as % of revenue (Hinge 2026) | Figure |
|---|---|
| High-growth firms (20%+ annual growth, 3 yrs) | 12% |
| Broad market benchmark | 8% |
| No-growth firms (flat or declining revenue) | 5% |
| High-growth spend vs. no-growth spend | More than 2x |
The most common metric mistakes in a growth review
Three patterns show up repeatedly in the benchmark data above and in the dashboards teams actually build from it. First, reporting net revenue retention alone, which the usage-based-versus-seat-based split (108% against 95%) shows can move for reasons that have nothing to do with churn. Second, treating a single quarter's LTV:CAC as stable, when Benchmarkit's own three-year series shows the median holding flat for three straight years before jumping in a single reporting cycle — one good quarter is not a trend. Third, comparing marketing spend as a percent of revenue against a peer company without also comparing growth rate, since Hinge's data shows the ratio only becomes meaningful once it is read against outcome, not in isolation.
| Common mistake | Why it misleads | What Benchmarkit or Hinge data shows instead |
|---|---|---|
| Reporting NRR without GRR | Expansion can mask churn | NRR gap of 108% vs. 95% tracks pricing model, not health alone |
| Treating one quarter's LTV:CAC as a trend | Ratios can hold flat for years then jump | Median held at 3.6-3.7x for three years before the 2025 jump to 4.1x |
| Comparing spend % without growth rate | Spend alone doesn't prove causation | 12% spend only means something next to 20%+ growth |
| Citing vanity reach with no cost attached | No benchmark source treats it as a growth indicator | None of the four cited studies use it as a standalone metric |
Vanity metrics vs. metrics that predict growth
Reach, impressions and follower counts appear in none of the benchmark sources above as a standalone growth indicator, and that absence is the point. Every metric with a defensible 2026 benchmark — CAC payback, LTV:CAC, gross and net retention, spend as a share of revenue — ties directly to cash: what it costs to win a customer, whether that customer stays, and whether the spend scales with the business. A volume metric with no cost or retention context attached cannot answer any of those three questions, which is why it belongs in a supporting appendix, not the first slide of a growth review.
What marketing leadership costs against what it has to prove
The scorecard above is cheap to build and expensive to staff. The US Bureau of Labor Statistics puts the median annual wage for marketing managers at USD 157,620, with the top quartile earning USD 208,000 or more — a cost that only pays for itself if the metrics above are the ones that make it to the board deck. Gartner's 2026 CMO Spend Survey of 401 CMOs found budgets allocating 15.3% to AI initiatives even though only 30% of teams report the maturity to scale that spend, and 56% say their organization lacks the budget to deliver its 2026 strategy at all. Adjacent competitive-intelligence teams show the same pattern: Crayon's 2026 report found programs with all three of KPI tracking, a platform and an executive sponsor achieve measured revenue impact at 3.6 times the rate of programs with none of the three — the same maturity gap that decides whether a marketing scorecard gets used once someone has paid to build it.
| Marketing manager pay (BLS OEWS 2023) | Annual wage, USD |
|---|---|
| 10th percentile | 79,600 |
| 25th percentile | 108,000 |
| Median (50th percentile) | 157,620 |
| 75th percentile | 208,000 |
Building the five-metric scorecard
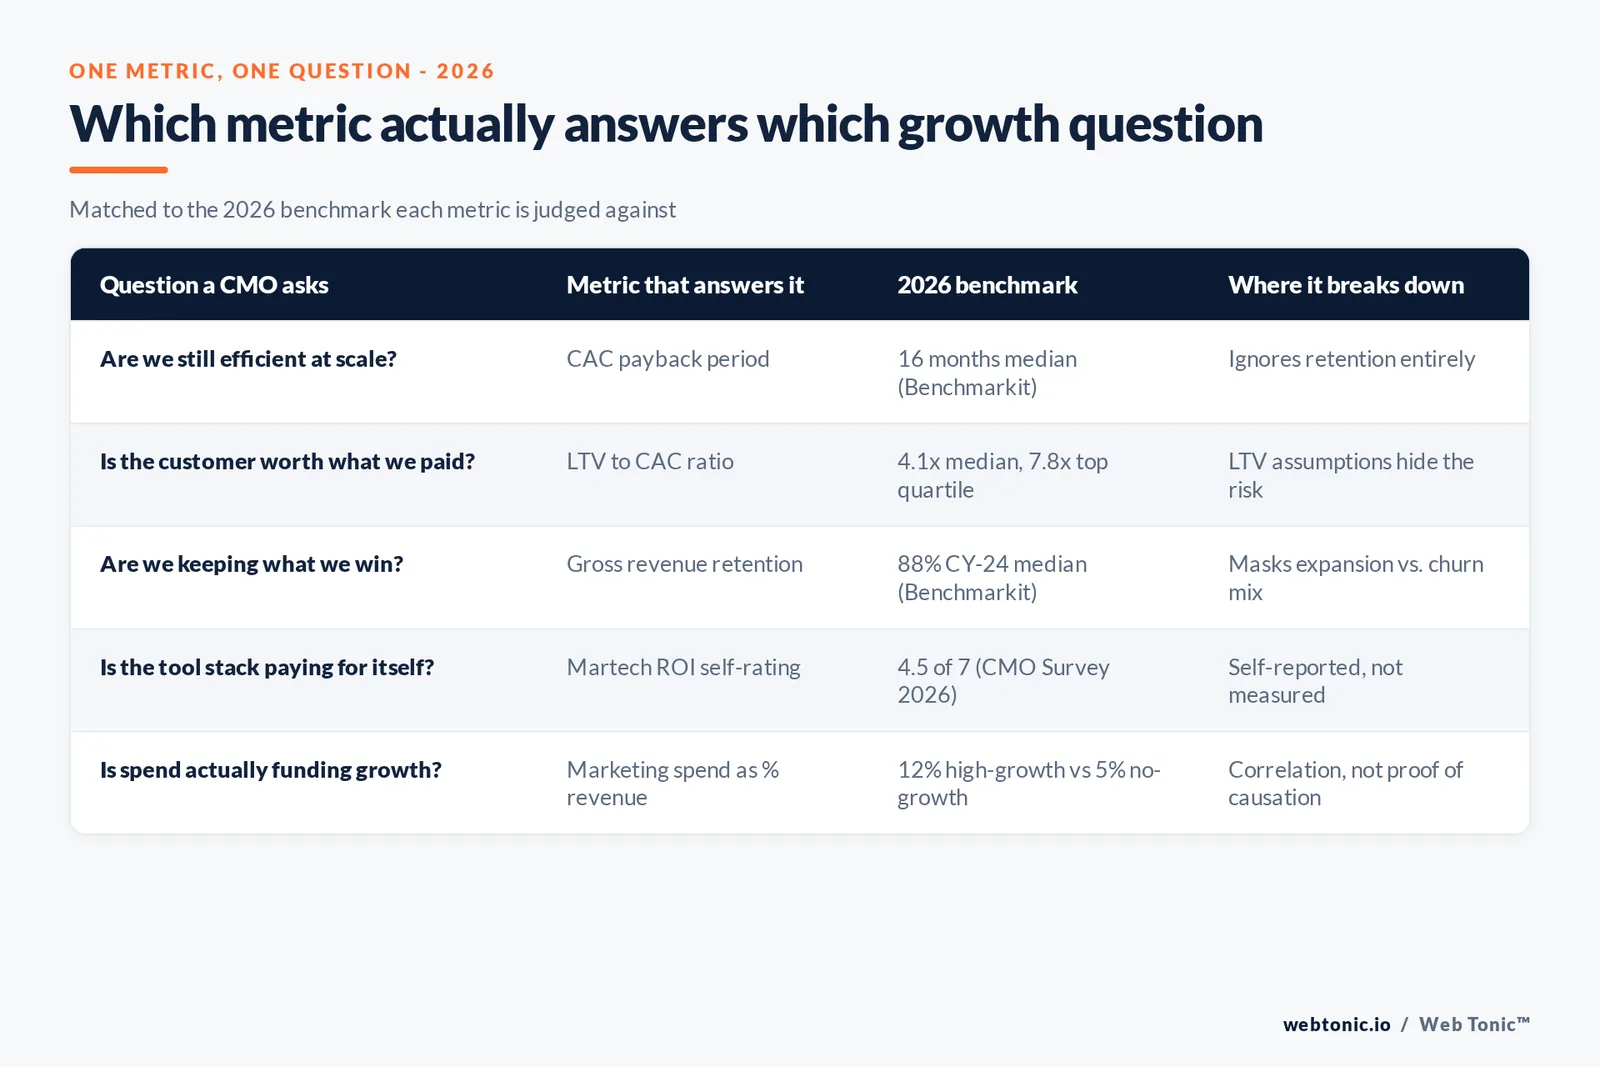
Pair CAC payback with LTV:CAC so efficiency and value are read together, not separately. Track gross retention alongside net retention so expansion revenue cannot quietly cover for churn. Report marketing spend as a share of revenue against your own growth rate, not just against the broad market benchmark. Rate your own martech stack honestly against the CMO Survey's 7-point scale before promising a metric it cannot yet prove. Our data and analytics practice builds this scorecard directly from a client's own CRM and billing data rather than self-reported survey averages.
If the scorecard points to a spend problem rather than a tracking one, see our growth marketing practice or our guide to when paid social is actually worth the spend, or talk to us directly.
Frequently Asked Questions
Which single marketing metric best predicts future growth?
No single metric does the whole job, but lifetime-value-to-CAC ratio comes closest for subscription and repeat-purchase businesses. Benchmarkit's CY-2025 benchmarks across 342 B2B SaaS and AI-native companies put the median LTV-to-CAC ratio at 4.1x, above the classic 3:1 rule of thumb, with the top quartile reaching 7.8x and the bottom quartile at just 1.1x - a company where lifetime value barely exceeds acquisition cost. Read it alongside CAC payback period, because a strong ratio with a slow payback can still strain cash even while it looks healthy on a slide.
Is marketing spend as a percent of revenue actually correlated with growth?
The correlation is real and large, though it does not prove which way the causation runs. Hinge Marketing's 2026 High Growth Study found that firms growing 20% or more annually for three straight years spent 12% of revenue on marketing, more than double the 5% spent by firms with flat or declining revenue, and up from 10% in the 2025 edition. The broader market benchmark across all firms sits at 8%. High-growth firms are not just spending more; they increased their spend by 20% year over year while no-growth firms held theirs flat.
How much are marketing teams actually using AI in the metrics that matter?
It has grown quickly but from a low base. The CMO Survey's spring 2026 report found AI use across marketing activities nearly doubled in two years, from 13.1% of activities in 2024 to 24.2% in 2026, with generative AI specifically growing 220%, from 7.0% to 22.4%. Adoption is highest for content creation (73.9%) and content personalization (65.4%), and lowest for the activities that actually prove ROI: no marketing technology activity, including demonstrating ROI from martech, scores above 5 on the survey's 7-point capability scale.
What retention metric should sit next to CAC on a growth scorecard?
Gross revenue retention, tracked separately from net revenue retention. Benchmarkit's CY-2025 data shows median gross revenue retention at 88%, down from 91% the prior year, while net retention varies sharply by pricing model - 108% for usage-based products versus 95% for seat-based ones. Net retention alone can mask a churn problem if expansion revenue is covering for it, which is exactly why the two numbers need to sit on the same scorecard rather than either one standing alone.
Are vanity metrics like impressions or followers worth tracking at all?
Only as a supporting signal, never as the metric a growth decision hinges on. None of the 2026 benchmark sources cited on this page - Benchmarkit, the CMO Survey, or Hinge's High Growth Study - treat reach or engagement volume as a standalone growth indicator. The CMO Survey's self-rated martech capability data shows marketing teams already struggle to demonstrate ROI on the tools they have (a 4.4 out of 7 self-rating); adding volume metrics with no cost or retention context makes that harder, not easier, to defend in a budget conversation.
Sources
Benchmarkit - 2026 B2B SaaS and AI-Native Performance Benchmarks (CY-2025)
Benchmarkit - 2026 SaaS & AI-Native Metrics summary
Aleph - LTV:CAC ratio, what's good for SaaS in 2026
The CMO Survey - Spring 2026 results
The CMO Survey - Highlights and Insights Report 2026
Hinge Marketing - Is your marketing budget too high? (2026 High Growth Study)
Hinge Marketing - 2026 High Growth Study executive summary
US Bureau of Labor Statistics - Marketing Managers occupational wage estimates
Business Wire - Gartner 2026 CMO Spend Survey findings
Crayon - The 2026 State of Competitive Intelligence


