



Table of contents
The choice is not "advisor or analyst". It is whether the work in front of you is a finite build with a handover, or a permanent queue of questions. Get that wrong and you either hire a full-time analyst to do a six-week job, or retain an advisor to answer ad-hoc questions forever.
Key Takeaways
- A marketing KPI scorecard build is finite by design: definitions, 5–15 weekly rows, an automated production path, a review ritual. Finite work suits a scoped engagement.
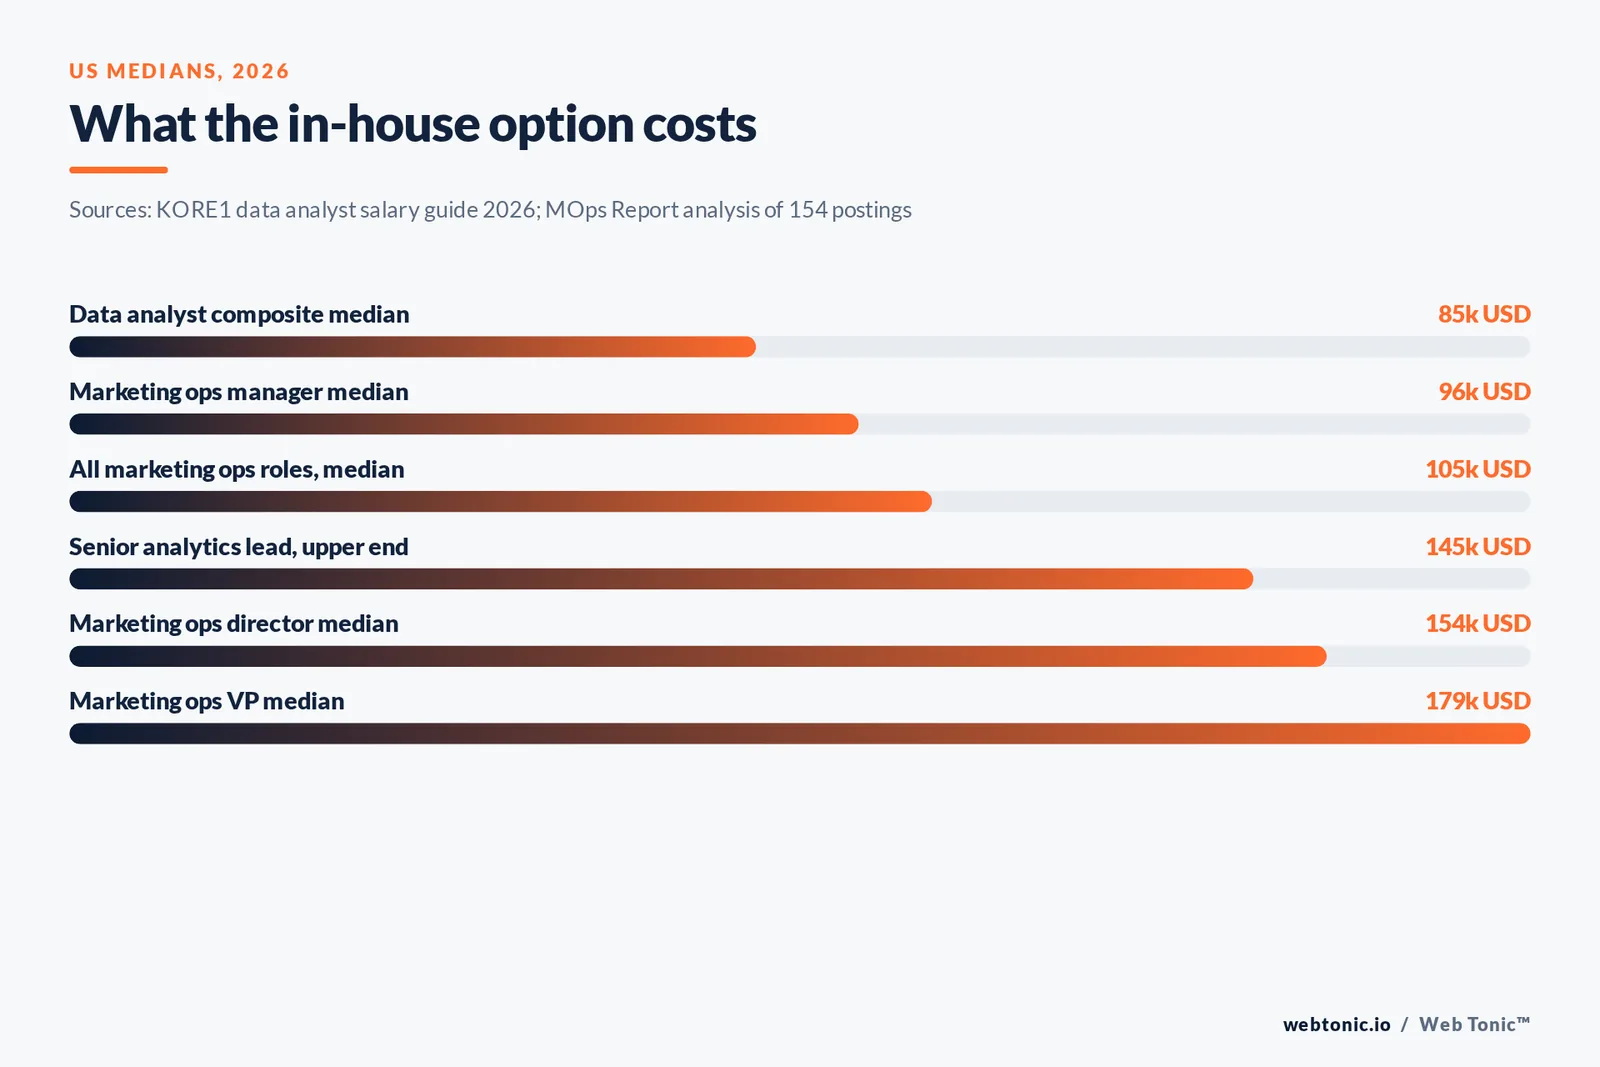
- An in-house analyst is the right answer when the demand is continuous. Published 2026 medians put US data analyst base pay near $82,000–$87,000, with analytics leads at $110,000–$145,000.
- Marketing operations pay runs higher: a $105,400 median across 154 postings, with director-level medians near $153,800.
- Total cost is not the salary. Add loading, a search, and a ramp quarter before comparing with any project fee.
- Adoption context matters: dedicated revenue operations sits at 41% of companies under $5M ARR and 96% above $100M. Below roughly $20M, hiring is often premature.
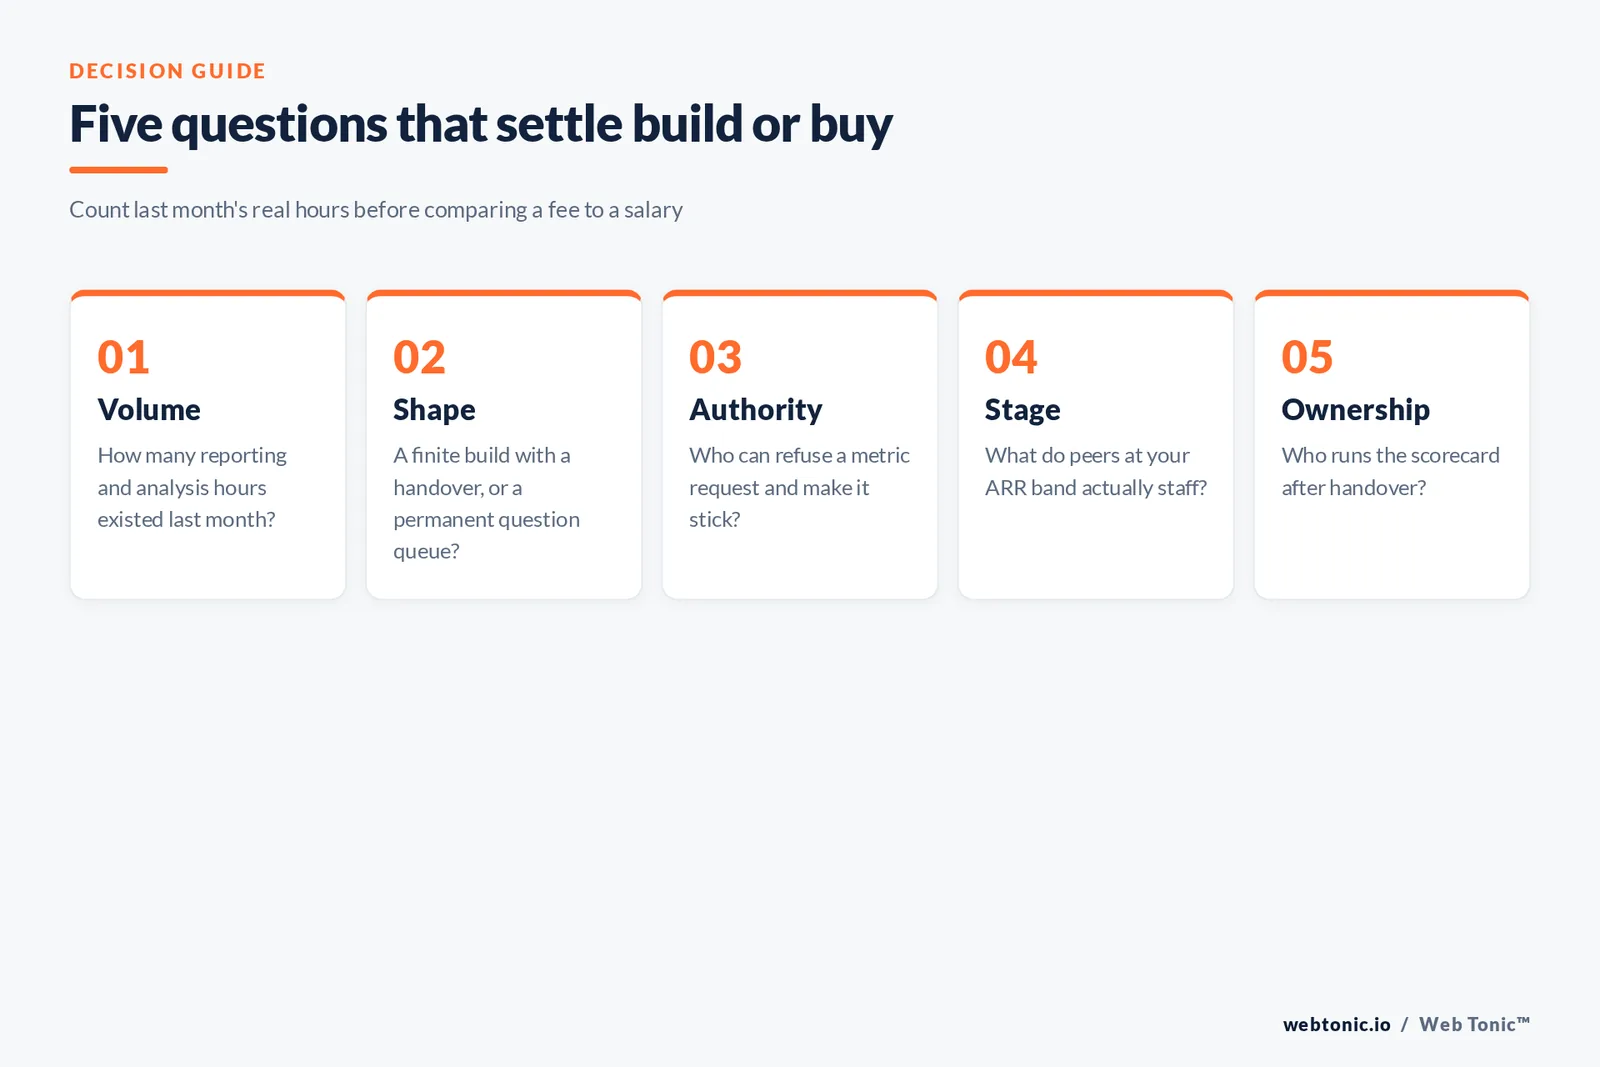
- The decision rule: count last month's reporting and analysis hours honestly. Under 10 hours a week, buy the build. Over 25, hire.
The two jobs people confuse
Job one is settling and building. Agree what each number means, pick the small set that leadership will actually review, wire each row to a source that refreshes itself, and install the weekly ritual. This has a beginning and an end. It looks like the EOS pattern — a weekly dashboard of 5 to 15 numbers reviewed in the first five minutes of the leadership meeting — and once it exists, maintaining it is light.
Job two is answering. Why did that cohort convert worse, which segment carries the margin, what happens if we shift budget between two channels, can we forecast next quarter from these inputs. That work never finishes, and it rewards someone who lives inside your data every day.
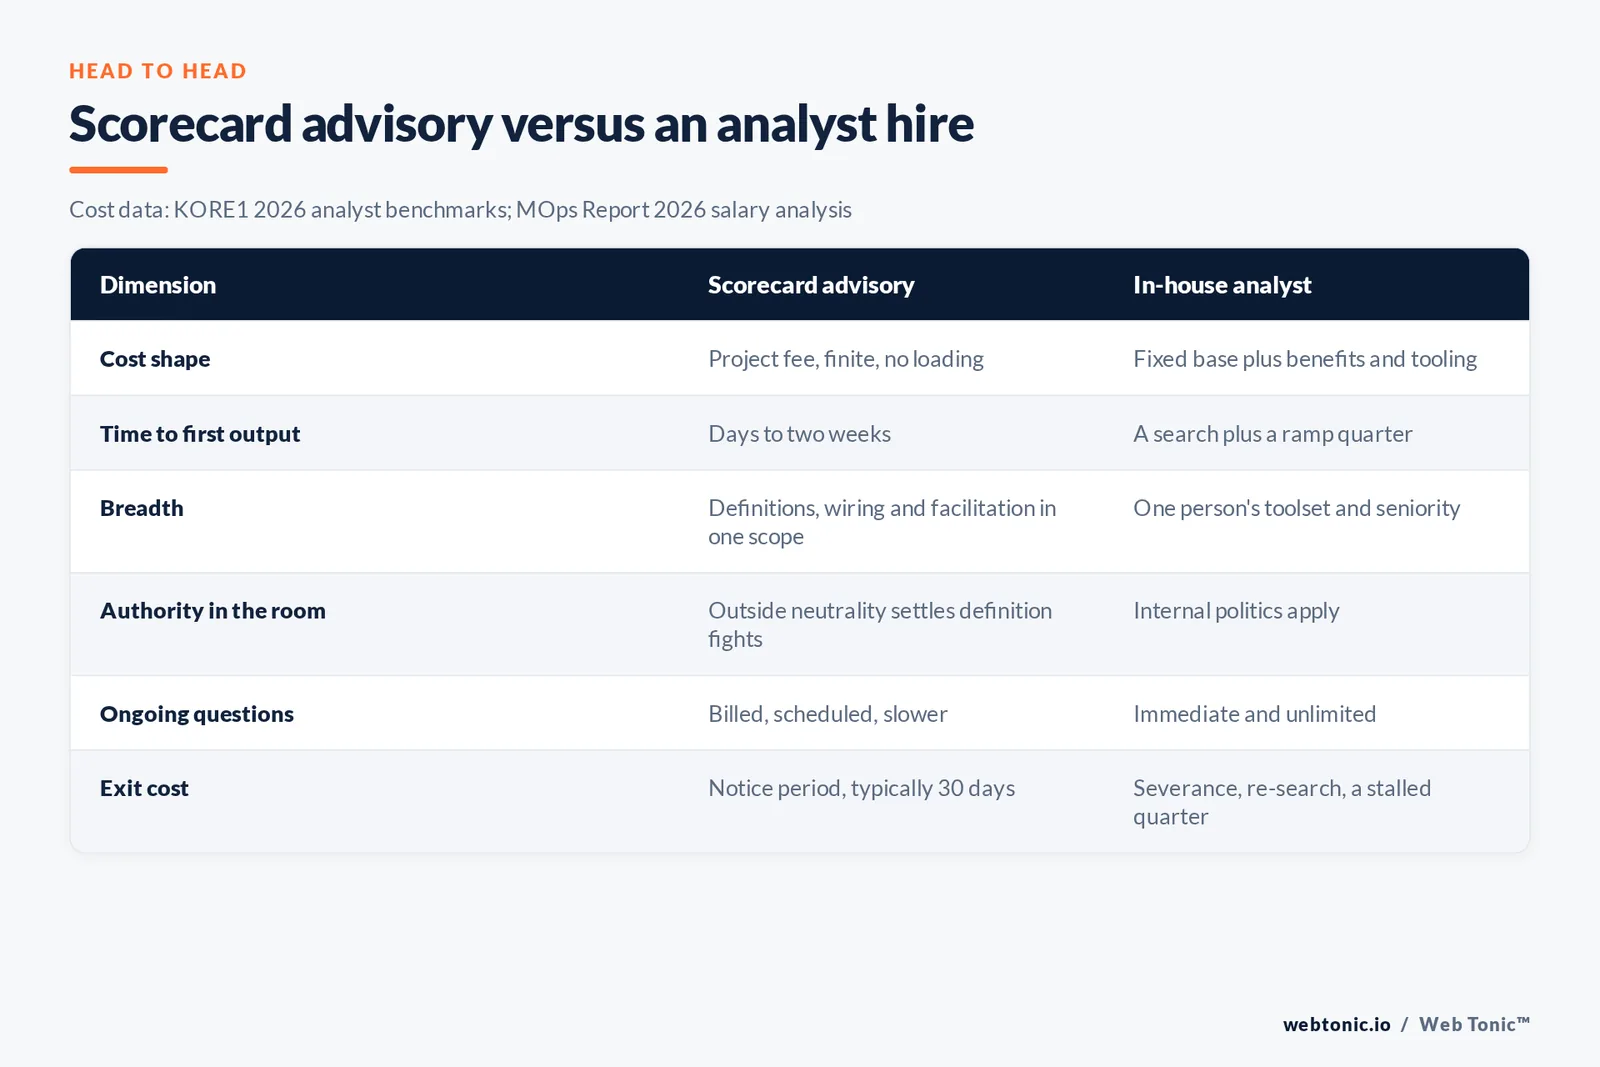
Almost every stalled reporting project we see is job one being funded as if it were job two, or the reverse. A scoped advisory does job one well and job two expensively. A salaried analyst does job two well and job one slowly, because it is their first project and they are also fielding requests.
| Dimension | Scorecard advisory | In-house analyst hire |
|---|---|---|
| Cost shape | Project fee, finite, no loading | Fixed base plus benefits and tooling |
| Time to first output | Days to two weeks | A search plus a ramp quarter |
| Breadth | Definitions, wiring and facilitation in one scope | One person's toolset and seniority |
| Authority in the room | Outside neutrality settles definition fights | Internal politics apply |
| Ongoing questions | Billed, scheduled, slower | Immediate and unlimited |
| Exit cost | Notice period, typically 30 days | Severance, re-search, a stalled quarter |
What the in-house option really costs
Start with base pay, then stop pretending that is the number. 2026 US data analyst benchmarks put the composite median base around $82,000–$87,000, mid-level at $78,000–$108,000, and senior analysts or analytics leads at $110,000–$145,000. If the role skews toward marketing systems rather than pure analysis, pay rises: an analysis of 154 marketing operations postings with disclosed pay found a $105,400 median, with manager medians near $96,000, senior manager $123,000, director $153,800 and VP $178,500.
Then add the parts that never appear in the requisition: employer taxes and benefits loading, software seats, a recruiting process, and the ramp. A new analyst's first month is access requests and orientation. Their first scorecard is also their first exposure to your definitions, which means they will discover the same contradictions an advisor would — just more slowly, and with less licence to force a decision.
There is a subtler cost. A junior hire inherits the political problem of telling two executives that their competing definitions cannot both live on the scorecard. That is a hard ask for someone in week three of a new job, and it is the single most common reason internal scorecard projects produce forty rows instead of twelve.
What the buy option really costs
Scoped measurement work is priced as a build, and the public ranges are consistent. 2026 analytics pricing analysis puts a single KPI dashboard at $3,000–$10,000 and a department-level BI implementation at $10,000–$35,000. Power BI project data lands in the same territory — $3,000–$8,000 for one well-built dashboard, $8,000–$15,000 for a departmental suite, $25,000+ for governed enterprise rollouts — with consulting rates of $100–$250 an hour. Wider surveys stretch further: one 2026 review of small-business dashboard builds spans $10,000 to $120,000 depending on sources, roles and automation.
Note what those figures buy: a build. They do not buy a standing answer service. Fractional operations retainers, for comparison, are quoted from roughly $3,500 to $10,000 a month in the 2026 revenue operations buyer's guide, which also notes a three-person in-house ops team runs near $270,000 a year fully loaded. Advisory sessions with an operating-system implementer are priced similarly per unit of time: 48% of implementers charge $5,001–$7,500 for a full day, per the 2026 State of EOS survey of 97 practitioners across 25 countries.
We will not quote our own fee here — scope drives it, and a number without a scope is noise. What we will say is that the comparison people should run is not "fee versus salary" but "fee versus salary plus loading plus search plus a quarter of ramp, against the value of having the numbers eleven weeks sooner".
| Cost element | Advisory build | In-house hire, year one |
|---|---|---|
| Direct cost | Project fee, scoped | Base pay, often $82k–$154k by level |
| Loading | None | Taxes, benefits, seats, equipment |
| Acquisition | A scoping call | Search, interviews, offer cycle |
| Ramp | Working in week one | Weeks of access and orientation |
| Ongoing capacity | Ends at handover | Permanent, elastic, immediate |
| Risk if wrong | Scope ends | Re-hire and a lost quarter |
Volume is the honest test
Count the hours. Not the hours people feel; the hours in last month's calendar and message history. One time audit of lean marketing teams found 15% of the working week — roughly 6 hours — spent assembling reports, and reporting-load modelling puts manual assembly near 9 hours a week across five accounts and about 34 hours across twenty.
Three bands, and they are not subtle:
Under 10 hours a week of reporting and analysis demand: buy the build. A salaried analyst will be underemployed, and underemployed analysts generate work to justify the seat — usually in the form of more dashboards nobody asked for.
10 to 25 hours a week: build first, then decide. Automation typically removes the bottom half of that range. Teams that fix the production path routinely go from 15+ hours a week to under 2, according to reporting automation case data. Hiring before automating means hiring someone to do work that should not exist.
Over 25 hours a week, or an analytical question queue that never empties: hire. At that point you are not buying a scorecard, you are buying capacity, and capacity is cheaper salaried.
Stage is the sanity check on all three. The 2026 RevOps report across 1,200+ B2B companies found dedicated operations functions at 41% of companies under $5M ARR, 74% in the $5–20M band, 89% at $20–100M and 96% above $100M, with a healthy ratio of about one ops person per 25–30 revenue staff. If you are well under the band where peers staff the function, the market is telling you to buy the build.
The sequence that avoids both mistakes
Buy the build, then hire against the residue. After a scorecard exists with definitions, owners and automated rows, the remaining demand is visible and specific — and it is usually a different job description than the one you would have written six weeks earlier. Several teams discover the residual need is a systems administrator, not an analyst, because the questions were never the bottleneck; the plumbing was. That is when operations work is the right next step rather than a headcount.
Hiring first is defensible in exactly one case: you already know the queue is permanent and large, and you have someone senior enough to arbitrate definitions on day one. Otherwise the first hire spends their honeymoon doing archaeology.
One more thing worth protecting either way: the handover. An engagement that leaves you dependent on the person who built it has failed, whichever employment model paid for it. Documentation, named owners per row, and a team that can run the weekly review alone are the acceptance criteria. That is the standard we hold ourselves to, and it is the question to ask any provider or candidate before you commit.
If the wider question is who sets marketing direction rather than who reports it, that is a leadership question, not a measurement one — and it should be decided separately.
If you do hire, hire with a scorecard
There is a neat symmetry here worth using: the discipline that makes a KPI scorecard work also makes recruitment work. Structured, criteria-first hiring beats impressions, and a scoring sheet for candidates is the same instrument as a scoring sheet for the business.
Write the criteria before you post the role. For a marketing analytics or operations hire, five criteria usually carry the decision: technical skill in your actual stack, judgement about which numbers matter, communication with non-technical executives, willingness to say no to metric requests, and the operating experience to document what they build. Score every candidate against those five on the same scale, in structured interviews with the same questions, and you avoid the classic outcome — hiring the most fluent interviewee rather than the person who can settle a definitions argument in a room with two senior stakeholders.
Set the market context before you set the salary band. The talent supply for fractional and part-time analytics work has broadened considerably, which means a role you cannot yet justify full-time can often be covered credibly at a fraction of a seat. If the industry ratio for your revenue band implies a fraction of a person, a full-time posting will attract candidates who are overqualified for the work or underqualified for the room.
Then measure the hire the way you measure the scorecard: reproducibility of the numbers they produce, hours removed from the reporting cycle, documentation coverage, and decisions their work changed. Those four are visible inside a quarter, they are fair to the candidate, and they are far better evidence than a dashboard demo in month two.
The hybrid most teams actually land on
In practice the answer is rarely pure. The pattern that works most often is a scoped build to settle definitions and automate production, followed by a part-time or junior internal owner who maintains the system and fields routine questions, with senior analytical help called in for specific decisions — a pricing change, a channel mix review, a board cycle.
That shape matches how the market staffs the function. The 2026 RevOps report found healthy teams running roughly one operations person per 25–30 revenue staff, with the leanest top performers nearer 1:15–20 — ratios that imply a fraction of a person at most companies under $20M ARR, not a full analyst seat.
It also protects against the failure mode nobody budgets for: a good analyst leaving with the only working knowledge of how the numbers are produced. Documentation and named row owners are cheap insurance, and they are worth demanding whether the person doing the work is on payroll or on contract.
Whichever way you go, decide the maintenance question before the build question. If nobody internally will own the scorecard after handover, an advisory engagement produces a beautiful artifact with a shelf life of one quarter — and a hire produces a scorecard whose definitions drift the moment that person changes roles.

Related reading
- Marketing Team Structure & Hiring Advisory: vs hiring in-house
- Marketing KPI Scorecard Statistics: Hiring vs Outsourcing
- AI Marketing Advisory / AI Readiness: vs hiring in-house
- Marketing Strategy Consulting services at Web Tonic
Frequently Asked Questions
Is it cheaper to hire an analyst than to buy a scorecard build?
Not in year one, in most cases. Published 2026 medians put data analyst base pay near $82,000–$87,000 and marketing operations roles at a $105,400 median, before benefits loading, tooling, a search process and a ramp quarter. Scoped dashboard and KPI builds are quoted in the low five figures. Hiring wins on cost only when the ongoing demand is large enough to keep the seat busy.
What seniority do we need if we hire?
Senior enough to say no. The scorecard's value comes from being short, which means someone must refuse rows. In practice that is a manager-level or above hire, where published medians run from roughly $96,000 to $153,800 depending on level — or an outside advisor with a mandate to arbitrate.
Can we do this internally with no outside help?
Yes, if two conditions hold: one person has authority to settle definitions, and someone has the technical access to automate the numbers. If either is missing, the project usually produces a large dashboard and no ritual, which is the expensive failure.
How long should a scorecard build take?
Four to eight weeks for definitions, a populated set of rows, and a weekly review running without the advisor present. Published dashboard builds are commonly quoted at two to six weeks of delivery, and the extra weeks in a scorecard engagement are the facilitation, not the wiring.
What happens after the build?
Maintenance is light — new rows when the business changes, a definitions review each quarter, and a check that automated sources have not silently broken. That residual load is what tells you whether a hire is genuinely needed, and it is far easier to size once the scorecard exists.
See how our KPI scorecard advisory is scoped, explore data intelligence and our full services, read more on the blog, or tell us what your reporting week looks like.
Sources
EOS Worldwide FAQ · KORE1 2026 data analyst salary guide · MOps Report 2026 salary analysis (154 postings) · X-Byte 2026 analytics pricing guide · Seed Innovation Power BI cost analysis · Harmoni Strategy custom dashboard cost 2026 · Prospeo 2026 revenue operations buyer's guide · Success.co State of EOS 2026 · Spike AI marketing time audit · Wevion reporting-hours analysis · MarketerHire reporting automation · SyncGTM 2026 RevOps report.


