



Table of contents

Ninety days is enough to build a marketing KPI scorecard your leadership team trusts, and not enough to also fix everything the scorecard exposes. The plan below protects that distinction: settle definitions, automate production, install the weekly ritual, and log the mess for later.
Key Takeaways
- Order is everything: access, definitions, baseline, automation, ritual. Automating before definitions are settled industrialises the disagreement.
- Days 1–15 are unglamorous. Expect a list of contradictions, not a dashboard — and expect the same number to have 2 or 3 live answers.
- Keep it to 5–15 rows reviewed in about 5 minutes weekly. Row count is the discipline that makes the meeting survive.
- Trends need time. Three consecutive clean weeks is the earliest a pattern separates from noise; hold channel decisions until then.
- Name a data owner in the first month. Only 41% of organisations have one, and 62% report revenue lost to data problems.
- Day 90 acceptance test: your team runs the review alone, every row has an owner, and reporting takes under 2 hours a week instead of 15+.

Days 1–15: access, interviews, contradictions
Nothing starts until access does. Analytics, ad platforms, CRM, marketing automation, the finance view of revenue, and whatever spreadsheet the current report is actually built from. Read-only is fine for most; the CRM needs enough depth to see field definitions and stage history.
Then interviews, and the useful question is never "what do you measure". It is "show me the number you quoted in the last board meeting, and where it came from". That is where contradictions surface. In a typical fortnight we find the same metric produced three ways, a stage that means "verbal yes" to sales and "signed" to finance, and at least one row that no living person can reproduce.
This is the modal condition, not a local embarrassment. The Validity State of CRM Data Management 2026 survey of 500 practitioners found 62% had lost revenue to data quality problems, 67% had delayed campaigns, 63% faced compliance exposure, and a third of teams lose 6+ hours a week to fixing data — while only 41% could name a governance owner and just 21% called their CRM data AI-ready.
Deliverable by day 15: a written definition list (source, calculation, filter, refresh, owner per metric) and a contradiction log. The definition list is the actual foundation. Everything after it is plumbing and habit.
| Window | Work | Deliverable |
|---|---|---|
| Days 1–15 | Access, interviews, contradiction hunt | Definition list, contradiction log |
| Days 15–30 | Metric selection and target setting | 5–15 agreed rows with owners and goals |
| Days 30–45 | Rebuild last quarter, freeze a baseline | Signed-off baseline, blocked-row list |
| Days 45–60 | Automate production, kill manual pulls | Self-refreshing scorecard |
| Days 60–75 | Run the review, tune rows, prune | Three clean weeks of trend |
| Days 75–90 | Handover, documentation, quarterly cadence | Team runs it alone; decision log live |
Days 15–30: choose the rows, and refuse most of them
Selection is subtraction. Everyone arrives with candidates; the job is to keep the ones a leadership team can act on within a week. The EOS Scorecard convention — 5 to 15 weekly numbers, reviewed in the first five minutes of the weekly meeting — is the right ceiling, and starting nearer the floor is wiser.
Favour leading indicators. Revenue tells you about a period that has closed; pipeline created, qualified conversations booked, content shipped against plan, speed to first response and early retention signals tell you about the period you are still in. If a row goes red and nobody can act this week, it belongs in the monthly report.
Set targets at the same time as rows, or you will get them never. A row without a goal produces commentary instead of decisions. And assign one owner per row — not a team, a person — because shared ownership of a number reliably means nobody chases it.
Independent evidence for favouring inputs: the 2026 RevOps report across 1,200+ B2B companies found pipeline velocity the most-named metric for 2026, and reported 23% better forecast accuracy and 19% faster revenue growth among mature functions. Outcome numbers still matter; they just belong downstream of the rows you can influence.
Days 30–45: rebuild the past before you trust the present
Take last quarter and rebuild it from source, three ways where possible — platform, CRM, finance. Where they disagree, decide which is canonical and write the decision down. That document is worth more than the dashboard, because it is the thing that stops the argument recurring in month five.
Freeze the result as a baseline and get it signed off, with its known weaknesses listed. Attribution will be one of them. 2026 attribution benchmarks report roughly 38% signal loss and 22% of teams still running windows under 7 days, while multi-touch research puts multi-touch adoption at 47%, marketing mix modelling at 26%, and unattributable dark-funnel activity near 38%. A baseline that admits its uncertainty survives scrutiny; one that claims precision does not.
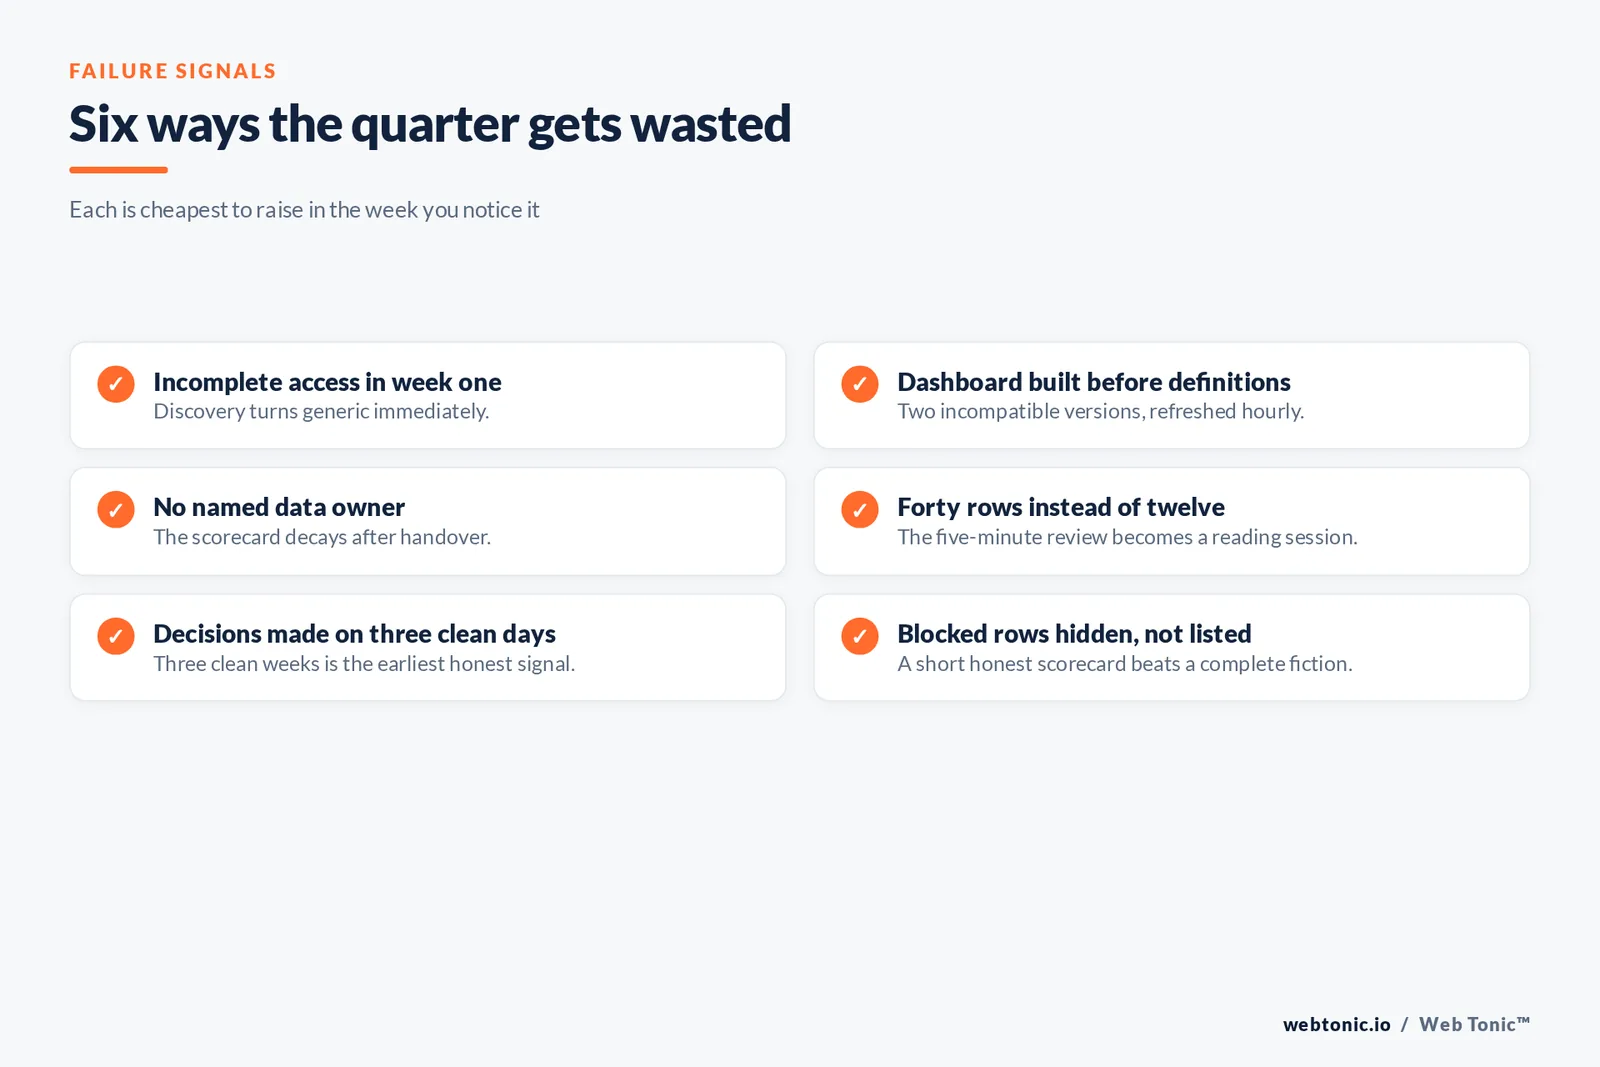
Also publish the blocked-row list: metrics you agreed to but cannot produce honestly yet, with the specific fix each needs. Blocked rows are not failures, they are scope for the next quarter. Hiding them is what turns a scorecard into fiction.
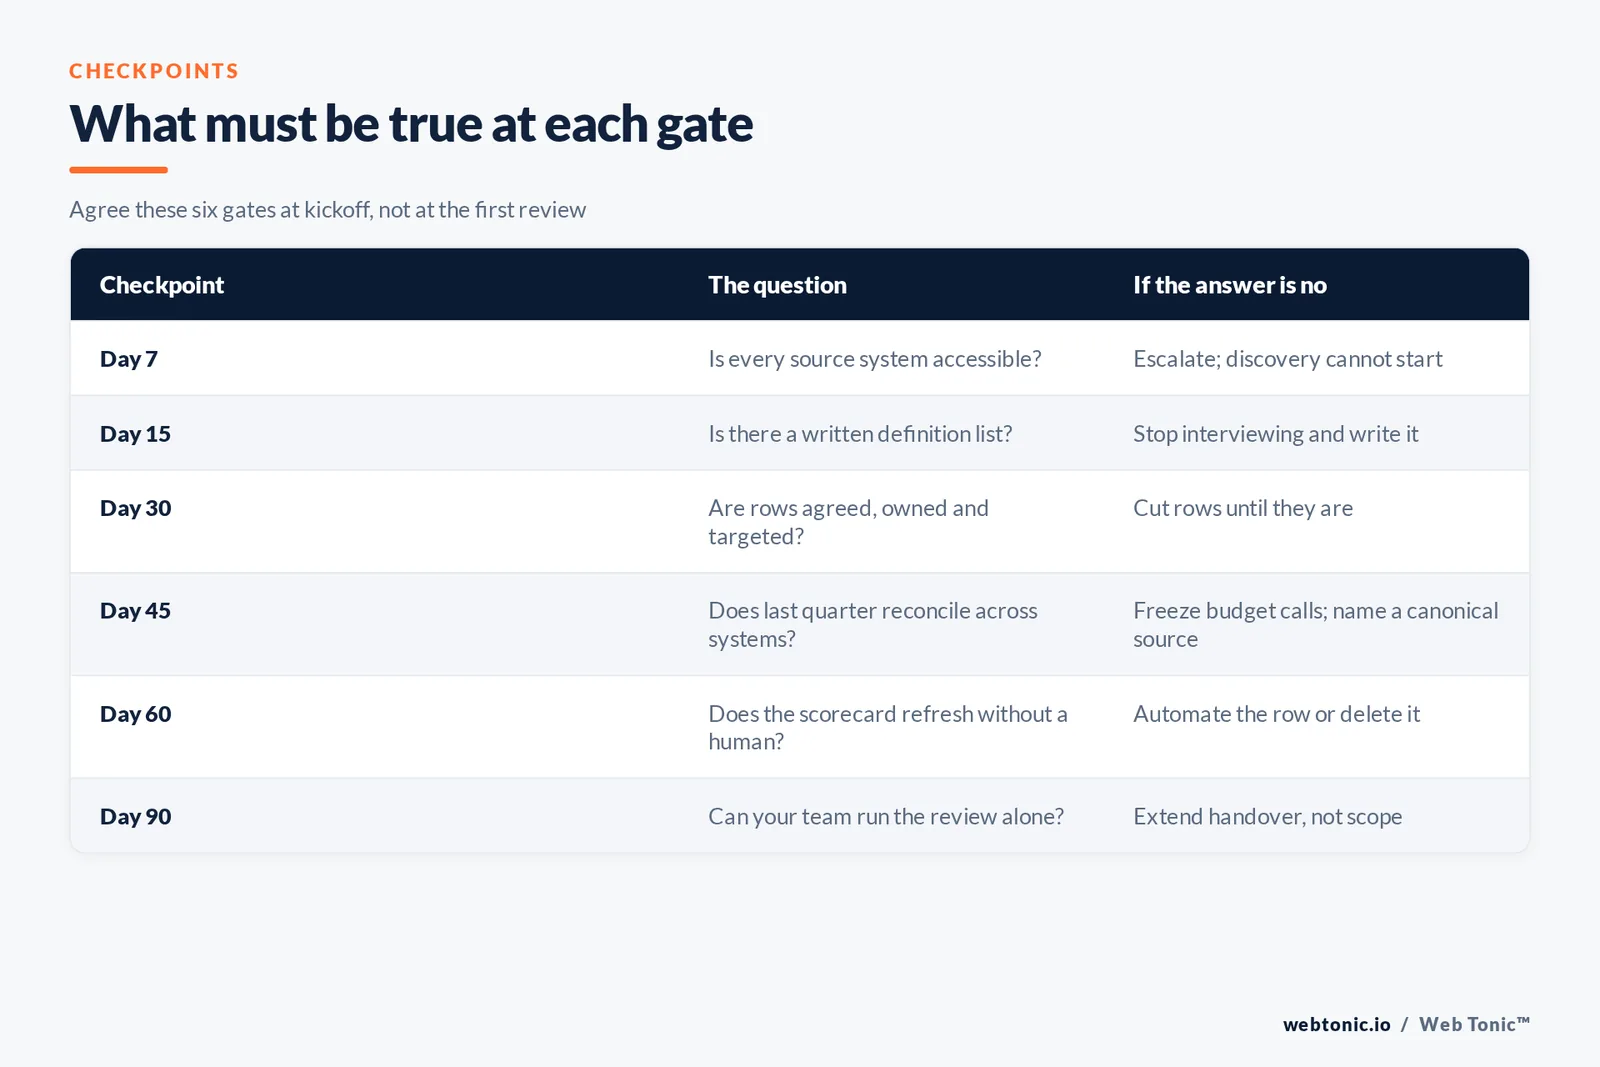
| Checkpoint | The question | If the answer is no |
|---|---|---|
| Day 7 | Is every source system accessible? | Escalate; discovery cannot start |
| Day 15 | Is there a written definition list? | Stop interviewing and write it |
| Day 30 | Are the rows agreed, owned and targeted? | Cut rows until they are |
| Day 45 | Does last quarter reconcile across systems? | Freeze budget decisions; name canonical source |
| Day 60 | Does the scorecard refresh without a human? | Automate or delete the row |
| Day 90 | Can your team run the review alone? | Extend handover, not scope |
Days 45–60: automate, or the scorecard dies
Any row that needs a human to assemble it will be late, then estimated, then quietly dropped. So the second half of the build is production engineering: scheduled pulls, one transformation layer, a single refresh time, and an alert when a source fails silently.
The prize is measurable. One time audit of lean marketing teams found 15% of the week — about 6 hours — going to report assembly, and reporting-load modelling puts manual work near 9 hours weekly across five accounts and 34 across twenty. Teams that fix the pipeline commonly drop from 15+ hours a week to under 2, per reporting automation case data. A useful post-build benchmark: a weekly report should take 60–90 minutes, and practitioner guidance treats 3–5 hours as a symptom.
Automation is also where cost lands, and it is worth sizing honestly. Published 2026 ranges put a single KPI dashboard at $3,000–$10,000 and a department-level BI implementation at $10,000–$35,000, per analytics pricing analysis. If the plumbing beneath your rows turns out to be the real project, that is operations work and it deserves its own scope rather than being smuggled into a 90-day scorecard build.
Days 60–90: the ritual, then the handover
Run the review weekly from day 60, in a fixed slot, with the same agenda: read the rows, flag off-track numbers, turn each red row into an issue with an owner and a date. Five minutes on numbers, the rest on decisions. Anything that becomes a discussion of whether the number is right goes straight back to the definition list — that is a defect, not an agenda item.
Expect to prune. By week ten most scorecards shed two or three rows that looked essential in month one and never once changed a decision. Deleting them is progress; carrying them is how you end up at forty rows.
Then hand it over properly. Documentation per row, a named owner for the data itself, a quarterly definitions review, and a decision log recording what changed on which number and when. The acceptance test is that the next review happens correctly with nobody from outside in the room. We treat that as the deliverable: a habit your team owns, not a file we handed you. A dashboard nobody can maintain is a subscription to dependence.
One caveat worth setting at kickoff: the scorecard will make some numbers look worse. Deduplication removes records, honest definitions demote soft conversions, and a channel that was inheriting credit loses it. That is the system working. Leaders who are not warned about this in week one tend to interpret it as the project failing in week eight. If the scorecard exposes strategic rather than mechanical problems, the follow-on is a growth advisory conversation, not more rows.
What sits outside the 90 days
Scope discipline is what makes the plan deliverable, so it is worth stating what a scorecard build deliberately does not include. It does not rebuild your CRM data model. It does not fix attribution across every channel. It does not replace the monthly report, and it does not resolve strategy disagreements that were never really about numbers.
Each of those is a legitimate project with its own budget and timeline. Published 2026 ranges put a department-level BI implementation at $10,000–$35,000 and a full attribution build considerably higher, which is why folding them into a 90-day engagement guarantees that neither lands. The blocked-row list is where they get recorded, sized and sequenced.
The one exception is hygiene work that a specific row depends on. If a scorecard row cannot exist without deduplicating a single object or fixing one broken sync, that fix belongs inside the build — narrowly, and named. The rule we apply is simple: hygiene work is in scope when it unblocks an agreed row, and out of scope when it is general improvement.
Quarter two is where the honest sequencing pays off. With definitions settled and production automated, the next quarter's projects can be prioritised against numbers you trust rather than against whoever argued most persuasively. That is usually the first time a leadership team can compare a measurement investment with a channel investment on the same terms.

Related reading
- Marketing Team Structure & Hiring Advisory: the first 90 days
- AI Marketing Advisory / AI Readiness: the first 90 days
- Board Advisory / Investor-Ready Growth Plan: the first 90 days
- Marketing Strategy Consulting services at Web Tonic
Frequently Asked Questions
What should exist by day 30?
A written definition list, an agreed set of five to fifteen rows with an owner and target each, and a contradiction log naming every metric that currently has more than one answer. No dashboard is required yet — building a presentation layer over unsettled definitions is the most common way these projects fail.
How soon can we make budget decisions off the scorecard?
After the baseline is reconciled and you have roughly three consecutive clean weeks of data, which usually means day 60 or later. Before that you are reading noise, and attribution gaps of the size published in 2026 benchmarks — around 38% signal loss — make early conclusions expensive.
Who should own the scorecard internally?
One person for the data itself, plus one owner per row. That combination is what survives a handover. With only 41% of organisations naming a data governance owner, appointing one during the first month is often the highest-value decision in the whole engagement.
What if some numbers cannot be produced honestly?
List them as blocked with the specific fix required and leave them off the scorecard until they can be produced. A short honest scorecard beats a complete dishonest one, and the blocked list becomes the scope of the following quarter.
Does this replace our monthly reporting?
No. The weekly scorecard carries a small set of leading indicators for decisions; the monthly report carries depth, narrative and channel detail for review. Trying to merge them produces a document that is too long to read weekly and too shallow to satisfy a monthly audience.
See how our KPI scorecard advisory runs its first 90 days, explore data intelligence and our services, read more on the blog, or book a scoping conversation.
Sources
EOS Worldwide FAQ · Validity State of CRM Data Management 2026 via PR Newswire · SyncGTM 2026 RevOps report (1,200+ companies) · Attrifast 2026 attribution benchmark report · Digital Applied multi-touch attribution statistics 2026 · Spike AI marketing time audit · Wevion reporting-hours analysis · MarketerHire reporting automation · Hurree weekly reporting guidance · X-Byte 2026 analytics pricing guide.


