



Table of contents
Loyalty programs are producing their best measured returns in years, but the industry's own 2026 data shows most of that value sits unclaimed. Average ROI has climbed for three straight years while roughly half of issued rewards still go unredeemed - the two facts describe the same market from opposite ends.
Key Takeaways
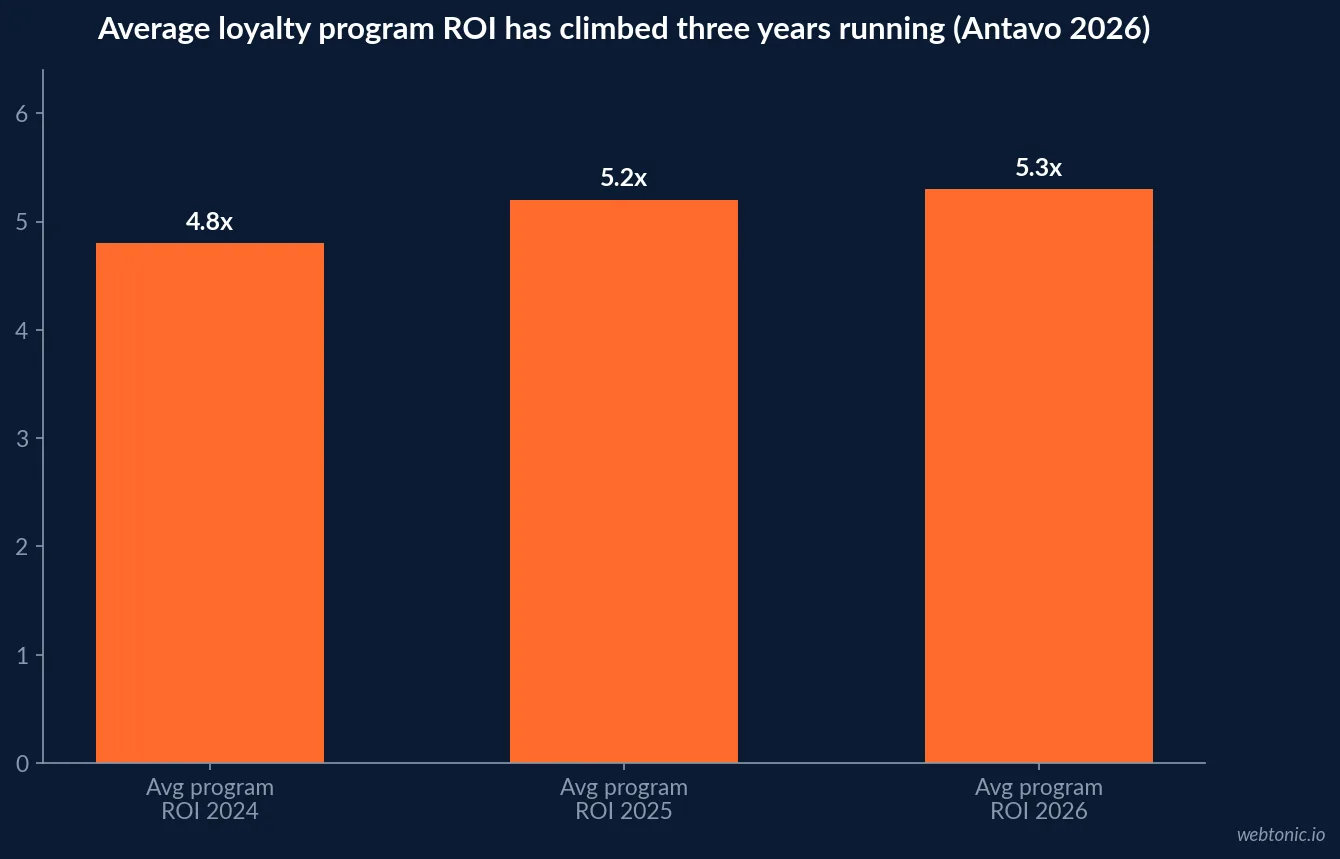
- Average loyalty program ROI reached 5.3x in 2026, up from 5.2x and 4.8x.
- 93% of programs that measure ROI report it is positive.
- Only 87% of program owners actually measure ROI.
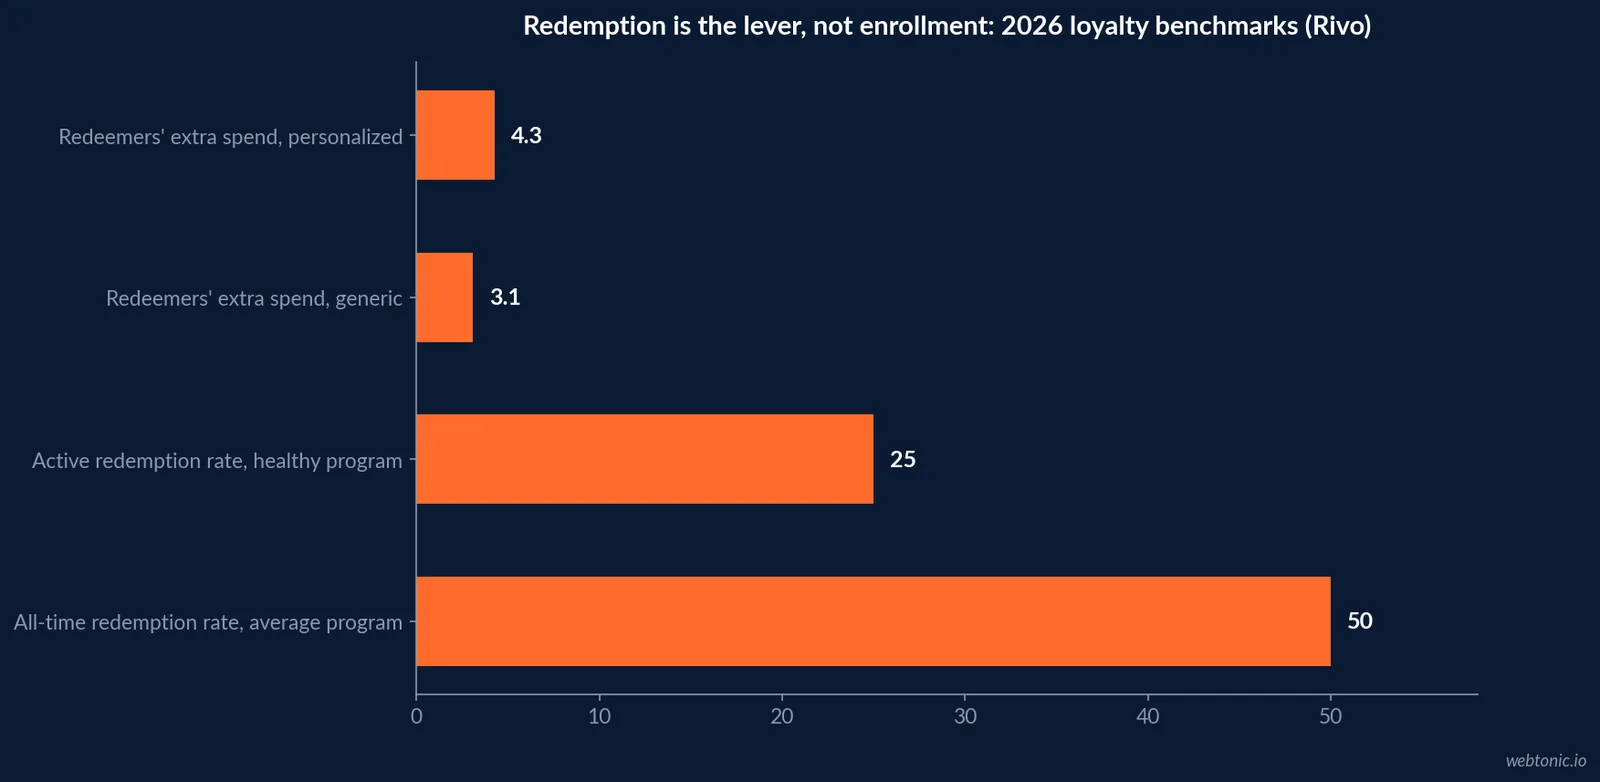
- 50% of issued loyalty rewards go unredeemed on average.
- Healthy programs see 20% to 30% active redemption.
- Redeemers of personalized rewards spend 4.3x more.
- Redeemers of generic rewards still spend 3.1x more.
- 73% of consumers actively look to redeem when given the option.
- 85% of consumers are more likely to keep buying from a loyalty brand.
- 73% of consumers spend more because of a loyalty program.
- Existing owners allocate 51.5% of marketing budget to CRM and loyalty.
- Brands still planning a program allocate only 42.5%, a 21.2-point gap.
- Access has out-ranked price as the top loyalty driver two years running.
- An estimated USD 94 billion in spend still moves between rival programs yearly.
- 43.2% of consumers say they are more likely to join a program than a year ago.
- 65.9% call using a loyalty program simply part of their life now.
- 78% of program owners say multiple reward types improve retention.
The ROI number everyone quotes, and its caveat
Antavo's 2026 Global Customer Loyalty Report, drawing on nearly 3,000 marketers and 10,000 consumers across 19 industries, puts average loyalty program ROI at 5.3x in 2026 - the third consecutive year of improvement after 4.8x and 5.2x. Read the number with its qualifier attached: 87% of owners measure ROI at all, and among that measuring group, 93% report the figure is positive. The 13% of owners not measuring anything are the ones most likely repeating the mistake this article is written to prevent.
The 2026 EY Loyalty Market Study, now in its third edition and surveying more than 1,400 consumers and 300 corporate loyalty leaders, reaches a similar headline: programs perform well by traditional measures, even as EY flags a widening gap between what brands can measure and what customers actually feel.
| ROI signal (2026) | Figure | Source | What it measures |
|---|---|---|---|
| Average program ROI | 5.3x | Antavo Global Customer Loyalty Report | Return across 19 industries |
| Prior-year ROI | 5.2x | Antavo | One year of prior climb |
| ROI two years prior | 4.8x | Antavo | Baseline before the current run |
| Owners who measure ROI | 87% | Antavo | Share tracking against a baseline |
| Of those, ROI positive | 93% | Antavo | Confirms value only among trackers |
Why enrollment is the wrong number to defend a budget with
Rivo's 2026 redemption benchmark set reports that 50% of issued loyalty rewards go unredeemed on average - not a minor inefficiency, but the baseline. Rivo's more useful comparison point is that healthy, well-run programs see 20% to 30% active redemption among currently active members within a measurement period, which is the figure to benchmark a live program against rather than the 50% all-time average.
Redemption also correlates directly with spend: Rivo finds redeemers spend 3.1x more than non-redeemers, and that rises to 4.3x when the reward is personalized rather than generic. 73% of consumers actively look to redeem when given the chance - the friction is usually in the program design, not customer intent.
| Redemption metric (2026) | Figure | Source | How to use it |
|---|---|---|---|
| All-time redemption rate, average program | 50% | Rivo (via Umbrex) | The floor, not a target |
| Active redemption, healthy program | 20-30% | Rivo (via Envive) | Benchmark a live program here |
| Extra spend from redeemers, generic reward | 3.1x | Rivo | Redemption's baseline lift |
| Extra spend from redeemers, personalized reward | 4.3x | Rivo | The upside of segmentation |
| Consumers who actively seek to redeem | 73% | Rivo | Demand exists; friction is the block |
What the budget line actually looks like
Antavo's 2026 data shows brands are not treating loyalty as a side experiment. Existing program owners allocate 51.5% of their marketing budget to CRM and loyalty combined, against 42.5% among brands still planning to launch one - a 21.2-point gap. That gap is a competitive signal as much as a budget fact: once a program exists, it tends to absorb the majority of the retention budget rather than compete for scraps of it.
Statista's 2026 CRM-and-loyalty budget tracking corroborates the direction, reporting that the share of marketing budget dedicated to loyalty program management increased year over year, with airline and luxury sector owners reporting the highest reliance on marketing funds for loyalty spend.
| Budget allocation fact (2026) | Figure | Source | Reading it |
|---|---|---|---|
| CRM + loyalty share, existing owners | 51.5% | Antavo Global Customer Loyalty Report | Loyalty is now the primary retention line |
| CRM + loyalty share, planning to launch | 42.5% | Antavo | Still meaningful, but behind |
| Gap between the two cohorts | 21.2 points | Antavo | Cost of staying undecided |
| Airline/luxury sectors, loyalty share of budget | Above cross-sector average | Statista 2026 | Sector where loyalty is most central |
What actually keeps a member engaged
Bond's 2026 Loyalty Report, produced with Visa and now in its 16th year, finds Access - first looks, early drops, front-of-line treatment has held the top spot as the leading loyalty driver in both 2025 and 2026, ahead of straightforward discounting. 85% of consumers say they are more likely to keep buying from a brand with a program, and 73% say they spend more as a result. Bond estimates roughly USD 94 billion in annual consumer spend is still moving between competing programs each year across retail, quick-service, fuel, convenience, telco and media.
Bond also draws a distinction worth carrying into any program review: 'artificial loyalty' built purely on automated personalization drives short-term engagement, while 'emotional loyalty' - built on recognition and human-feeling service - is what protects a program when a rival launches a richer points structure.
Consumer appetite is not the constraint
Antavo's consumer panel shows demand is rising, not saturating: 43.2% of consumers say they are more likely to join a loyalty program now than a year ago, and 65.9% describe using a loyalty program as simply part of their routine rather than a deliberate choice. 78% of program owners report that offering multiple reward types - not just points - measurably improves retention and satisfaction.
The constraint, per every source in this roundup, sits on the operator side: measurement, redemption design and budget discipline, not consumer willingness to participate.
| Consumer demand signal (2026) | Figure | Source |
|---|---|---|
| More likely to join a program than a year ago | 43.2% | Antavo Global Customer Loyalty Report |
| Consider using a loyalty program 'just part of life' | 65.9% | Antavo |
| More likely to keep buying from a loyalty brand | 85% | Bond Loyalty Report 2026 |
| Spend more because of a loyalty program | 73% | Bond Loyalty Report 2026 |
| Owners reporting multiple reward types help retention | 78% | Rivo |
Where AI has actually landed inside loyalty
Antavo's 2026 trend data shows AI moving from pilot to default: 51.4% of marketers now use AI in loyalty program management, up sharply from 37.1% a year earlier, and 50.9% of program owners say they are already offering AI-driven personalization. Antavo also reports that 83% of marketers are satisfied with their loyalty program's performance - the highest reading the report has tracked. The EY 2026 Loyalty Market Study corroborates the shift, describing AI as moving "from experimentation" into embedded, day-to-day program operations rather than a bolt-on feature.
The catch is budget discipline, not appetite: adding AI personalization on top of an unmeasured redemption process just automates the same 50% leakage faster. Fix measurement first, then layer AI on top of a program that already knows its own numbers.
| AI adoption signal (2026) | Figure | Source |
|---|---|---|
| Marketers using AI in loyalty management | 51.4% | Antavo Global Customer Loyalty Report 2026 |
| Same figure, prior year | 37.1% | Antavo |
| Owners offering AI-driven personalization | 50.9% | Antavo |
| Marketers satisfied with program performance | 83% | Antavo |
Where loyalty actually breaks: churn and wallet share
The upbeat ROI numbers sit beside a harder trend. The EY 2026 Loyalty Market Study reports that over a quarter of organizations now see annual churn of 30% or higher, up from 18% the year before - even as headline business metrics keep improving. Numerator's 2026 retail loyalty analysis, tracking real consumer purchase data, found that eight of the top ten US retailers saw declines in share of wallet over the past year, including retailers that were simultaneously growing in households, trips and total sales.
Antavo's underlying data explains part of the mechanism: 74% of customers quietly go dormant within two months of their last interaction rather than formally opting out, and only 3.4% ever cancel outright. Upside's loyalty-plateau research adds that a large share of issued program value simply sits unused in the average consumer's wallet - the same redemption gap this page opened with, now visible at the portfolio level across an entire retailer's customer base.
| Churn and wallet-share signal (2026) | Figure | Source |
|---|---|---|
| Organizations with 30%+ annual churn | Over 25% | EY 2026 Loyalty Market Study |
| Same figure, prior year | 18% | EY |
| Top-10 US retailers losing wallet share | 8 of 10 | Numerator 2026 |
| Customers who quietly go dormant within 2 months | 74% | Antavo |
| Customers who formally opt out or cancel | 3.4% | Antavo |
How to read your own program against this data
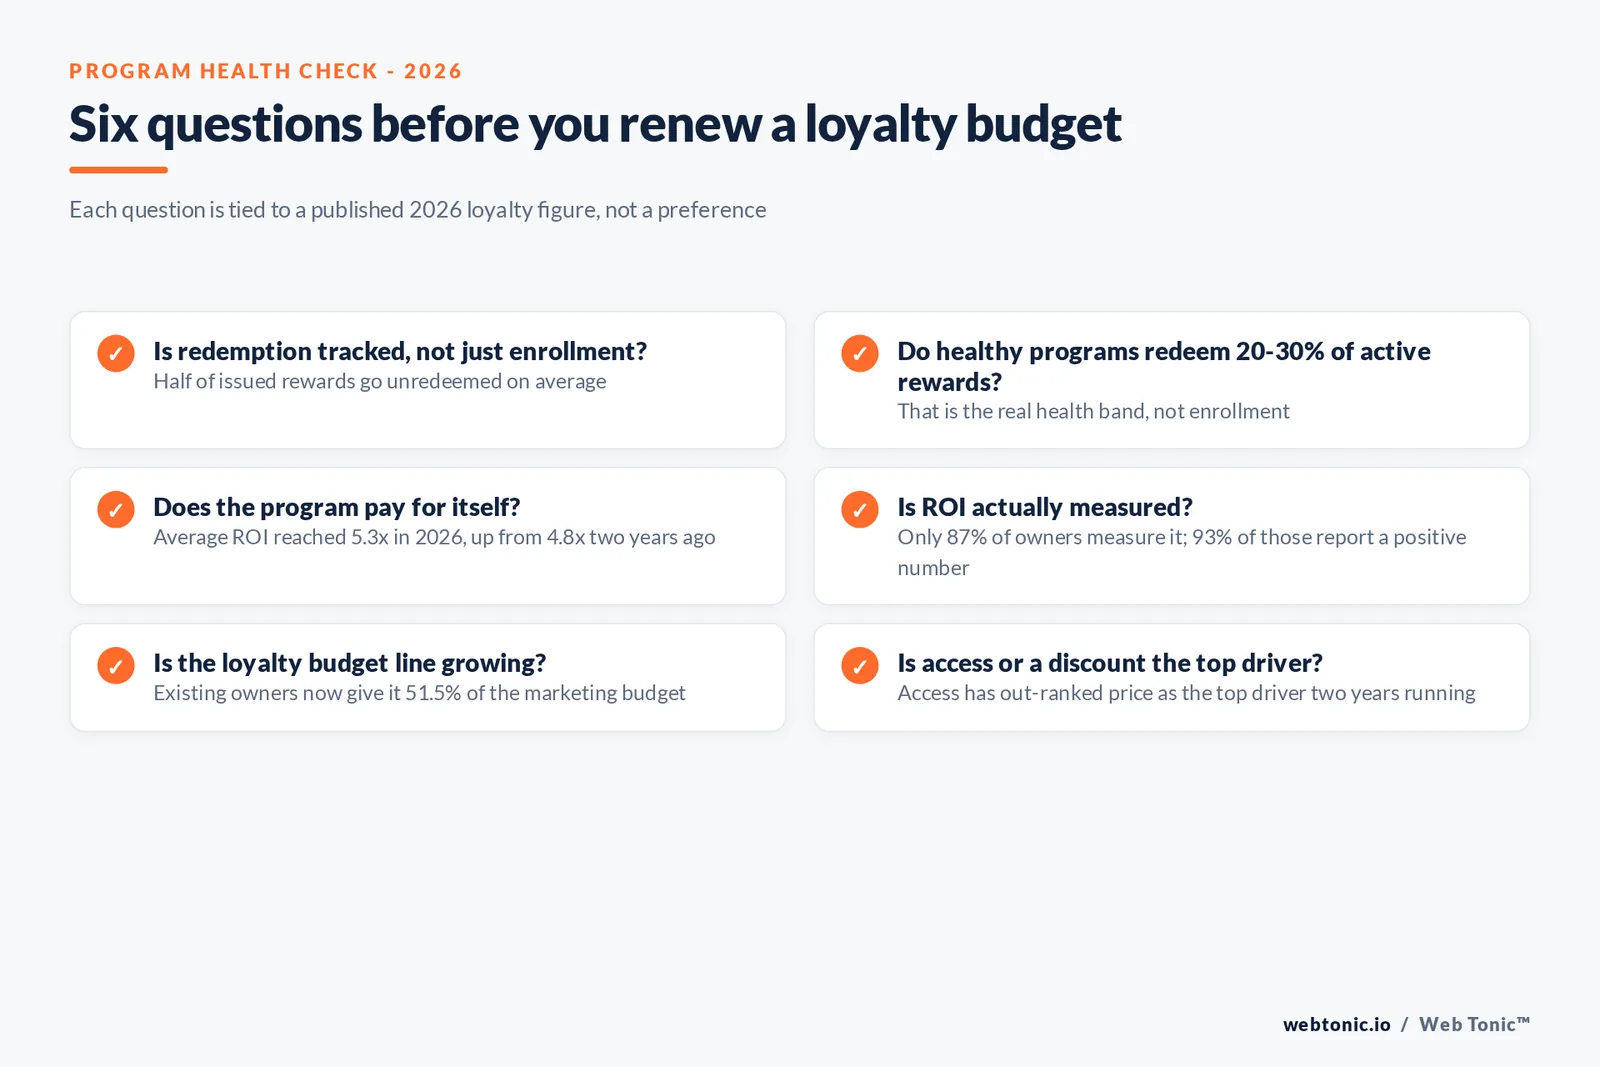
Start with redemption, not sign-ups: if active redemption sits under 20%, the program is issuing liability faster than it is building preference. Next, check whether ROI is measured at all - the gap between the 87% who track it and the 13% who do not is exactly where budget gets wasted without anyone noticing. Then compare your CRM-and-loyalty budget share against the 51.5% benchmark for programs that already exist; a program funded well below that share is competing for attention against acquisition spend it should not have to fight.
If the numbers above suggest your program's economics need a rebuild rather than a redesign, our growth marketing practice models retention economics alongside acquisition, and our data and analytics team can instrument redemption and ROI tracking before the next budget cycle. You can also talk to us about where a loyalty rebuild fits against your paid channels, or read our take on when paid acquisition is worth the spend before reallocating a retention budget toward it.
Frequently Asked Questions
Are loyalty programs still effective in 2026?
By the measures brands track, yes and increasingly so. Antavo's 2026 Global Customer Loyalty Report, surveying nearly 3,000 marketers and 10,000 consumers, puts average program ROI at 5.3x, up from 5.2x in 2025 and 4.8x two years before that - three straight years of improvement. Bond's 2026 report adds that 85% of consumers say they are more likely to keep doing business with a brand that runs one, and 73% say they spend more as a result. The honest caveat is that ROI figures come from the 87% of owners who measure it; among those, 93% report a positive number, which is a narrower claim than 'loyalty works for everyone'.
What is a normal redemption rate?
Roughly half of all issued rewards go unredeemed across the average program, per Rivo's 2026 benchmark set. That is not the target - it is the baseline. Rivo reports healthy, well-run programs converting 20% to 30% of active members' rewards in any given period, which is the number to compare a program against, not the 50% all-time figure. A program stuck near or below that baseline is issuing liability, not building preference.
How much of the marketing budget should loyalty and CRM get?
Antavo's 2026 data puts existing program owners at 51.5% of their marketing budget allocated to CRM and loyalty, against 42.5% for brands still planning to launch one - a 21.2-point gap. That budget split is itself a signal: brands that already have a program are institutionalizing it as the primary retention channel, not treating it as a side project competing with acquisition spend.
What actually drives loyalty besides discounts?
Access. Bond's 2026 report finds Access - first looks, early drops, front-of-line treatment - has held the top spot as the leading loyalty driver in both 2025 and 2026, ahead of pure price value. Bond also estimates roughly USD 94 billion in annual consumer spend is still moving between competing programs each year, concentrated among brands that deliver recognition rather than only rewards.
What does a weak loyalty program look like on paper?
Enrollment keeps growing while active redemption stays flat or falls, and the program cannot report ROI because nobody is tracking it against a control group. Antavo's data shows measurement itself is a differentiator: 87% of owners measure ROI, and it is disproportionately the measuring cohort reporting the 5.3x average. A program with high sign-ups and no redemption data is a cost center wearing a loyalty program's name.
Sources
Antavo - Global Customer Loyalty Report 2026 findings
EY - 2026 Loyalty Market Study
Bond - The 2026 Bond Loyalty Report, with Visa
Rivo - Points program redemption rate: industry benchmarks
Open Loyalty - Loyalty Program Benchmark Report 2026
EY - 2026 Loyalty Market Study, full report PDF
Antavo - Loyalty Program Trends: Global Customer Loyalty Report 2026
Numerator - Save, Switch, Repeat: What Retailers Need to Know About Loyalty in 2026
Upside - The loyalty plateau and how to rise above it


