



Table of contents
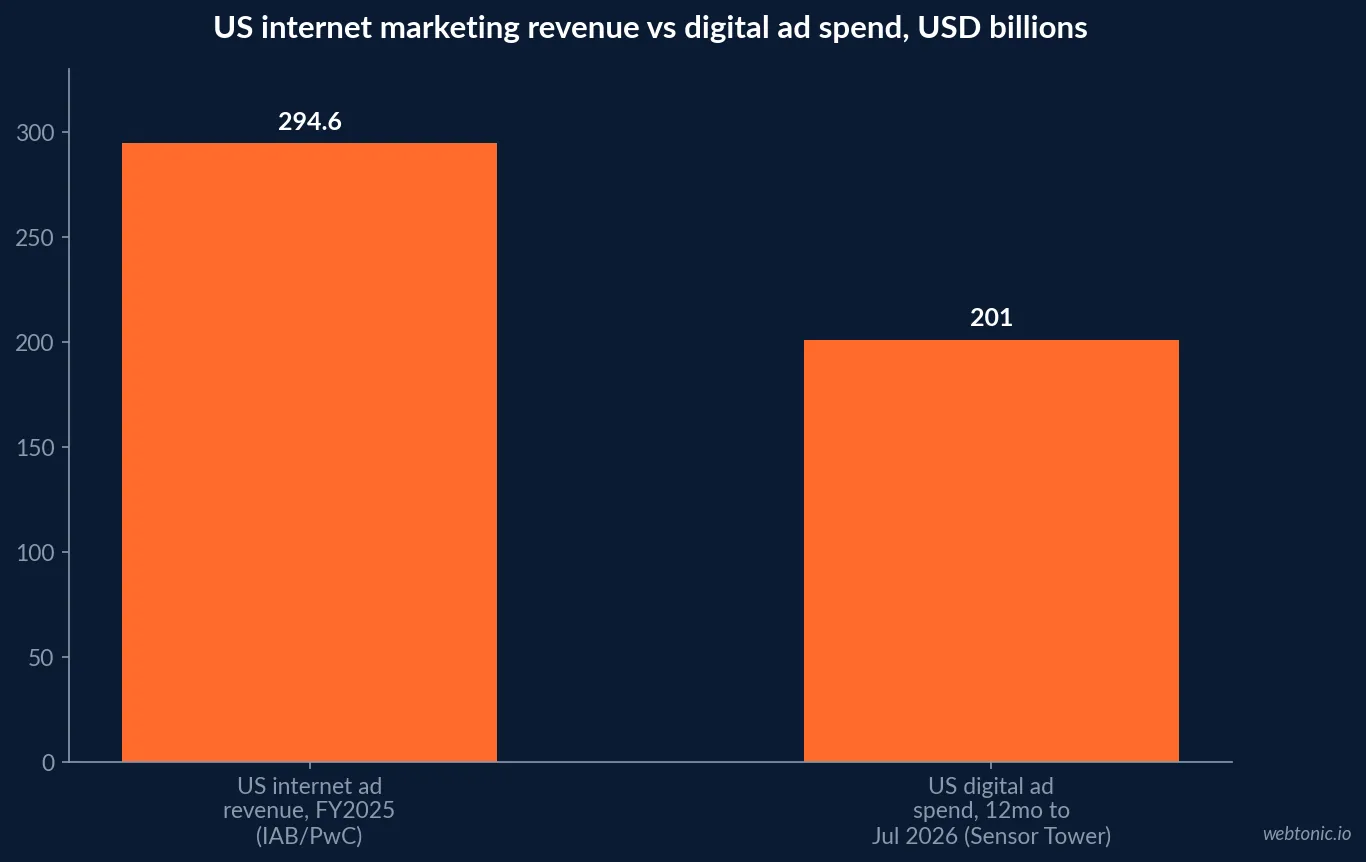
US internet advertising revenue reached USD 294.6 billion in 2025, up 13.9% year on year, and the channels carrying that growth are not the ones getting the most attention. This page reads the 2026 ad-spend and ROI data from IAB/PwC, dentsu, Sensor Tower and HubSpot together, rather than as separate press releases, to see where the money and the return actually overlap.
Key Takeaways
- US internet ad revenue hit USD 294.6 billion in 2025, up 13.9%.
- US digital ad spend reached USD 201 billion across the year to July 2026.
- That spend generated over 19 trillion ad impressions, up 7%.
- Facebook remains the single largest US ad channel at USD 42.9 billion.
- Global ad spend growth is forecast at 5.0% in 2026, easing from 5.8% in 2025.
- Digital holds a 69% share of ad spend across 56 tracked markets.
- 75% of ad spend is forecast to be algorithm-driven by 2028.
- Website, blog and SEO ranks first on reported ROI, at 30.2%.
- Email marketing follows at 23.6% reported ROI, paid social at 23.3%.
- Average email ROI is USD 36 for every dollar spent, per Litmus.
- 30% of marketers still call lead generation a top challenge.
- 55.7% say lead generation is easier than a decade ago.
- 93.8% say their lead quality improved over the past year.
- 29.2% of marketers cite lead volume as a key success metric.
- 33% call measuring marketing ROI their top roadblock.
How big internet marketing actually is right now
Two measurement methods, one direction. The IAB/PwC Internet Advertising Revenue Report, now in its 30th year, puts full-year 2025 US internet ad revenue at USD 294.6 billion, a 13.9% increase on 2024. Sensor Tower's rolling twelve-month window to July 2026 shows USD 201 billion in US digital ad spend, up 15% year on year, and over 19 trillion ad impressions, up 7%.
The two figures measure different windows and different scopes, which is why they do not match to the dollar. What matters for planning is that both point the same way: growth, not a plateau.
| Measure (2025-2026) | Figure | Change | Source |
|---|---|---|---|
| US internet ad revenue, full year 2025 | USD 294.6 billion | +13.9% YoY | IAB / PwC |
| US digital ad spend, 12 months to Jul 2026 | USD 201 billion | +15% YoY | Sensor Tower |
| US digital ad impressions, same window | 19 trillion+ | +7% YoY | Sensor Tower |
| Global ad spend growth forecast, 2026 | 5.0% | Down from 5.8% in 2025 | dentsu |
| Digital share of tracked global ad spend | 69% | Across 56 markets | dentsu |
Where the dollars are actually going
dentsu's mid-2026 forecast update, covering 56 markets, names retail media, connected TV and video, social and digital out-of-home as the fastest-growing formats, and projects that 75% of ad spend will be algorithm-driven by 2028. Sensor Tower's channel-level US data confirms the shift is not evenly spread: Facebook remains the single largest ad channel, generating USD 42.9 billion over the twelve months to July 2026, even as budget keeps rotating toward streaming and shopping formats.
Read plainly: the channel with the most spend is not the same as the channel with the most efficient spend, and the next two sections separate those two questions.
| Format / channel | 2025-2026 signal | Direction | Source |
|---|---|---|---|
| Retail media | Named a fastest-growing format | Rising | dentsu 2026 |
| Connected TV / video | Named a fastest-growing format | Rising | dentsu 2026 |
| Social | Named a fastest-growing format | Rising | dentsu 2026 |
| Digital out-of-home | Named a fastest-growing format | Rising | dentsu 2026 |
| Facebook (US) | USD 42.9 billion, 12-month spend | Largest single channel | Sensor Tower |
| Algorithm-driven buying | 75% of spend by 2028 (forecast) | Rising | dentsu 2026 |
What marketers say actually returns the most
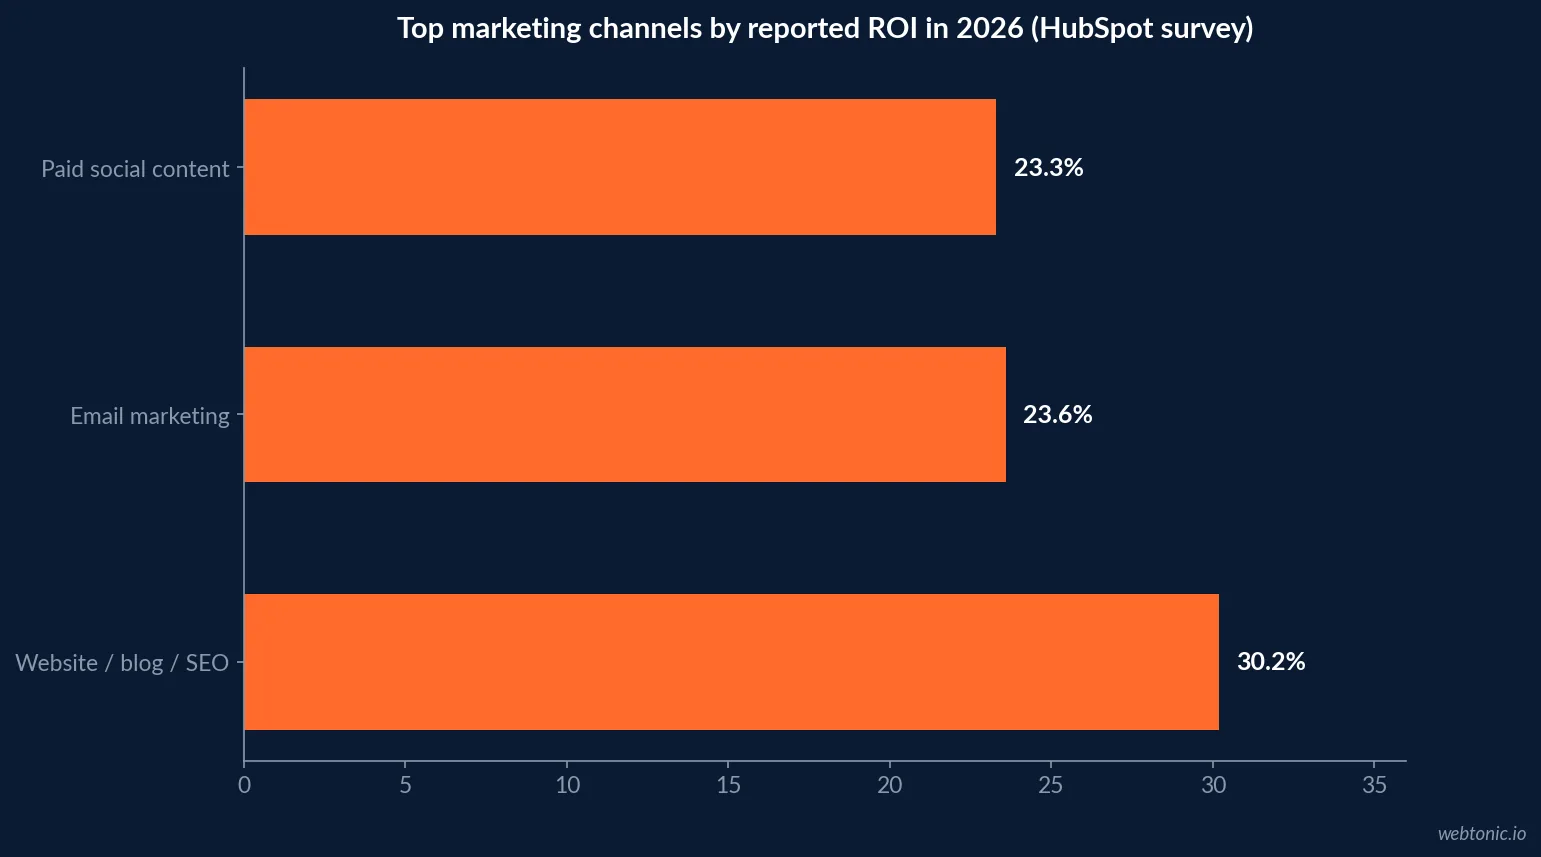
HubSpot's marketer survey asks a different question - not how much is spent, but how much return marketers report per channel. The result ranks website, blog and SEO first at 30.2%, ahead of email marketing at 23.6% and paid social content at 23.3%. None of the three top-ROI channels are the largest channel by raw spend.
Litmus puts a number on one of them: average email marketing ROI of USD 36 for every dollar spent, higher than any other channel it tracks, with top adopters of AI-assisted sending 75% more likely to clear a 45:1 return.
| Channel | Reported ROI rank (HubSpot) | Separate ROI figure | Source |
|---|---|---|---|
| Website / blog / SEO | 1st, 30.2% | - | HubSpot 2026 |
| Email marketing | 2nd, 23.6% | USD 36 per dollar spent | HubSpot 2026 / Litmus |
| Paid social content | 3rd, 23.3% | - | HubSpot 2026 |
| Organic social media | Ranks highly, below top 3 | - | HubSpot 2026 |
| Content marketing | Ranks highly, below top 3 | - | HubSpot 2026 |
The lead generation picture behind the spend
The spend numbers only matter if they turn into pipeline, and here the 2026 data is genuinely two-sided. HubSpot's trends report finds 30% of marketers still name lead generation a top challenge, but 55.7% say it is easier than a decade ago, 24.5% saw lead volume significantly increase in the past year, and 93.8% say the leads they get now are better quality.
That is not a contradiction. It reads as a market where the tools have gotten better at targeting and qualifying, while the underlying job - proving the return on that better lead flow - has gotten harder to defend in a budget meeting.
| Lead generation signal (2026) | Figure | What it means | Source |
|---|---|---|---|
| Marketers naming lead gen a top challenge | 30% | Still hard, not solved | HubSpot |
| Marketers saying lead gen is easier than a decade ago | 55.7% | Tools have improved | HubSpot |
| Marketers reporting lead volume significantly increased | 24.5% | Growth, not stagnation | HubSpot |
| Marketers reporting improved lead quality | 93.8% | Targeting is the real gain | HubSpot |
| Marketers citing lead volume as a key success metric | 29.2% | Volume still matters | HubSpot |
Why measurement is the roadblock, not the channels
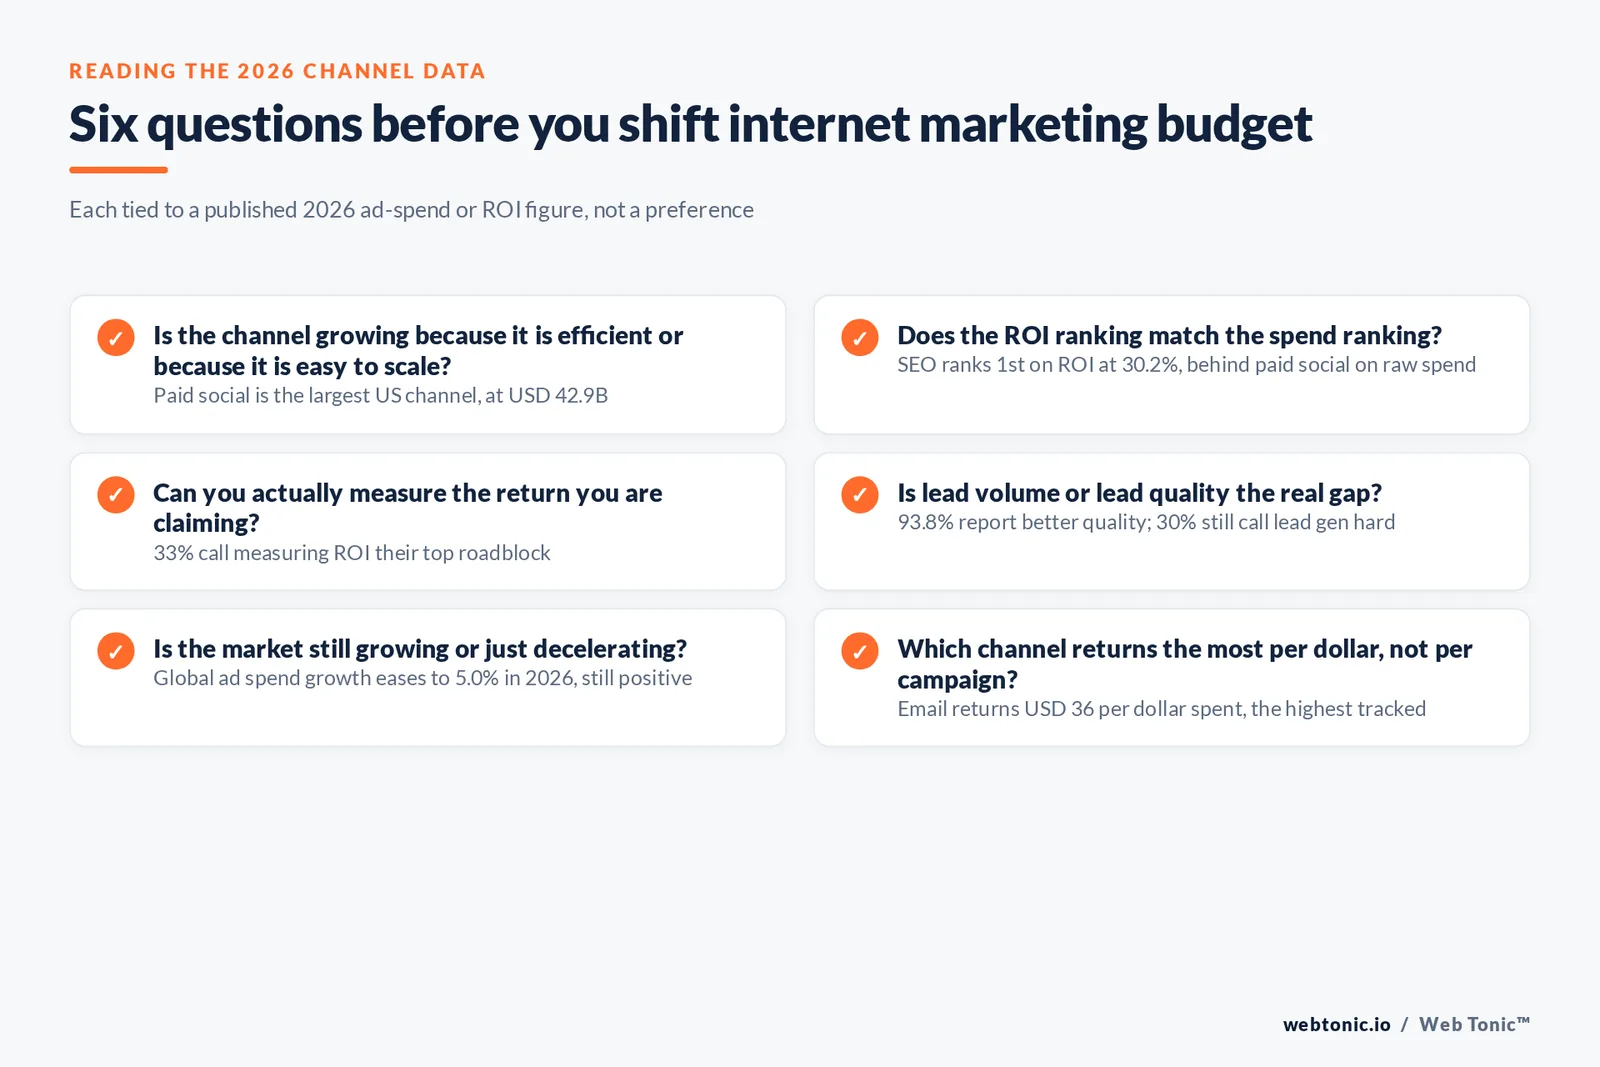
HubSpot's survey puts measuring marketing ROI at 33%, the single largest roadblock marketers report for 2026 - ahead of keeping up with platform changes (29.8%), generating leads (29.6%) and sales-marketing alignment (27.6%). That ordering matters: the channels above are not underperforming so much as under-measured, which is exactly why the ROI rankings in this piece disagree slightly depending on which survey asked the question.
A programme that cannot attribute a lead to a channel will always look like it needs more budget everywhere. Our data and analytics practice builds the attribution layer that turns this table from a survey result into an internal number you can defend.
What the growth rate is likely to do next
dentsu's own forecast is a deceleration, not a reversal: 5.0% global ad spend growth in 2026 and 5.5% in 2027, down from 5.8% in 2025, still running ahead of the International Monetary Fund's 3.1% global GDP growth forecast for 2026. Confidence from platform earnings at Alphabet, Amazon and Meta is offsetting caution from advertisers facing the same economic uncertainty.
A slowing growth rate off a larger base is still more absolute new dollars entering the channel mix than a faster rate off a smaller one - which is one reason the channel-level competition for that budget, not the macro number, is the more useful thing to track quarter to quarter.
| Forecast year | Global ad spend growth | vs global GDP growth | Source |
|---|---|---|---|
| 2025 (actual) | 5.8% | - | dentsu |
| 2026 (forecast) | 5.0% | 3.1% (IMF) | dentsu |
| 2027 (forecast) | 5.5% | - | dentsu |
| By 2028 (forecast) | 75% of spend algorithm-driven | - | dentsu |
How to read these numbers for one budget, not the whole market
Start from the ROI ranking, not the spend ranking. HubSpot's data says website, blog, SEO and email marketing return more per dollar reported than paid social, even though paid social and video carry a larger share of the market-wide spend covered by IAB and dentsu. A constrained budget should fund the channels at the top of the ROI table before it chases the channels at the top of the spend table.
Then fix the measurement gap HubSpot's own respondents flag as their top roadblock. Without it, every channel above will keep arguing for more budget using a number nobody can fully defend.
Where this fits with paid channels specifically
The internet-marketing numbers above are the macro read; the channel-level economics differ once you get into a specific platform's auction. If paid search or paid social is the channel being scaled off this data, see our breakdowns of what Google Ads actually costs and what Meta ads cost, or read our take on whether paid social is worth it for a given budget size before committing this year's increase to one channel.
Building a channel mix from this data
None of the reports above recommend a single channel mix, and that is deliberate - the right mix depends on which of these numbers your own funnel can actually verify. If the goal is a mix built on your own attribution rather than a survey average, talk to us, or see how our growth marketing practice and performance creative team plan channel allocation against measured return rather than reported ROI alone.
Frequently Asked Questions
How big is internet marketing in 2026?
IAB and PwC's Internet Advertising Revenue Report puts full-year 2025 US internet ad revenue at **USD 294.6 billion**, up **13.9%** year on year - the industry's 30th consecutive annual report. Sensor Tower separately tracked **USD 201 billion** in US digital ad spend across the twelve months to July 2026, a **15%** year-on-year rise, across roughly **19 trillion** ad impressions.
Which channel delivers the best marketing ROI in 2026?
HubSpot's marketer survey ranks **website, blog and SEO** first by reported ROI at **30.2%**, ahead of email marketing at **23.6%** and paid social content at **23.3%**. Litmus separately puts average email marketing ROI at **USD 36** returned per dollar spent, the highest of any channel it tracks - so the two studies rank channels differently depending on whether they ask about ROI as a rate or as a share of marketers reporting it.
Is lead generation getting easier or harder online?
Both, depending on which number you read. HubSpot found **30%** of marketers still name lead generation a top challenge, yet **55.7%** say it is easier to generate leads now than a decade ago and **93.8%** say the leads they do get are better quality than a year earlier. Easier does not mean solved; it means the tools have shifted the hard part from volume to targeting.
Where is ad spend actually growing fastest?
dentsu's mid-2026 forecast puts digital at a **69%** share of the USD 1.06 trillion in worldwide ad spend it tracks across 56 markets, with retail media, CTV, social and digital out-of-home named as the fastest-growing formats. Sensor Tower's US data shows Facebook still the single largest channel by dollars, at **USD 42.9 billion** over twelve months, even as budget keeps shifting toward newer formats.
Should a small budget follow the biggest channel or the highest ROI one?
The highest ROI one. The largest channel by spend, paid social, is large because it is easy to scale, not because it is the most efficient per dollar - HubSpot's own ranking puts it behind SEO and email on reported ROI. A constrained budget should buy into the channel that converts what traffic it already earns before it buys more traffic on a channel with a lower reported return.
Sources
IAB / PwC - Internet Advertising Revenue Report, Full Year 2025
dentsu - Global Ad Spend Forecasts, mid-2026 update
Sensor Tower - State of Digital Advertising 2026
HubSpot - The top marketing channels of 2026, according to marketers
HubSpot - 2026 state of marketing: data from 1,500+ global marketers
HubSpot - How successful marketing teams optimize performance in 2026
Litmus - Email Marketing ROI guide


