



Table of contents
US influencer marketing spend is projected to grow 15.7% in 2026 and reach USD 13.7 billion by 2027, and brands already allocate an average of 23% of total marketing budget to creator partnerships. The number a campaign manager actually needs is not the market size, though - it is the per-post rate by creator tier and the share of budget that history says pays back.
Key Takeaways
- US influencer spend is projected to grow 15.7% in 2026.
- It is forecast to reach USD 13.7 billion by 2027.
- Brands allocate an average of 23% of total marketing budget to creator partnerships.
- 74% of marketers plan to increase influencer budgets in 2026.
- 61% of programs still run below USD 250,000 a year.
- 16% of brands now run multi-million-dollar programs.
- Nano creator posts run USD 114 to 679.
- Micro creator posts run USD 899 to 1.5K.
- Mid-tier creator posts run USD 2.6K to 5.7K.
- Macro creator posts run USD 5.9K to 12.2K.
- Mega creator posts run USD 12.2K or more.
- Micro-creator cost per engagement runs USD 0.20 against USD 0.33 for macro.
- TikTok engagement runs 4.25% versus Instagram Reels at 1.23%.
- Long-term influencer ROI indexes at 151, versus 100 for the all-channel average.
- That is a 3.35x long-term multiplier, the highest of any channel the IPA measured.
- The IPA databank covers 220 campaigns across 144 brands and 36 sectors.
Build the number bottom-up, from creator tier
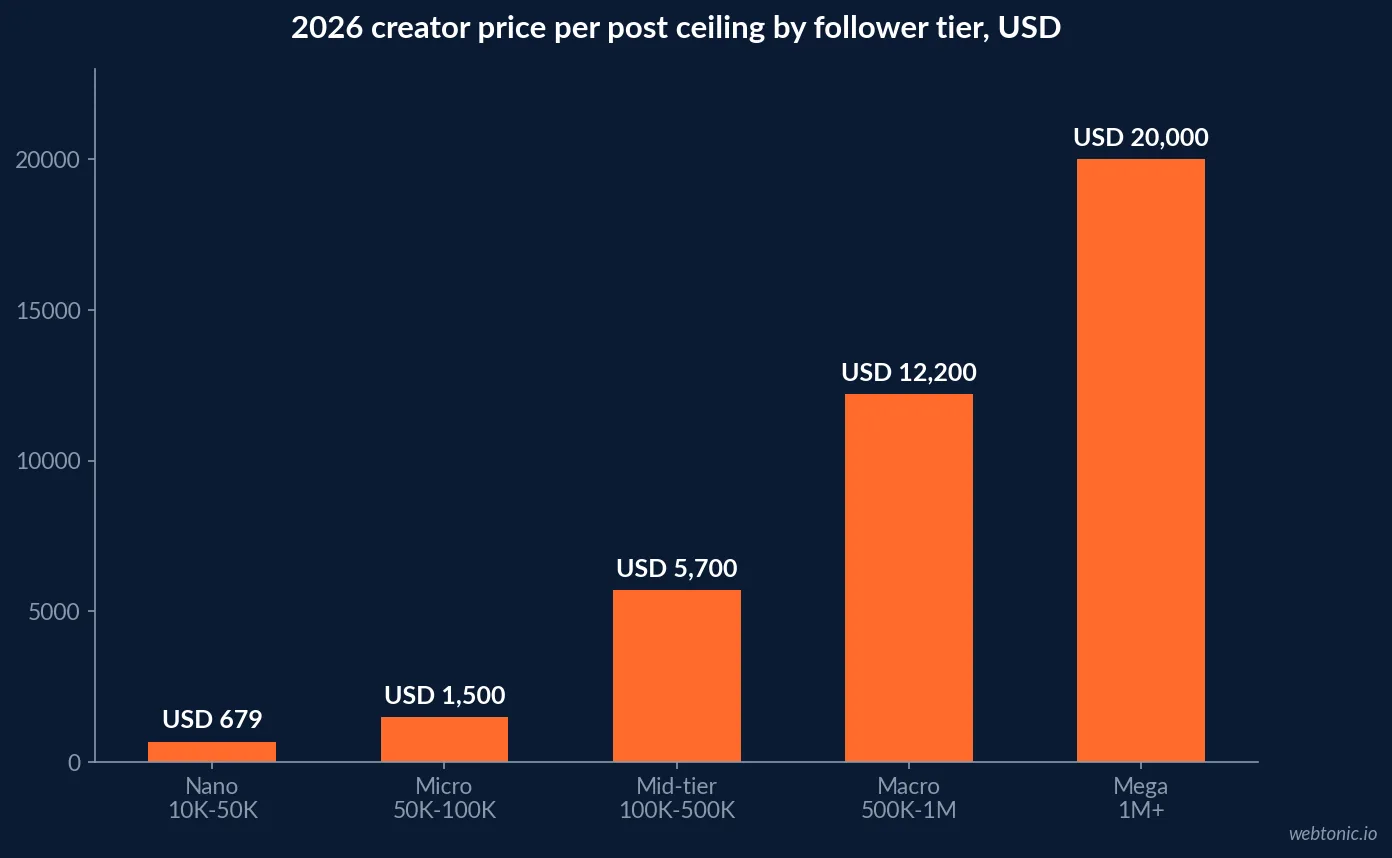
Market-size headlines do not tell a campaign manager what to put in a line-item budget. Creator-tier pricing does. Platform-wide pricing analysis of millions of creator profiles across Instagram, TikTok and YouTube gives a defensible starting range per post, before usage rights, exclusivity or content volume push the number higher.
| Creator tier | Follower range | Typical price per post (2026) | Best fit |
|---|---|---|---|
| Nano | 10K-50K | USD 114-679 | Volume testing, niche and local relevance |
| Micro | 50K-100K | USD 899-1.5K | Efficient reach, lower CPMs, creator polish |
| Mid-tier | 100K-500K | USD 2.6K-5.7K | Broader awareness, cross-channel programs |
| Macro | 500K-1M | USD 5.9K-12.2K | Major launches, stronger social proof |
| Mega | 1M+ | USD 12.2K+ | High-visibility, broad awareness partnerships |
What share of the marketing budget this should be
Brands allocated an average of 23% of total marketing budget to creator partnerships last year, and 74% of marketers plan to increase that share again in 2026, per Aspire's 2026 influencer marketing budget survey. Most programs are still modest in absolute terms: 61% of respondents run under USD 250,000 a year, while a notable 16% now manage multi-million-dollar programs, showing how wide the range is by company size and objective.
US influencer marketing spend overall is projected to grow 15.7% in 2026 and reach USD 13.7 billion by 2027, per the same report, which sizes the category as a genuine line item rather than a test budget.
| Budget benchmark (2026) | Figure | Source |
|---|---|---|
| Share of total marketing budget on creators | 23% average | Aspire 2026 budget survey |
| Marketers planning to increase influencer spend | 74% | Aspire 2026 budget survey |
| Programs under USD 250,000 a year | 61% of respondents | Aspire 2026 budget survey |
| Programs over USD 1 million a year | 16% of respondents | Aspire 2026 budget survey |
| US influencer spend growth, 2026 | 15.7% | Aspire 2026 budget survey |
| US influencer spend forecast, 2027 | USD 13.7 billion | Aspire 2026 budget survey |
Why the tier and platform mix change the cost-efficiency math
Cost per engagement, not cost per post, is the number that decides whether a tier is efficient. Benchmark data puts micro creators (10K-100K followers) at roughly USD 0.20 cost per engagement against USD 0.33 for macro creators. Platform matters just as much: TikTok engagement runs 4.25% against 1.23% for Instagram Reels in the same 2026 dataset, though platform choice should still follow where the target audience actually spends time, not the higher engagement number alone.
The ROI case: slow, but the strongest long-term channel measured
The strongest independent dataset on influencer ROI is not a headline multiple like "USD 5.20 back for every USD 1" - those figures rarely name their source or sample. The IPA Effectiveness Databank, built from 220 campaigns across 144 brands, 36 sectors and 28 markets covering more than GBP 133 million in disclosed influencer spend, found something more useful: influencer marketing scores roughly average on short-term ROI (index 99) but leads every channel measured on long-term ROI at index 151, a 3.35x long-term multiplier against paid social's 77.
The IPA also found no reliable correlation between spend level and ROI - what moved the outcome was brand-creator fit and creative quality, not budget size.
| ROI window (IPA Effectiveness Databank) | Influencer marketing index | Paid social index | All-channel average |
|---|---|---|---|
| Short-term ROI | 99 | N/A | 100 |
| Long-term ROI | 151 | 77 | 100 |
| Long-term ROI multiplier | 3.35x | Lower | 1.0x baseline |
The market sizing behind the budget line
Two market-size figures explain why influencer budgets keep climbing without pinning down a single "correct" total. MarketsandMarkets sizes the influencer marketing platform software market - the tools brands use to find and manage creators - at USD 1.15 billion in 2026, growing to USD 2.03 billion by 2031 at a 12.0% CAGR. That is a narrow, tooling-only figure. The Creator Economy's 2026 state-of-the-industry report puts the full creator economy - platforms, tools, agencies and creator income combined - at USD 250 billion to USD 480 billion globally, a wide range that reflects the absence of a standardized measurement framework, with growth moderating to a steadier 10-15% annually after the 2020-2023 boom.
The practical read for a campaign manager: budget against the creator-tier rate cards in the first table, not against either market-size figure - neither number tells you what a single post costs.
| Market-size figure (2026) | Scope | Value | Source |
|---|---|---|---|
| Influencer marketing platform software | Tooling only | USD 1.15 billion, to USD 2.03B by 2031 | MarketsandMarkets |
| Full creator economy | Platforms + tools + agencies + creator income | USD 250-480 billion | The Creator Economy 2026 report |
| Creator economy annual growth | Post-2023 moderation | 10-15% | The Creator Economy 2026 report |
Where creators actually earn engagement in 2026
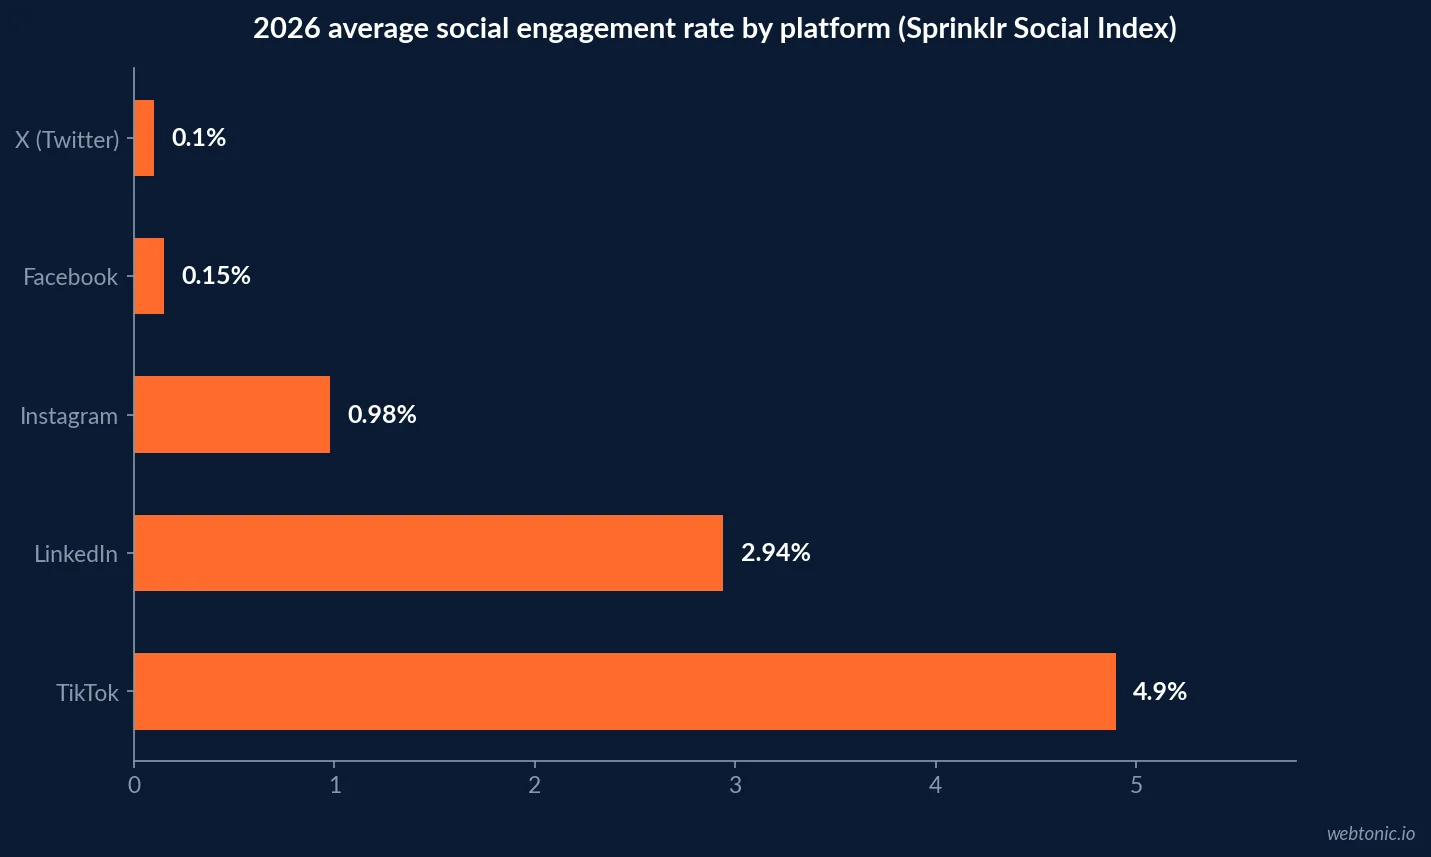
Platform choice inside a creator budget should follow where engagement is measurably higher, not where a brand already has the largest owned following. The 2026 Sprinklr Social Index Report puts average engagement rate at 4.9% on TikTok versus 2.94% on LinkedIn, 0.98% on Instagram, 0.15% on Facebook and 0.10% on X - a gap of roughly 5x between the top and bottom platform. TikTok's rate is up from 4.64% in 2025; Instagram's slipped slightly from 1.01%.
That does not mean every influencer budget should move to TikTok - it means a platform allocation decided by engagement data alone, without checking where the target audience actually watches, will systematically overweight TikTok relative to audience fit.
| Platform | Average engagement rate, 2026 | Year-over-year trend | Source |
|---|---|---|---|
| TikTok | 4.9% | Up from 4.64% in 2025 | Sprinklr 2026 Social Index Report |
| 2.94% | Up from 2.22% in 2024 | Sprinklr 2026 Social Index Report | |
| 0.98% | Down slightly from 1.01% in 2025 | Sprinklr 2026 Social Index Report | |
| 0.15% | Up 15% since 2023 | Sprinklr 2026 Social Index Report | |
| X (Twitter) | 0.10% | Down 29% since 2023 | Sprinklr 2026 Social Index Report |
How the budget should actually be split
Given the ROI pattern, a defensible 2026 allocation weights spend toward tiers and creators where brand fit is provable, not toward the largest reach number available. A practical split for a mid-size program: anchor spend in micro and mid-tier creators for cost-efficient, provable-fit reach, layer in a smaller number of macro or mega placements for awareness moments, and hold a testing reserve for nano-creator volume plays in niche segments.
Because long-term ROI outperforms short-term, plan the measurement window at 6-12 months, not the campaign's final week - judging influencer spend on a two-week conversion window under-counts most of its return.
| Program size | Suggested tier weighting | Measurement window | Primary goal |
|---|---|---|---|
| Under USD 250K/yr | Nano + micro heavy | 3-6 months | Cost-efficient reach and testing |
| USD 250K-1M/yr | Micro + mid-tier core, macro layer | 6-9 months | Reach with provable fit |
| Over USD 1M/yr | Mid-tier + macro core, mega for moments | 9-12 months | Awareness plus long-tail ROI |
Setting the number without overpaying
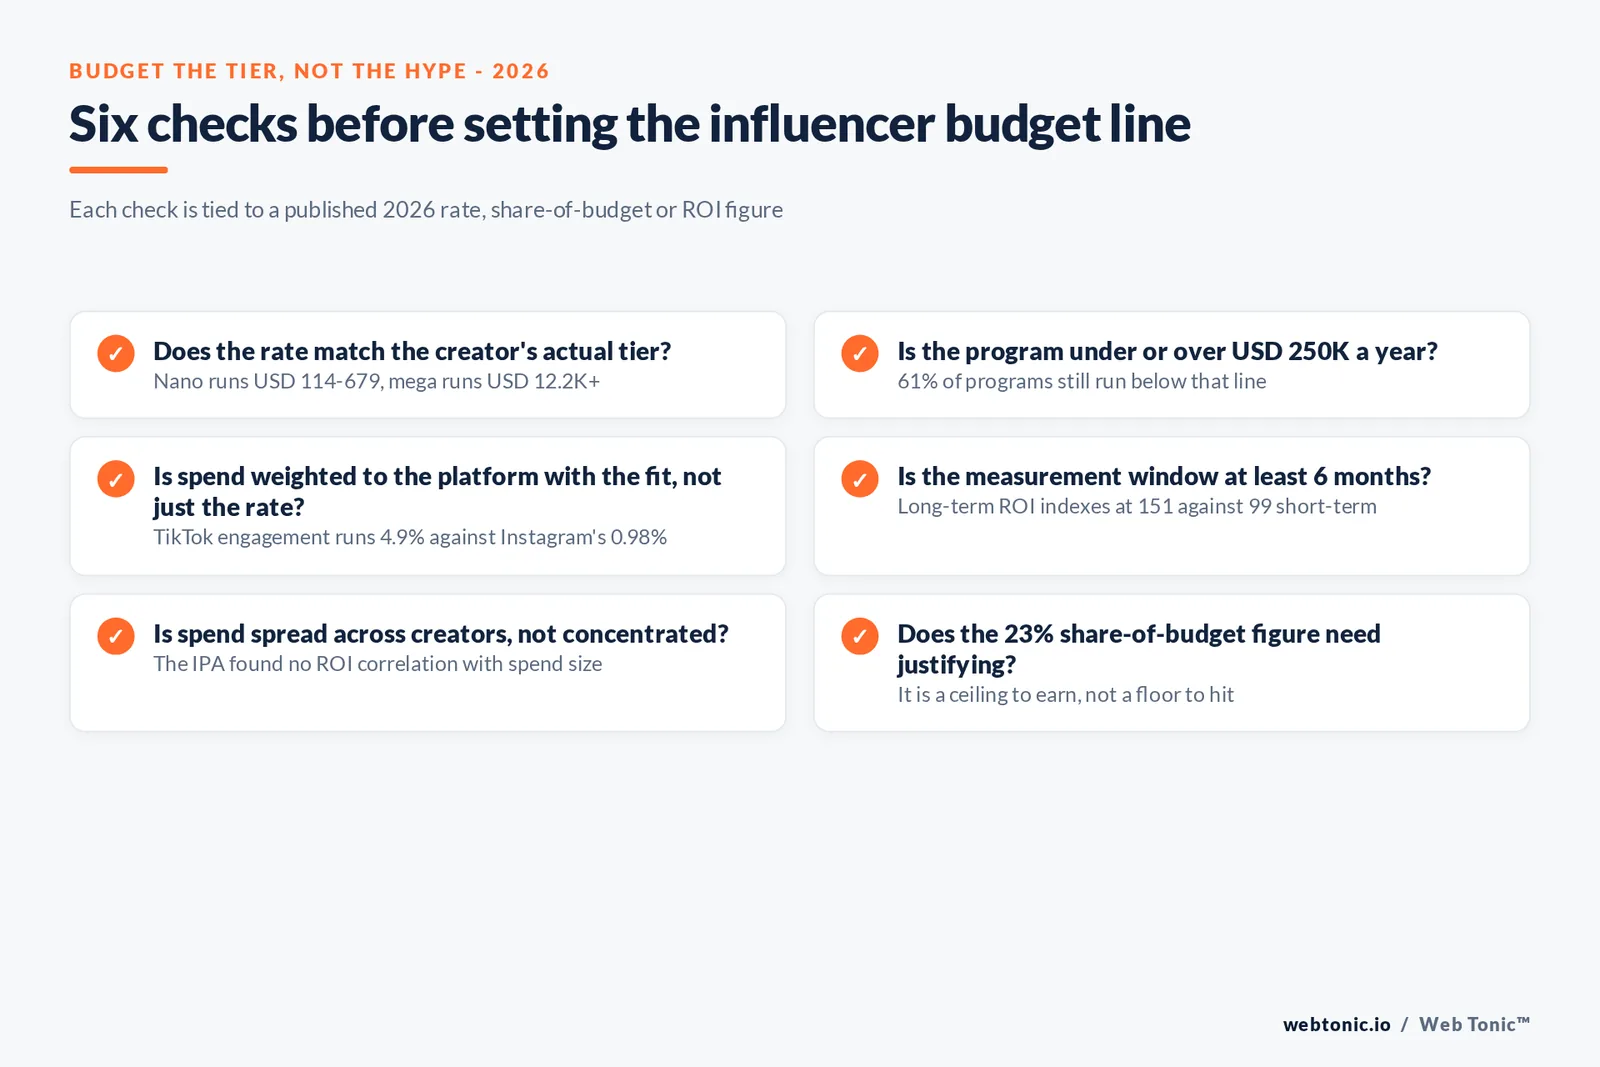
Anchor the per-post rate to the tier tables above, treat the 23% share-of-budget figure as a ceiling to justify rather than a floor to hit, and do not let a single macro or mega placement crowd out the micro and mid-tier volume that the IPA data says compounds over the long term. If a rate card quotes well above these ranges, ask what usage rights, exclusivity or paid amplification is bundled in - those terms, not the follower count, usually explain the premium.
Our growth marketing practice builds the tier mix and measurement window into the wider paid and organic plan rather than budgeting influencer spend in isolation. For the broader paid-media comparison, see our breakdown of whether paid social ads are worth the spend before you split budget between the two, or talk to us about building the tier mix into a wider paid and organic plan.
Frequently Asked Questions
How much should a campaign manager budget for influencer marketing in 2026?
Start from creator tier and campaign goal, not a single figure. Nano creators (10K-50K followers) run USD 114 to 679 per post, micro creators USD 899 to 1.5K, mid-tier USD 2.6K to 5.7K, macro USD 5.9K to 12.2K, and mega creators USD 12.2K or more, per platform-wide 2026 pricing data. Most programs still run under USD 250K a year; a notable 16% of brands now run multi-million-dollar programs.
What share of the marketing budget goes to influencer work?
Brands allocated an average of 23% of total marketing budget to creator partnerships last year, and 74% of marketers plan to increase influencer budgets in 2026, according to Aspire's budget survey. That sits inside, not beside, the roughly 10% median of marketing budget that CMOs report spending on social media overall.
Does influencer marketing actually pay back?
The IPA Effectiveness Databank, built from 220 campaigns across 144 brands and 36 sectors, found influencer marketing scores average (index 99) on short-term ROI but leads every channel measured on long-term ROI at index 151, a 3.35x long-term multiplier versus paid social's 77. It pays back slowly, and that patience is the format's real strength.
Does spending more guarantee a better return?
No. The IPA found no reliable correlation between spend level and ROI. What moved the outcome was the fit between brand and creator and the quality of the creative, not the size of the check. That argues for spreading budget across more well-matched creators rather than concentrating it in one large deal.
Which platform and creator tier gives the best cost efficiency?
By cost-per-engagement, micro creators (10K-100K followers) run roughly USD 0.20 versus USD 0.33 for macro creators, per 2026 benchmark data. By engagement rate, TikTok outperforms Instagram Reels, 4.25% versus 1.23% in the same dataset, though platform mix should still follow where the audience actually is.
Sources
Aspire - 2026 Influencer Marketing Budgets report
SocialPilot - 2026 Influencer Marketing ROI Benchmarks, citing the IPA Effectiveness Databank
Statista - Influencer marketing worldwide, statistics and facts
Statista - Global influencer advertising spending forecast
MarketsandMarkets - Influencer Marketing Platform Market report, 2026-2031
The Creator Economy - The State of the Creator Economy 2026
Sprinklr - 2026 Social Index Report, social media engagement benchmarks


