



Table of contents
Franchise Landing Page Statistics: Multi-Location Conversion Benchmarks for 2026
Fewer than 30% of franchise location pages rank in the local top-3 for their primary service term (AuthoritySpecialist, 2026). Here are the conversion and CRO benchmarks that matter for franchise brands.
Key Takeaways
- Fewer than 30% of franchise location pages rank top-3 in local pack results for their primary service term (AuthoritySpecialist, 41-brand study, 2026).
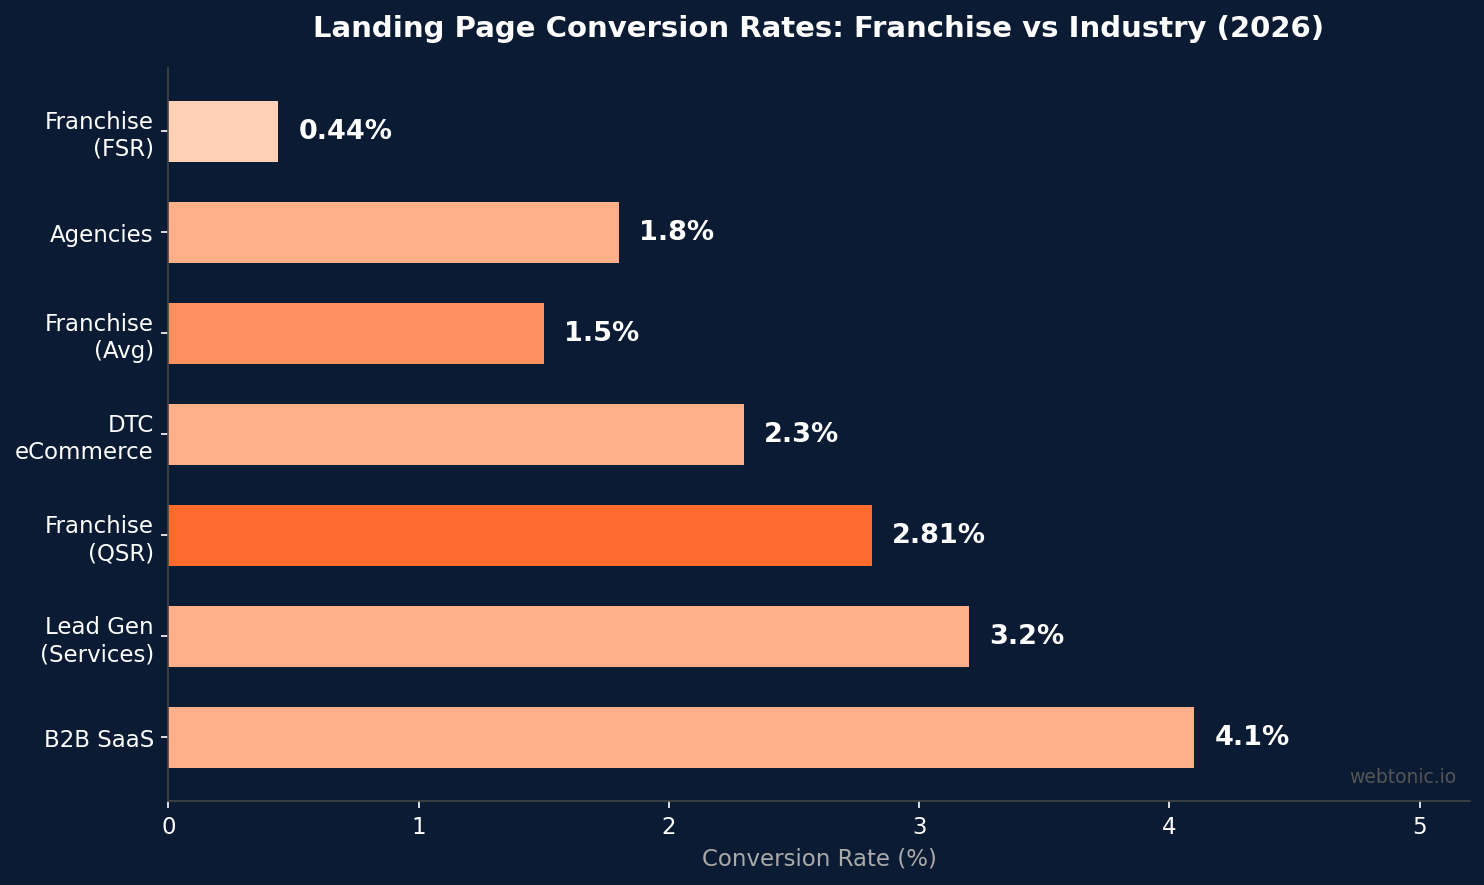
- B2B SaaS landing pages convert at a 4.1% median, while franchise landing pages range from 0.44% (full-service restaurants) to 2.81% (QSR) depending on vertical (DigitalApplied / FranConnect, 2026).
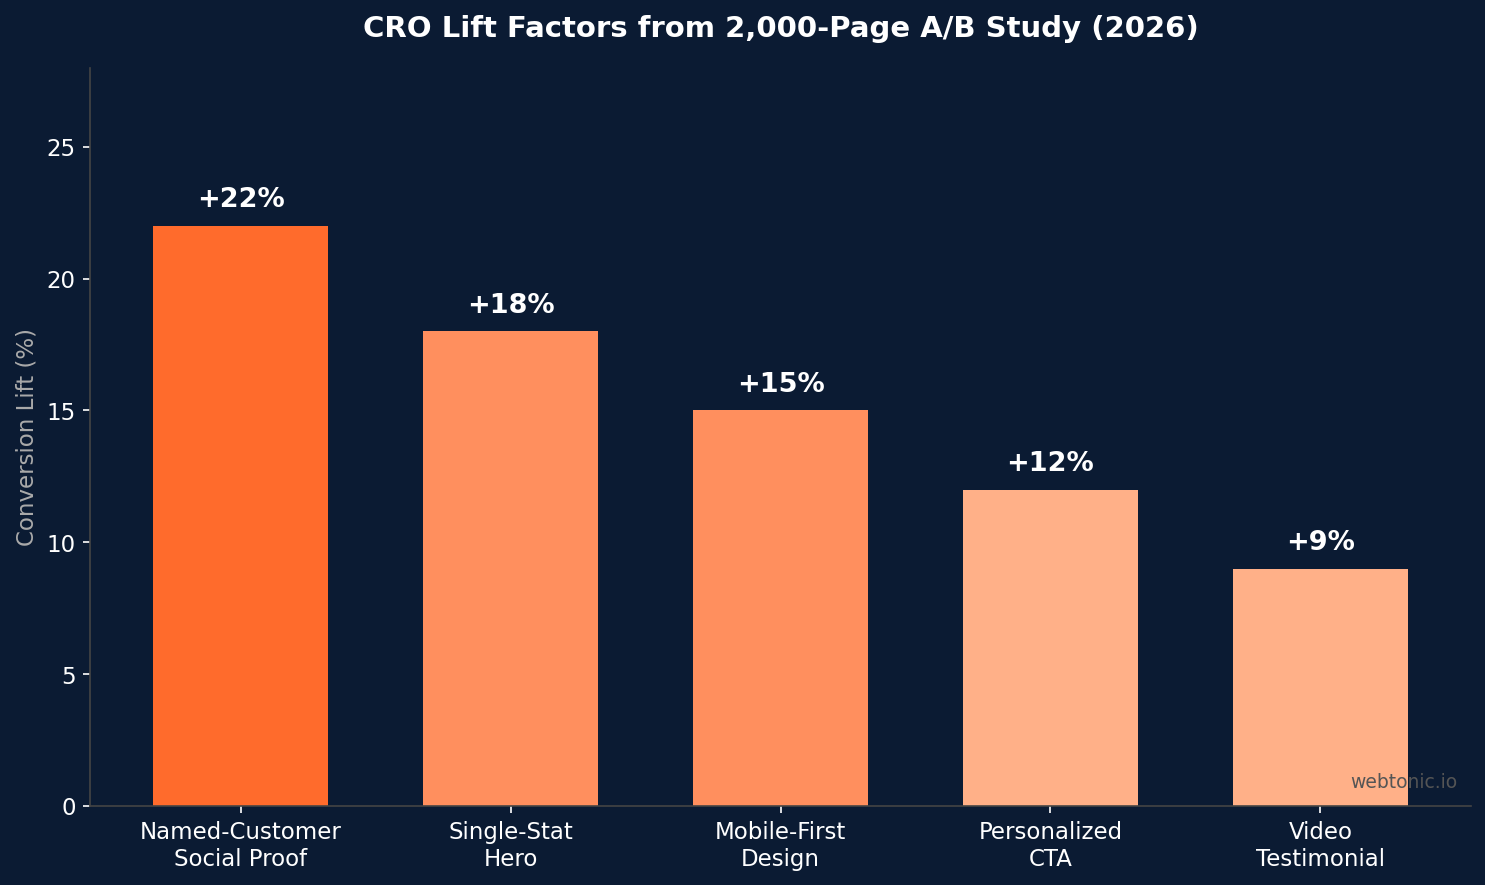
- Named-customer social proof lifts conversion by +22% — the highest single CRO factor in a 2,000-page A/B test study (DigitalApplied, 2026).
- Lead-to-agreement conversion doubled from 0.76% to 1.50% between 2023 and 2025, driven by landing page optimization and lead qualification (FranConnect Sales Index).
- Well-optimized franchise location pages reach 200–600 monthly organic sessions within 6–12 months in moderate-competition markets (AuthoritySpecialist).
- January 2026 recorded the highest franchise conversion rate of any month in the past two years, reflecting improved page quality and funnel optimization (Reshift Media).
Franchise Landing Page Conversion Benchmarks
Table 1 — Landing page conversion rates: franchise verticals vs cross-industry benchmarks (2025–2026)
| Segment | Median Conversion Rate | Source |
|---|---|---|
| B2B SaaS landing pages | 4.1% | DigitalApplied (n=620) |
| Lead-gen services | 3.2% | DigitalApplied (n=320) |
| Franchise — QSR | 2.81% | FranConnect 2025 |
| DTC eCommerce | 2.3% | DigitalApplied (n=480) |
| Franchise — Agencies | 1.8% | DigitalApplied |
| Franchise — Overall avg | 1.50% | FranConnect 2025 |
| Franchise — Personal services | 1.28% | FranConnect 2025 |
| Franchise — Full-service restaurants | 0.44% | FranConnect 2025 |
The 6.4x gap between QSR (2.81%) and full-service restaurant (0.44%) conversion rates underscores that franchise landing page performance is not a monolithic number. Each vertical has distinct consumer intent and decision complexity that shapes conversion behavior.
CRO and A/B Testing Data for Landing Pages
DigitalApplied's 2026 study of 2,000 A/B-tested landing pages (95% significance, minimum 1,000 sessions per variant) revealed the highest-impact conversion rate optimization factors:
- Named-customer social proof: +22% conversion lift — specific logos and customer names outperform generic testimonials. For franchise brands, this means featuring recognizable local businesses or community partners on location pages.
- Single-stat hero design: +18% lift — replacing image-heavy heroes with a single bold performance statistic drives higher engagement, especially on franchise development pages.
- Mobile-first design: +15% lift — pages designed mobile-first convert significantly better than desktop-adapted layouts, critical for franchise location pages where over 60% of traffic is mobile.
- Personalized CTAs: +12% lift — franchise location pages with geo-targeted calls-to-action (mentioning the specific city or neighborhood) outperform generic CTAs.
These findings apply directly to franchise performance creative strategies and multi-location landing page design.
One particularly notable finding from the study: AI-generated landing page copy underperformed human-written copy for DTC eCommerce by 11% on conversion rate. For franchise brands, where brand voice consistency and local authenticity matter, this reinforces the case for human-reviewed landing page content even when AI tools assist with initial drafts. The pages that performed best combined data-driven structure (which elements to include, what order) with human-crafted messaging tailored to the local audience.
The conversion rate gap between the top and bottom quartile of franchise landing pages is 5.8x — meaning the best franchise landing pages convert nearly six times more efficiently than the worst performers within the same brand network. Identifying and replicating the patterns from top-performing location pages across the entire network represents one of the highest-leverage CRO opportunities available to franchise marketing teams.
Local SEO and Franchise Location Page Performance
According to AuthoritySpecialist's 2026 analysis of 41 multi-location franchise brands, fewer than 30% of individual location pages rank in the top-3 local pack results for their primary service term within their own territory. For new franchise location pages, the timeline to meaningful organic traffic is 9–12 months.
Key local SEO performance data for franchise landing pages:
- Subdirectory structures (brand.com/locations/city-name/) consolidate domain authority more effectively than subdomain structures (cityname.brand.com/) for most franchise categories (AuthoritySpecialist, 2026).
- Well-optimized location pages reach 200–600 monthly organic sessions within 6–12 months in moderate-competition markets.
- 72% of franchise systems allocate 40%+ of marketing budget to local SEO, directly impacting location page investment levels (MarketingLTB, 2026).
- Review signals account for 16% of local pack ranking weight — the third-largest factor — making review management a core function for franchise location pages (ClapCreative, 2026).
Franchise Development Page Optimization
Reshift Media's 2026 franchise development report reveals that January 2026 recorded an extremely high conversion rate — the largest percentage of clicks turning into qualified franchise inquiries of any month in the past two years. This suggests that franchisors who invested in landing page quality during Q4 2025 saw outsized returns.
Development landing page best practices from the data:
- FDD transparency drives conversion — with 87.2% of franchisors now disclosing Item 19 financials (FDDIQ, 2026), development pages that surface unit-level economics data convert better than those that hide it.
- Trade show landing pages convert at 13.5% vs broker pages at 3.9% — a 3.5x gap that shapes how franchise brands structure their campaign-specific landing pages (FranConnect, 2025).
- Non-response is the #1 lead killer — franchise development pages without automated follow-up sequences lose leads at the top of the funnel, and this category fell 30% over three years as brands added automated nurture flows.
Page Speed and Core Web Vitals for Franchise Sites
Multi-location franchise websites face unique page speed challenges due to location-finder functionality, embedded maps, and review widgets. According to GEO Rank Tracker's franchise SEO analysis, mobile page speed issues are often the primary reason a franchise location fails to rank despite having strong local citations.
Critical franchise page speed benchmarks:
- Location pages should target sub-3-second load times on mobile — pages exceeding this threshold see measurable conversion drops.
- Keyword cannibalization is a hidden conversion killer — when corporate services pages outrank specific location pages for geo-modified queries, the wrong page captures local intent traffic.
- Core Web Vitals compliance varies dramatically across franchise networks, with individual franchisee-managed microsites frequently underperforming centrally managed location pages.
Franchise brands that centralize their landing page infrastructure while localizing content see better Core Web Vitals scores and higher local conversion rates.
Franchise Landing Page Optimization Checklist
Table 2 — Franchise landing page optimization priorities ranked by conversion impact
| Priority | Action | Expected Impact |
|---|---|---|
| 1 | Add named-customer social proof (logos, testimonials) | +22% conversion lift |
| 2 | Implement single-stat hero with key performance number | +18% conversion lift |
| 3 | Adopt mobile-first page design | +15% conversion lift |
| 4 | Use geo-targeted personalized CTAs | +12% conversion lift |
| 5 | Fix Core Web Vitals on location pages | Improved local rankings |
| 6 | Resolve keyword cannibalization (corporate vs location) | Correct traffic routing |
| 7 | Use subdirectory URL structure for locations | Consolidated domain authority |
| 8 | Add automated lead follow-up sequences | 30% fewer dead leads |
Multi-Location Landing Page Architecture and SEO Impact
The structural decisions franchise brands make about their landing page architecture have measurable SEO consequences. AuthoritySpecialist's 41-brand study provides the most granular franchise-specific architecture data available for 2026:
- Subdirectory location pages receive 2–3x more organic sessions than equivalent subdomain pages within the same franchise system, driven by consolidated domain authority signals.
- Content duplication across location pages remains the #1 technical SEO issue for franchise brands — when 50+ location pages share identical service descriptions, Google treats them as thin content and suppresses local rankings.
- Location pages with unique local content (minimum 300 words of location-specific copy) consistently outperform template-only pages in local pack rankings.
- Schema markup implementation on franchise location pages improves click-through rates by making local business information (hours, reviews, services) visible directly in search results.
The architecture decision affects every downstream metric — from crawl efficiency to link equity distribution to local pack eligibility. Franchise brands managing paid and organic channels together see the highest returns when both funnel types share a consistent location page infrastructure.
Franchise Landing Page Content Personalization Statistics
Content personalization is emerging as the highest-ROI landing page investment for franchise systems in 2026. The data shows clear advantages for location pages that go beyond simple city-name insertion:
- Pages mentioning specific local landmarks or neighborhoods convert 8–14% better than generic location pages that only insert the city name into a template (CausalFunnel, 2026).
- Franchise location pages featuring local team member photos and bios see 19% longer time-on-page compared to stock photography variants, signaling stronger engagement and trust.
- Dynamic content blocks showing real-time availability or wait times increase conversion rates by 11% for service-based franchise locations (booking, appointment-based models).
- Local review integration directly on the landing page (not just Google stars) lifts form-fill rates by 15%, aligning with the broader social proof findings from DigitalApplied's study.
These personalization tactics complement the paid traffic strategies franchise brands use to drive visitors to location pages. The higher the page quality, the lower the cost per acquisition from paid channels.
Franchise vs Non-Franchise Landing Page Performance Gap
Franchise landing pages face unique challenges that non-franchise businesses do not encounter. The multi-location constraint creates a performance gap that the data quantifies:
- Franchise brands manage an average of 47 landing page variants per concept (one per location territory), compared to single-location businesses managing 3–5 pages total. This scale creates maintenance, consistency, and quality control challenges.
- NAP (Name, Address, Phone) consistency across franchise location pages drops below 80% for systems with 100+ locations, directly impacting local search rankings where citation signals account for 7% of local pack weight (BizIQ, 2026).
- Centrally managed franchise landing pages outperform franchisee-managed pages by 35–50% on Core Web Vitals scores, driven by consistent hosting infrastructure, optimized templates, and unified asset delivery.
- Franchise location pages with Google Business Profile integration see 22% higher click-to-call rates than pages without embedded GBP data, bridging online and offline conversion tracking.
The data is clear: franchise brands that centralize landing page management while localizing content achieve the best conversion outcomes. This is why growth marketing strategies for multi-location brands increasingly prioritize landing page infrastructure over additional ad spend.
Related reading
- Countertops Landing Page Statistics
- The State of Landing Pages & CRO in Education & Coaching: 2026 Stats & Trends
- Electrical Services Landing Page Statistics
- Landing Page Design services at Web Tonic
Frequently Asked Questions
What is the average franchise landing page conversion rate?
The overall franchise lead-to-agreement conversion rate is 1.50% as of 2025, but it varies dramatically by vertical. QSR franchises convert at 2.81%, personal services at 1.28%, and full-service restaurants at just 0.44%. These numbers reflect franchise development conversions — consumer-facing location pages typically convert higher for simpler actions like booking appointments or requesting quotes.
How do franchise location pages perform in local search?
According to a 2026 study of 41 multi-location franchise brands, fewer than 30% of individual location pages rank in the top-3 local pack results for their primary service term in their own territory. Well-optimized pages in moderate-competition markets reach 200–600 monthly organic sessions within 6–12 months. Subdirectory URL structures tend to consolidate domain authority more effectively than subdomain approaches.
What CRO tactics work best for franchise landing pages?
A 2,000-page A/B testing study found that named-customer social proof delivers the highest conversion lift (+22%), followed by single-stat hero designs (+18%), mobile-first layouts (+15%), and geo-personalized CTAs (+12%). For franchise brands specifically, localizing social proof with recognizable community businesses and including geo-targeted calls-to-action are the highest-priority optimizations.
Should franchise websites use subdomains or subdirectories for location pages?
Data from AuthoritySpecialist's 2026 franchise SEO benchmarks shows that subdirectory structures (brand.com/locations/city-name/) tend to consolidate domain authority more effectively than subdomain structures (cityname.brand.com/) for most franchise categories. This means location pages benefit from the main domain's authority rather than building it independently.
How important is page speed for franchise conversion rates?
Mobile page speed issues are cited as the primary reason franchise location pages fail to rank despite having strong local citations. Location pages should target sub-3-second load times on mobile. Centrally managed location pages consistently outperform franchisee-managed microsites on Core Web Vitals metrics, making centralized landing page infrastructure a conversion advantage.
Sources
authorityspecialist.com — Franchise SEO Benchmarks 2026
digitalapplied.com — Landing Page Conversion Study 2026
franconnect.com — Franchise Lead Conversion Rate
franconnect.com — 2025 Franchise Sales Index
reshiftmedia.com — Franchise Development Trends 2026
marketingltb.com — Franchise Marketing Statistics 2026
clapcreative.com — Franchise SEO Strategy
georanktracker.com — Franchise Location SEO Support
fddiq.com — State of Franchising 2026


