



Table of contents
Education and coaching landing pages convert at a median rate of 8.4%, roughly 27% above the cross-industry baseline of 6.6%. Online course opt-in pages lead the vertical at 18.3%, while higher education inquiry pages sit closer to 6.3%. These benchmarks, drawn from Unbounce's analysis of over 41,000 pages and First Page Sage's 2026 B2B dataset, reveal where page structure and traffic source make the biggest difference for enrollment funnels.
Key Takeaways
- Education landing pages convert at 8.4% median — 27% higher than the 6.6% all-industry baseline (Unbounce Conversion Benchmark Report).
- Online course opt-in pages reach 18.3% median conversion, making them the strongest performers in the education vertical.
- Email traffic converts at 14.1% for education pages — nearly double the next-best channel, paid search at 7.3%.
- Program-specific landing pages boost conversions 40–60% compared to generic request-for-information pages.
- Coaching sales pages average 3–5% conversion on cold traffic, but structured paid-challenge pages reach 25–40% on warm audiences.
- Desktop converts 17.6% better than mobile in education despite mobile driving 6× more traffic volume.
- Form fields above 4 reduce completion rates by 30–50% in higher education inquiry funnels.
Education Landing Page Conversion Rates by Page Type
Conversion rates in the education sector vary sharply by page purpose. Pages built around free registration events consistently outperform paid-offer pages, while the gap between cold and warm traffic reveals how critical audience segmentation is for coaching and course creators looking to improve their growth marketing results.
Source: Unbounce Conversion Benchmark Report; CommuniPass 2026 coaching funnel data
| Page Type | Cold Traffic CVR | Warm Traffic CVR | Top 25% |
|---|---|---|---|
| Free webinar registration | 8–14% | 18–28% | 35%+ |
| Free 3-day mini-challenge | 12–22% | 25–40% | 45%+ |
| Paid challenge ($47–$197) | 3–8% | 15–30% | 35–40% |
| 1:1 discovery call (free) | 5–9% | 12–22% | 28%+ |
| Self-paced course ($97–$297) | 1–3% | 5–12% | 15–20% |
| High-ticket application ($2K+) | 1–3% | 3–5% | 8–12% |
| Online course opt-in page | 3–5% | 15–25% | 30–40% |
| Higher education inquiry | 4–6% | 8–14% | 18%+ |
The data shows that free mini-challenge registration pages convert at 12–22% on cold traffic, making them one of the strongest lead generation mechanisms for coaching businesses. When retargeting or email audiences hit these pages, conversion rates climb to 25–40%. In contrast, high-ticket application pages for programs priced above $2,000 average just 1–3% on cold visitors, though top performers still reach 8–12% through refined pre-qualification sequences.
Conversion Performance by Traffic Source
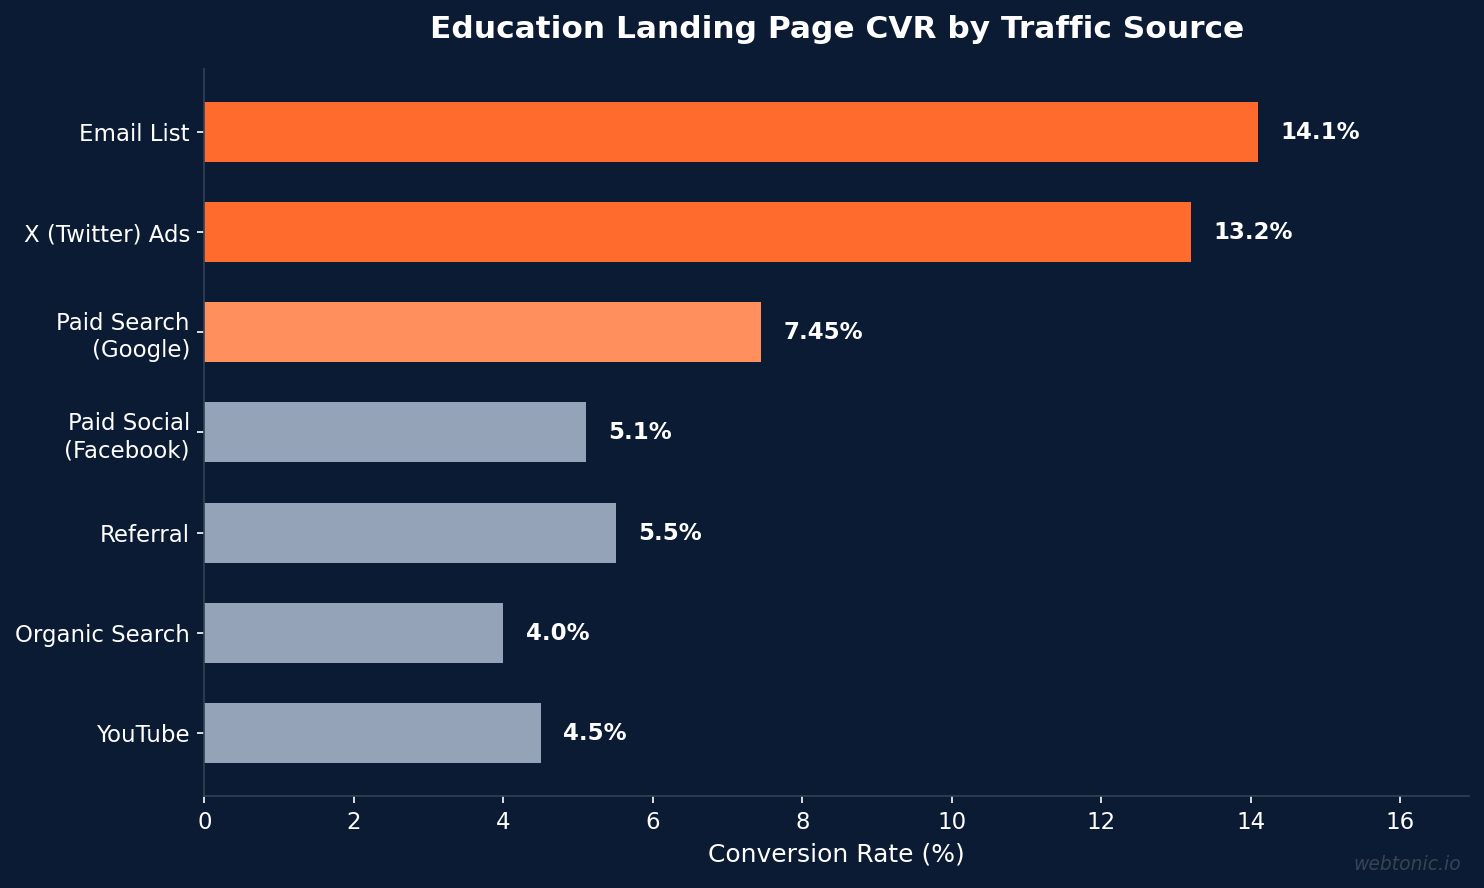
Not all traffic sources convert equally on education landing pages. Email campaigns dominate, generating returns that justify investing in list-building strategies alongside paid acquisition. Institutions running Google Ads management campaigns see paid search delivering the second-strongest conversion rates after email.
Sources: Unbounce 2024 CBR; acceleroi 2026; First Page Sage
| Traffic Source | Avg. Conversion Rate | Top Performers | Notes |
|---|---|---|---|
| Email (existing list) | 14.1% | 30–40% | Highest CVR by wide margin |
| Paid search (Google) | 7.3–7.6% | 12–18% | Best paid channel for education |
| Organic search | 3–5% | 8–12% | Intent-driven, steady volume |
| Paid social (Facebook) | 5.1% | 6–10% | Lower than other industries |
| Paid social (X/Twitter) | 13.2% | 3–21.7% | High variance, concise copy works |
| Referral / affiliate | 4–7% | 10–15% | Partner-driven, warm traffic |
| YouTube / content | 3–6% | 8–14% | Mid-funnel, builds trust |
Email traffic converts at 14.1% for education landing pages — nearly double the second-best channel. This signals that nurture sequences and segmented drip campaigns are critical infrastructure for any institution or coaching business. Paid search through Google delivers 7.3–7.6% average conversion, making it the top-performing paid channel. Interestingly, X (formerly Twitter) ads produce a 13.2% median but with extreme variance (3–21.7%), suggesting that the platform's character-limited format rewards simplicity — a pattern that aligns with the finding that simpler copy converts better across education pages.
Higher Education CRO and Form Optimization Data
Colleges and universities face unique conversion challenges. Prospective students research multiple institutions simultaneously, and the inquiry form is often the decisive moment. Institutions leveraging data intelligence to track form behavior consistently outperform those relying on page-level analytics alone.
Key findings from the higher education CRO landscape:
- Program-specific landing pages convert 40–60% better than generic "Request Information" pages (Rework.com 2026 analysis).
- Message match between ad copy and landing page headline is the single most impactful CRO variable — mismatches cause immediate bounces.
- Social proof with quantified outcomes (e.g., "92% of graduates employed within 6 months") outperforms qualitative testimonials.
- Form fields above 4 reduce completion by 30–50% — the optimal education inquiry form requests name, email, phone, and program interest.
- Schools with dedicated program pages converted organic visitors at 2× the rate of those using a single homepage for enrollment traffic (Authority Specialist, 41 schools).
- Institutions with structured admissions schema captured 55–68% of organic clicks for high-intent enrollment queries in their local markets.
Mobile Versus Desktop Conversion Gap
The education sector shows one of the largest mobile-desktop conversion gaps across all industries. Understanding this divide is essential for allocating design resources and structuring performance creative assets.
Mobile devices drive nearly 6× more traffic to education landing pages, yet desktop converts at a rate 17.6% higher (Unbounce). This gap indicates that while parents, students, and professionals browse on phones, they complete high-commitment actions — form submissions, applications, payment — on larger screens. For coaching businesses, this means the mobile experience must capture intent (email opt-in, calendar booking) while the desktop experience handles the conversion (payment, application).
The average online course landing page converts at 3.2% (CuFinder 2026), which rises to 5–8% when optimized for paid search traffic and 15–25% when targeting warm email audiences. Checkout completion rates for course purchases average 55–65%, with top performers reaching 75–85% through payment plan options and streamlined one-page checkouts.
Online Course Sales Page Conversion by Price Point
Price sensitivity directly shapes conversion expectations. Course creators and coaching businesses running Meta Ads services campaigns need to calibrate their cost-per-acquisition targets against these benchmarks.
Source: acceleroi 2026 online course benchmarks
| Price Point | Average CVR | Top Performers | Checkout Completion |
|---|---|---|---|
| Under $50 | 3–5% | 8–12% | 70–85% |
| $50–$200 | 2–4% | 6–10% | 60–75% |
| $200–$500 | 1–3% | 4–8% | 55–70% |
| $500–$1,000 | 0.5–2% | 2–4% | 50–65% |
| $1,000–$2,000 | 0.3–1% | 1–3% | 45–60% |
| Over $2,000 | 0.1–0.5% | 0.5–2% | 40–55% |
Courses priced under $50 convert at 3–5% on average, dropping to 0.1–0.5% for programs exceeding $2,000. However, top performers at every price tier convert at 2–4× the average, suggesting that page structure, social proof, and offer framing matter more than price alone. The one-click upsell acceptance rate of 15–25% (with top performers at 30–40%) represents significant revenue upside for course creators who implement post-purchase flows.
A/B Testing and Page Optimization Insights
The data from Unbounce's analysis reveals several optimization patterns specific to education:
- Simple copy outperforms complex messaging in education more than any other industry analyzed. Lower readability scores (simpler language) correlate with higher conversion.
- Video on coaching landing pages increases engagement by 40–80% but only lifts conversion when the video is under 90 seconds and positioned above the fold.
- Countdown timers and scarcity elements boost conversion 15–25% for cohort-based coaching programs with genuine enrollment deadlines.
- Testimonials with specific outcomes convert 3× better than generic praise — "I grew my practice revenue by 47% in 6 months" outperforms "Great program, highly recommend."
- Multi-step forms outperform single-page forms by 20–30% in higher education, where the commitment to share personal information benefits from progressive disclosure.
- Above-the-fold CTA placement remains critical — pages with a primary call-to-action visible without scrolling convert at 2× the rate of those requiring a scroll to find the first action button.
Education Sub-Vertical Landing Page Benchmarks
Performance varies significantly across education sub-verticals, driven by differences in audience intent, purchase complexity, and competitive density. Organizations investing in Google Ads pricing guide should benchmark against their specific niche rather than broad industry averages.
Sources: Unbounce CBR; Benchmarketing.org; CuFinder 2026
| Sub-Vertical | Median CVR | Avg. CPC (Google) | Lead-to-Enroll Rate |
|---|---|---|---|
| Online courses (general) | 18.3% | $2.50–$5.00 | 8–15% |
| Executive coaching | 3.2% | $14.84 | 12–18% |
| General course pages | 13.0% | $3.00–$6.00 | 10–20% |
| Higher education | 6.3% | $8.00–$18.00 | 5–12% |
| Tutoring / test prep | 4.9% | $4.00–$10.00 | 15–25% |
| Corporate training / L&D | 5.5% | $6.00–$12.00 | 8–14% |
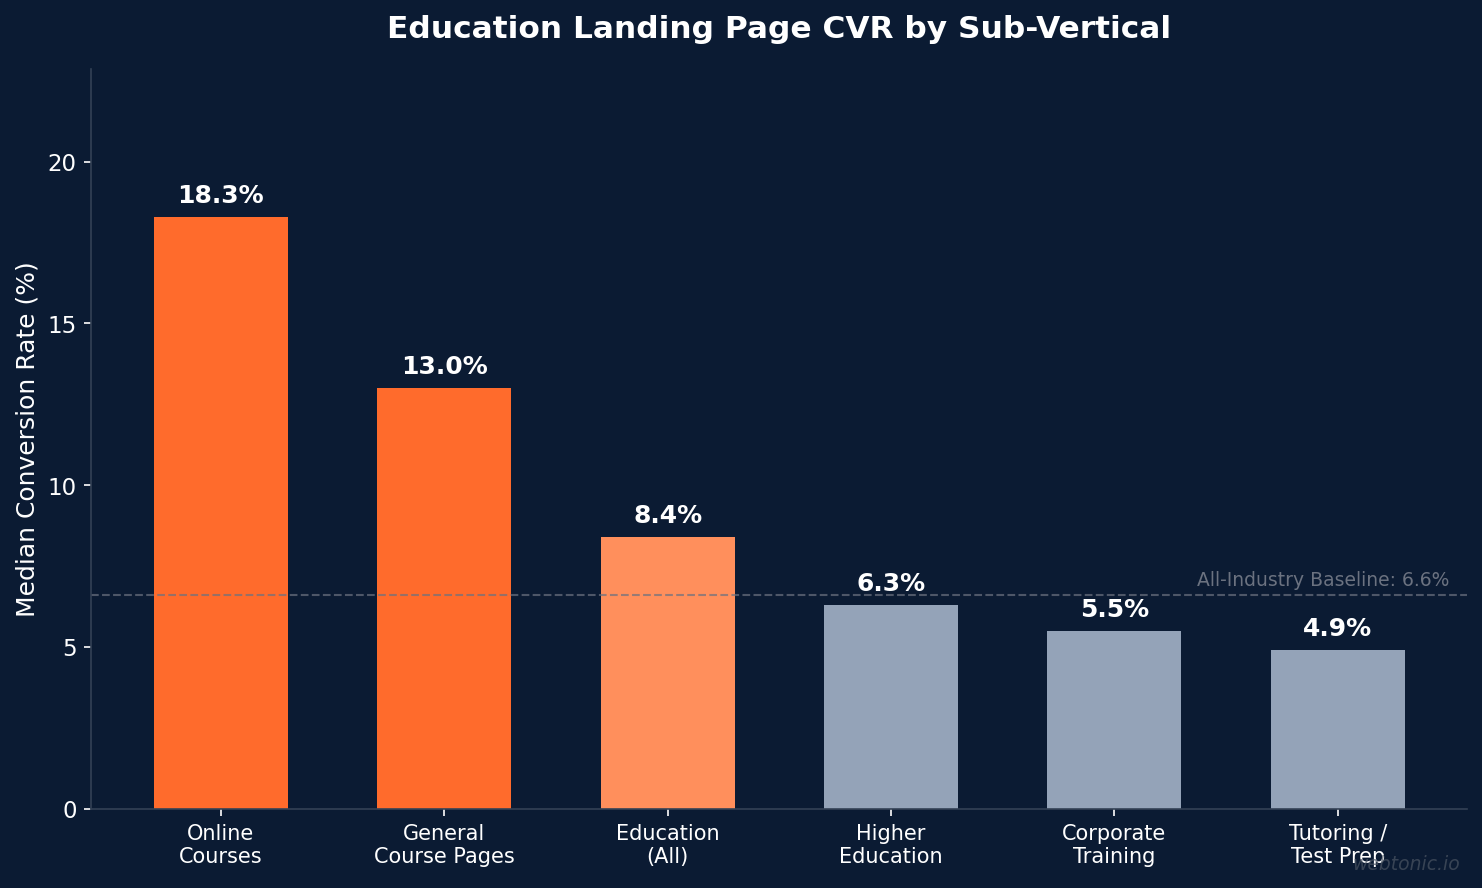
Online course opt-in pages dominate at 18.3% median conversion, reflecting the low-friction nature of free course previews and email captures. Executive coaching pages convert at just 3.2%, but the higher CPC of $14.84 and premium pricing make each conversion significantly more valuable. The lead-to-enrollment rate for tutoring services (15–25%) is notably higher than higher education (5–12%), driven by shorter decision cycles and lower financial commitment.
Coaching Funnel Architecture and Conversion Data
The coaching industry has developed distinct funnel architectures that significantly outperform standard landing page layouts. Understanding the conversion data behind each funnel stage helps coaches and course creators allocate their advertising budgets more effectively.
Webinar registration funnels remain the workhorses of the coaching industry, with registration pages converting at 8–14% on cold traffic and 18–28% on warm audiences. The critical metric beyond registration is attendance rate — webinar attendance averages 30–40%, with top performers reaching 50–60% through SMS reminders, calendar integrations, and replay access scarcity. The compounding effect means a 20% registration rate with 40% attendance and a 10% close rate on a $1,000 program yields $8,000 per 1,000 cold visitors.
Paid challenge funnels ($47–$197 entry) have emerged as the highest-converting coaching funnel type. These structured multi-day experiences convert at 3–8% on cold traffic for the initial purchase, but the real value sits in the back-end: 15–30% of challenge participants purchase the core program, often at $997–$4,997. This two-step funnel architecture achieves effective cost-per-acquisition rates 40–60% lower than direct high-ticket sales pages.
For higher education institutions, the lead-to-enrollment conversion rate averages 3.2% (CuFinder 2026), with significant variation by program type. Professional certificate programs convert at the highest rate (8–15%) due to clear career outcomes and shorter time commitments. Traditional degree programs convert at 2–5%, with the decision cycle often spanning 6–18 months and involving multiple campus visits, financial aid discussions, and family input.
One-click upsell acceptance rates of 15–25% represent one of the largest untapped revenue opportunities for course creators. Top performers implementing post-purchase one-click offers see acceptance rates of 30–40%, adding 20–35% to average order value without additional acquisition cost. This data point alone justifies the investment in checkout flow optimization for any education business generating consistent sales page traffic.
Related reading
- Plumbing Landing Page Statistics: Conversion Rates, CPL & CRO Benchmarks
- Pool Building Landing Page Statistics: Conversion Rates, Benchmarks & CRO Data
- Roofing Landing Page Statistics (2026): Conversion Rates, Speed & CRO Data
- Landing Page Design services at Web Tonic
Frequently Asked Questions
What is a good landing page conversion rate for education?
A good conversion rate for education landing pages is 8–10%, based on the industry median of 8.4%. Online course pages perform above average at 13–18%, while higher education inquiry pages typically range from 4–8%. Top-performing pages in any education sub-vertical exceed 15%.
How do coaching landing pages compare to other industries?
Coaching landing pages convert at 3–5% for cold traffic and 12–30% for warm audiences, placing them above the all-industry median of 6.6% when averaging across traffic types. The warm-traffic performance of coaching pages is among the highest across professional services verticals.
What is the optimal number of form fields for education landing pages?
The optimal number is 3–4 fields (name, email, phone, and program of interest). Forms with more than 4 fields see a 30–50% drop in completion rates. Multi-step forms that break the process into 2–3 stages can include more fields while maintaining higher completion.
Does mobile or desktop convert better for education landing pages?
Desktop converts 17.6% better than mobile for education landing pages, despite mobile generating nearly 6× more traffic. Institutions should optimize mobile for initial engagement and lead capture, while ensuring the desktop experience is built for form completion and enrollment applications.
Sources
Unbounce Conversion Benchmark Report — Education
CommuniPass — Coaching Sales Page Conversion Rate 2026
acceleroi — Average Online Course Conversion Rate 2026
acceleroi — Higher Education Website Conversion Rates 2026
Rework — Landing Page Optimization for Higher Education
CuFinder — Online Education Marketing Benchmarks 2026
Benchmarketing — Executive Coaching Marketing Benchmarks 2026
Authority Specialist — School SEO Benchmarks 2026


