Table of contents
In franchising, the app belongs to the brand, not the unit. The franchise apps people install are loyalty and ordering apps run by franchisors - Starbucks reports 35.5 million 90-day active US Rewards members in Q1 fiscal 2026 (Starbucks digital dashboard) - while most of the 845,000 franchise units the IFA projects for 2026 operate under brands with no consumer app at all. No published study reports an organic click-through, conversion or cost-per-install rate for franchise apps; the CTR, CVR and CPI figures below are Food & Drink category data from vendor paid-search benchmarks, labelled as such.
Key Takeaways
- Food & Drink had the highest Apple Ads tap-through rate at 12.55% in 2025 (MobileAction, vendor).
- Food & Drink search-ad conversion was 71.04%, from 73.26% in 2024.
- Food & Drink cost per tap doubled to USD 1.56 from USD 0.78.
- Food & Drink cost per download rose to USD 2.19 from USD 1.06.
- AppTweak reports Food & Drink as the top App Store CVR category at 52.8%.
- Domino's generated more than 85% of US retail sales from digital channels in 2025.
- Starbucks Rewards member spend was 58% of tender in US company-operated stores.
- The McDonald's US app shows 7.9M ratings and a #3 Food & Drink chart position.
- IFA projects 845,000 franchise units in 2026, up 1.5%.
Who actually runs franchise apps
The IFA 2026 Franchising Economic Outlook projects franchise establishments rising from 832,521 to 845,000 units and output from USD 907.3 billion to USD 921.4 billion. That total spans quick-service restaurants, home services, fitness, staffing and dozens of other sectors, and the consumer-app market inside it is concentrated in a small group of national QSR and coffee brands.
In those brands the franchisor builds and markets one app; franchisees benefit through orders routed to their store. The ASO decisions - name, keywords, screenshots, in-app events - sit with the brand's digital team. For a home-services or retail franchise without an app, "franchise ASO" is not a channel that exists yet, and the rest of this page is most relevant to franchisors deciding whether to build one.
| IFA 2026 outlook metric | 2025 | 2026 projection | Change |
|---|---|---|---|
| Franchise establishments | 832,521 | 845,000 | +1.5% |
| Franchise output | USD 907.3 billion | USD 921.4 billion | +1.6% |
| Franchise employment | Not stated in summary | Nearly 8.9 million | +150,000 jobs (1.8%) |
How the leading franchise apps present
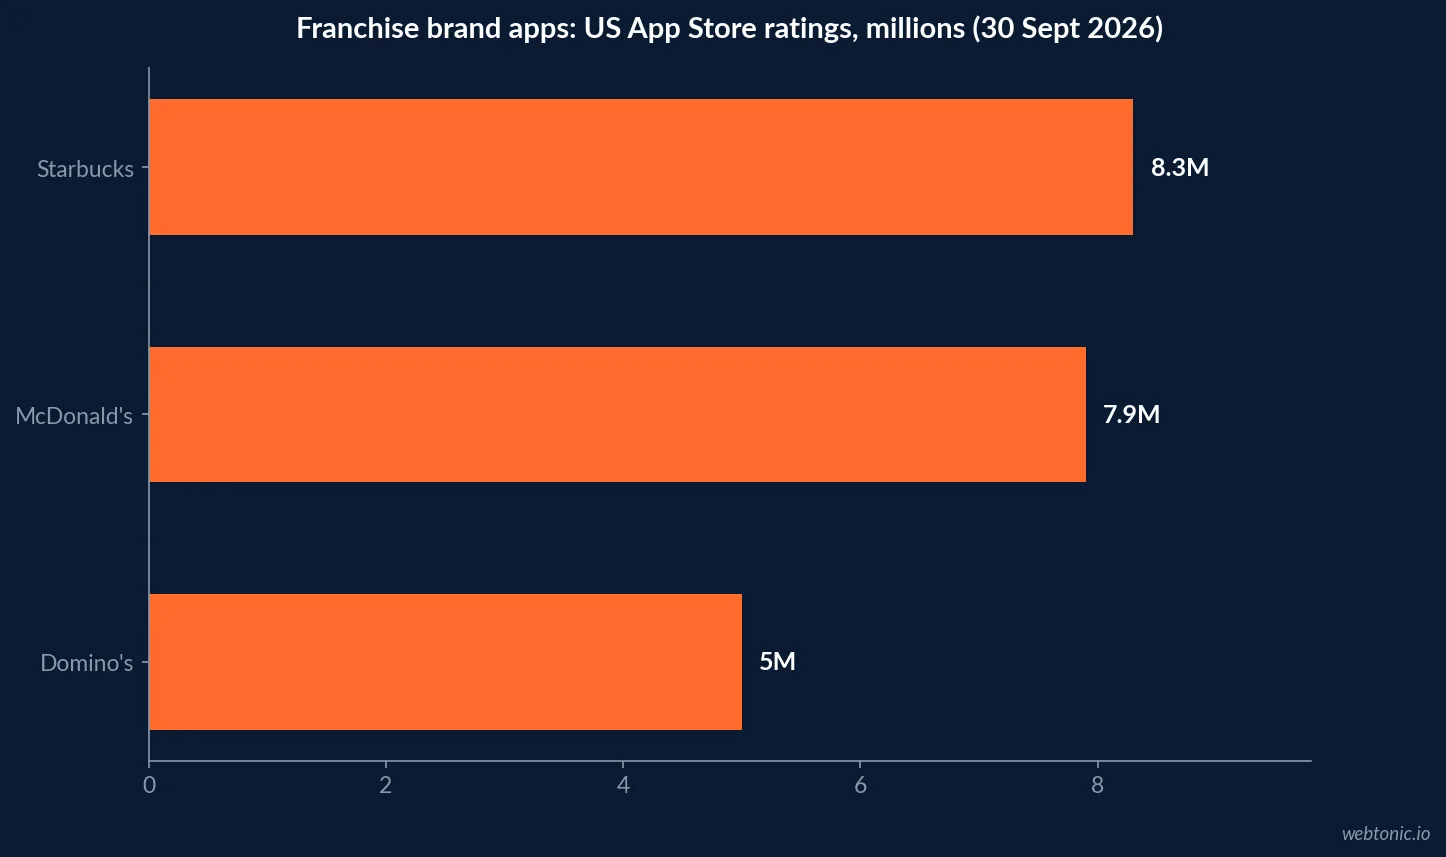
On the US App Store on 30 September 2026, the McDonald's app showed 7.9M ratings averaging 4.8 and ranked #3 in Food & Drink. The Starbucks app showed 8.3M ratings at 4.9 and ranked #7. The Domino's app showed 5M ratings at 4.8 and ranked #17. All three list under the brand's own developer account and lead with ordering and rewards.
Rating volume in the millions is the moat. A regional franchise launching an app starts at zero against that social proof, which is why its realistic target is branded search from existing customers, not category rankings.
| Franchise brand app (US App Store) | Ratings | Average | Food & Drink chart | Listing leads with |
|---|---|---|---|---|
| McDonald's | 7.9M | 4.8 | #3 | Mobile Order & Pay, MyMcDonald's Rewards |
| Starbucks | 8.3M | 4.9 | #7 | Ordering ahead and Rewards |
| Domino's | 5M | 4.8 | #17 | Build-your-pizza ordering |
What brand filings say about app-driven sales
Issuer filings give the only hard numbers on how much franchise revenue flows through apps, and they are brand-specific. Domino's 2025 annual report says the company "generated more than 85% of U.S. retail sales in 2025 from digital channels", primarily its online ordering website and mobile applications, and that US franchise fee revenue includes a technology fee of USD 0.375 per digital transaction.
Starbucks' digital dashboard reports 35.5 million 90-day active US Rewards members in Q1 fiscal 2026, up from 34.2 million in Q4 fiscal 2025, and member spend at 58% of tender in US company-operated stores. Starbucks is mostly company-operated in the US, so its figure describes a loyalty app at scale rather than a franchise system; Domino's is the franchise example.
| Brand-reported digital metric | Value | Period | Issuer document |
|---|---|---|---|
| Share of US retail sales from digital channels | More than 85% | 2025 | Domino's 2025 annual report |
| US technology fee per digital transaction | USD 0.375 | Fiscal 2025 | Domino's 2025 annual report |
| 90-day active US Rewards members | 35.5 million | Q1 FY2026 | Starbucks digital dashboard |
| 90-day active US Rewards members | 34.2 million | Q4 FY2025 | Starbucks digital dashboard |
| Rewards member spend, share of tender | 58% | Q1 FY2026 | Starbucks digital dashboard |
CTR: Food & Drink leads tap-through
MobileAction's 2026 Apple Ads benchmark, compiled from its own and SearchAds.com tools on 2025 campaigns, reports Food & Drink as the highest tap-through category at 12.55% (TTR data), down from 13.86% in 2024, against 8.08% across all categories. The vendor links that to high-frequency, need-state searches - delivery, a named chain, "coffee near me" - where the ad matches what the searcher wants right now.
This is the closest published proxy for franchise app click-through, and it describes paid placements at the top of search results. Organic click-through for a brand's own name is likely higher but no source publishes it.
CVR: high intent, slightly cooler in 2025
On conversion, Food & Drink "stayed among the highest converters" at 71.04% of taps turning into downloads, from 73.26% in 2024, against 65.82% across all categories. For organic listings, AppTweak's category conversion study names Food & Drink the highest-converting App Store category, with an average CVR of 52.8%, against a store-wide US average of 8.56%. AppTweak measures conversion from its own panel data, which is a different definition from MobileAction's tap-to-download rate.
CPI: install costs doubled in Food & Drink
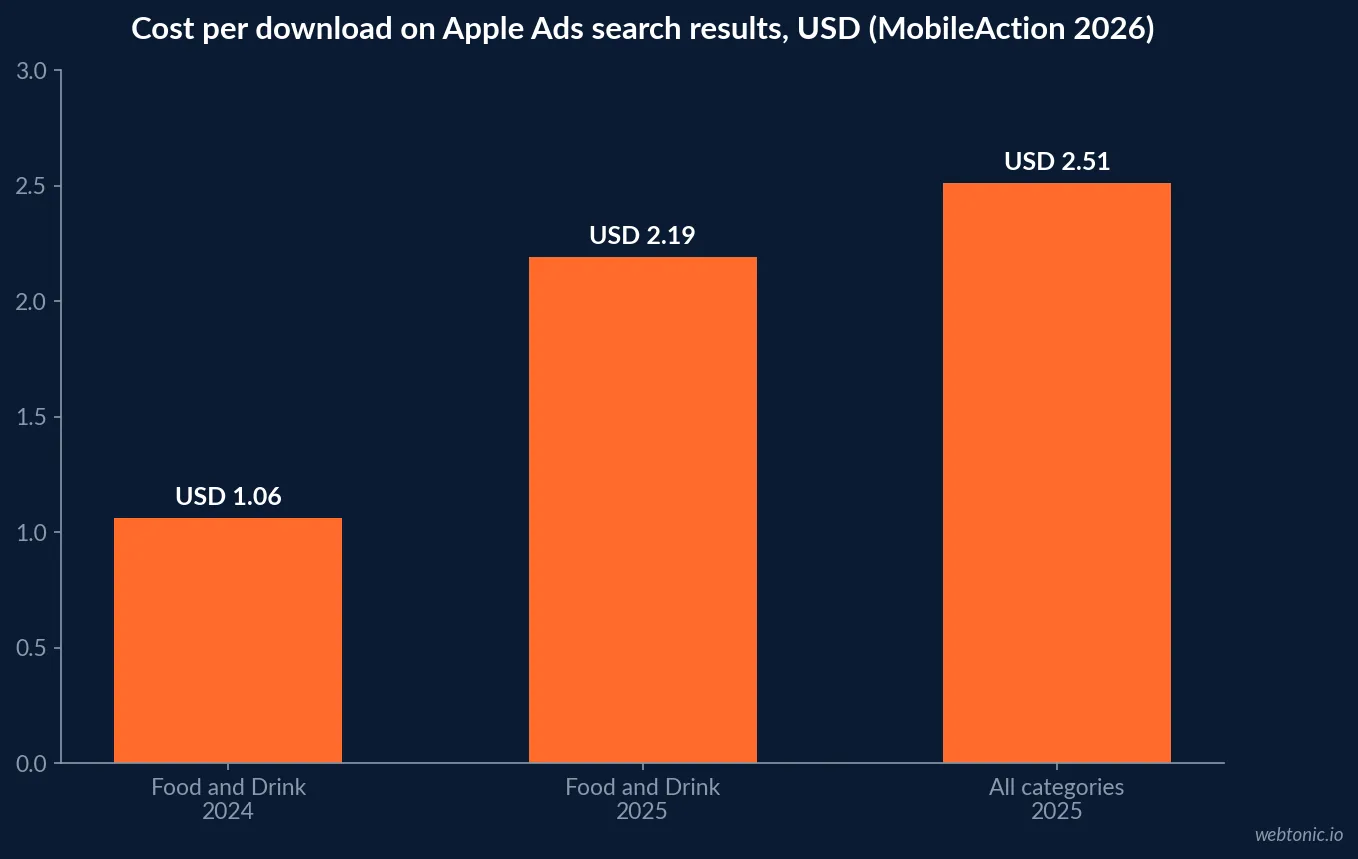
Cost is where the category changed most. MobileAction reports the Food & Drink cost per tap doubling from USD 0.78 to USD 1.56, moving it from a low-cost to a mid-range category, and cost per acquisition rising from USD 1.06 to USD 2.19 per download. The all-category figure was USD 2.51. The vendor reads the jump as more advertisers competing for ready-to-act users.
SplitMetrics, a second vendor, reports an average cost per acquisition of USD 3.76 across its top 15 categories in 2025. On Android, Google's App campaign guidance sets the budget floor: when optimizing for install volume, the daily budget should be at least 50 times the target cost per install, so a USD 2 target needs at least USD 100 a day.
| Food & Drink, Apple Ads search results (MobileAction, vendor) | 2024 | 2025 | All categories 2025 |
|---|---|---|---|
| Tap-through rate (CTR) | 13.86% | 12.55% | 8.08% |
| Tap-to-download conversion (CVR) | 73.26% | 71.04% | 65.82% |
| Cost per tap | USD 0.78 | USD 1.56 | Quarterly USD 1.26-1.88 |
| Cost per download (CPA / CPI proxy) | USD 1.06 | USD 2.19 | USD 2.51 |
In-app events for local promotions
Franchise apps run limited-time offers constantly, and Apple gives them a native surface for it. Apple's in-app events documentation allows up to 10 events published on the App Store at a time and up to 15 approved events in App Store Connect, submitted for review independently of an app update. Event cards carry a short description of up to 50 characters and a long description of up to 120 characters.
Events can appear in search results and on the product page, which makes a seasonal menu launch or a double-points week discoverable in the store itself rather than only through push notifications to people who already have the app.
| Apple listing lever | Documented limit | Franchise use |
|---|---|---|
| In-app events published at once | Up to 10 | LTO launches, double-points weeks |
| Approved in-app events held | Up to 15 | Queue a quarter of promotions ahead |
| Event short description | Up to 50 characters | Offer headline |
| Event long description | Up to 120 characters | Terms and participating locations |
How often top apps run events
AppTweak's 2025 ASO trends report on the top US apps shows how widely the feature is used: 38% of top apps ran more than five in-app events in 2025, against 51% of top games, and special events were the most common format at 37% of app events. Major updates made up 25% and live events 15%. A national franchise brand running a new promotion every few weeks can clear that five-event mark easily; the constraint is the review queue, not the idea list.
| In-app event usage (AppTweak 2025, top US apps) | Value | Franchise reading |
|---|---|---|
| Top apps running more than 5 events | 38% | A monthly LTO cadence already exceeds this |
| Top games running more than 5 events | 51% | Games set the bar for event frequency |
| Special events, share of app events | 37% | Seasonal menu launches fit here |
| Major updates, share of app events | 25% | New ordering features or rewards tiers |
| Live events, share of app events | 15% | Store openings or in-store promotions |
What franchisors and franchisees should take from this
The data draws a clear line. Apple's ads page reports over 850 million weekly App Store visitors, and Food & Drink converts searches better than almost any category. That rewards brands with national demand and a reason to order through the app. It does not create demand for a unit-level app.
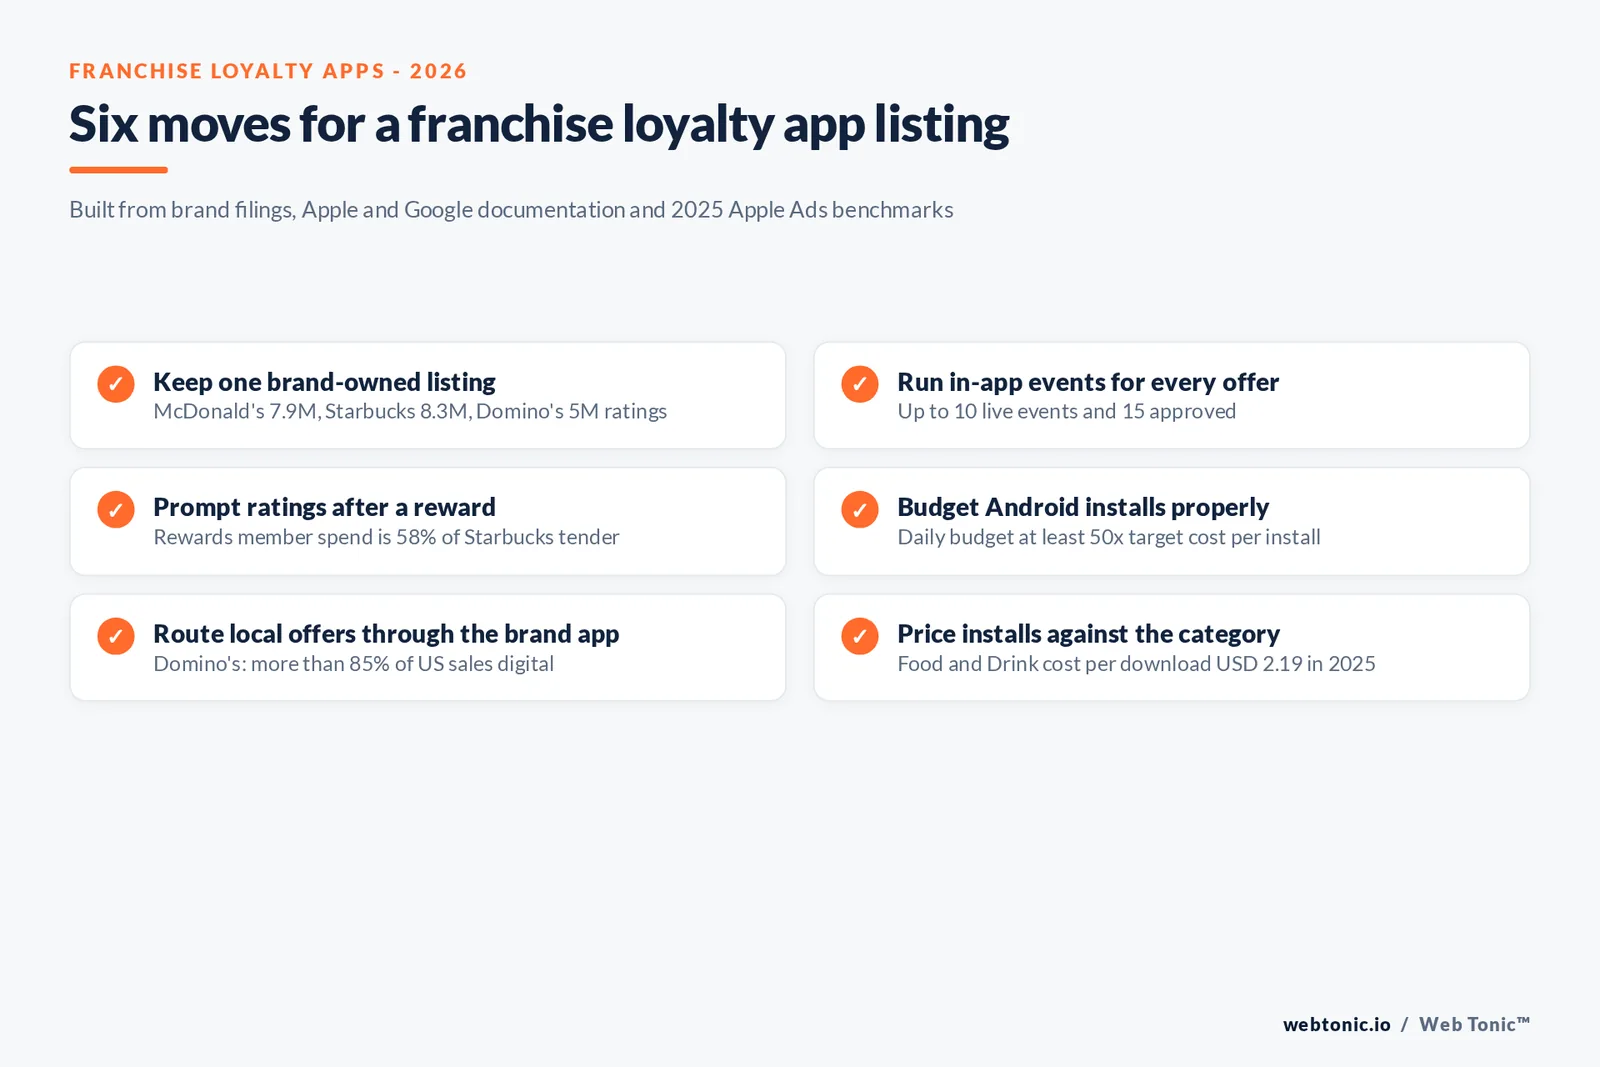
- Franchisors with an app: treat the listing as the top of the loyalty funnel - keep rewards front and centre in the first screenshot and run in-app events for every national offer.
- Franchisors without one: weigh the build against the USD 2.19 to USD 3.76 vendor cost-per-download range and the fact that incumbents hold millions of ratings.
- Franchisees: push local offers through the brand app rather than a separate listing that competes for the same branded search.
- Prompt ratings after a reward is redeemed, when satisfaction is highest.
Related reading
For the store-wide picture see our app store optimization statistics. Franchise marketers can compare franchise SEO statistics and franchise Google Shopping and feed management statistics, or see our growth marketing services for multi-location programmes.
Frequently Asked Questions
What click-through rate do franchise restaurant apps get in the App Store?
No source publishes an organic click-through rate for franchise apps. For paid search results, MobileAction's 2026 Apple Ads benchmark, built on 2025 data from its own tools, reports Food & Drink as the highest tap-through category at 12.55%, down from 13.86% in 2024, against 8.08% across all categories.
What is a typical cost per install for a restaurant loyalty app?
On Apple Ads search results, MobileAction reports a Food & Drink cost per acquisition (a download) of USD 2.19 in 2025, up from USD 1.06 in 2024, with cost per tap doubling from USD 0.78 to USD 1.56. On Google App campaigns, Google advises a daily budget of at least 50 times the target cost per install when optimizing for install volume - USD 100 a day for a USD 2 target.
Should individual franchisees build their own app?
Usually not. The apps that win in franchising are brand apps run by the franchisor - McDonald's, Starbucks and Domino's list theirs under their own developer names - and a unit-level app would compete with the brand's own listing for the same branded searches. Franchisees get more from local offers delivered inside the brand app.
How important is the app to franchise sales?
For the largest QSR brands, very. Domino's reports that more than 85% of its US retail sales in 2025 came from digital channels, primarily its website and mobile apps. Starbucks reports Rewards member spend at 58% of tender in US company-operated stores in Q1 fiscal 2026. These are brand-level figures, not averages for franchising.
How many franchise units are there in the US?
The International Franchise Association's 2026 Franchising Economic Outlook projects franchise establishments growing from 832,521 to 845,000 units, an increase of 1.5%, with franchise output rising from USD 907.3 billion to USD 921.4 billion. Most of those units belong to brands without a consumer app.
Sources
MobileAction - Apple Ads 2026 Benchmark, TTR by category
MobileAction - Apple Ads 2026 Benchmark, CPA by category
AppTweak - Average app conversion rate per category
AppTweak - ASO trends and benchmarks report 2025
Starbucks - Card, Loyalty and Mobile Dashboard Q1 FY26
Domino's Pizza - 2025 Annual Report
International Franchise Association - Franchising Economic Outlook 2026
Apple App Store - McDonald's listing
Apple Developer - In-app events
SplitMetrics - Apple Search Ads cost 2025
Google Ads Help - App campaign bidding and budgets
Apple Ads - App Store advertising