Table of contents
Real estate is one of the few local-service industries where consumer apps are huge - and they belong to the portals, not to brokerages. Zillow Group reported 239 million average monthly unique users across its apps and sites in Q2 2026 (Zillow Q2 2026 results), and its App Store listing shows 7.2M ratings. There is no published organic ranking, click-through or conversion benchmark for real estate apps, so this page uses the Lifestyle category - where the leading home-search apps are listed - from vendor paid-search data, labelled as such, plus Apple, Google and NAR sources.
Key Takeaways
- Zillow's apps and sites averaged 239 million monthly unique users in Q2 2026, down 2%.
- Zillow recorded 2.5 billion visits in Q2 2026, also down 2% year over year.
- The Zillow app shows 7.2M ratings at 4.8 and a #7 Lifestyle chart position.
- Realtor.com shows 1.1M ratings at 4.8 and #26 in Lifestyle.
- Lifestyle search-ad conversion rose to 70.37% in 2025 from 59.12% (MobileAction, vendor).
- Lifestyle tap-through rate more than doubled to 9.50% from 4.59%.
- Lifestyle cost per tap fell to USD 0.97 from USD 1.76.
- US existing-home sales ran at 3.98 million in August 2026 (NAR).
- Buyers split searches 50% desktop, 50% mobile in NAR's 2024 generational report.
Portals own the real estate app market
The scale gap is the first fact any brokerage ASO plan has to accept. Zillow Group's Q2 2026 release reports 239 million average monthly unique users of its mobile apps and sites and 2.5 billion visits, both down 2% year over year. Zillow cites Comscore data showing its audience outperformed a residential real estate category that declined overall, and describes itself as the most visited real estate app and website in the United States.
Those users are split across web and app and Zillow does not break out app-only figures in the release, so "239 million app users" would be a misquote. What the number does establish is that home search on mobile is a portal habit. A brokerage app is a second app on the phone, not the first.
| Zillow Group traffic (Q2 2026 release) | Reported value | Year over year | Note |
|---|---|---|---|
| Average monthly unique users, apps and sites | 239 million | -2% | Web and app combined |
| Visits during the quarter | 2.5 billion | -2% | Web and app combined |
| Category trend (Comscore, cited by Zillow) | Decline overall | n/a | Zillow outperformed the category |
How the leading listings present
On the US App Store on 30 September 2026, the Zillow listing showed 7.2M ratings averaging 4.8, an Editors' Choice award and a #7 position in the Lifestyle chart. The Realtor.com listing showed 1.1M ratings at 4.8 and #26 in Lifestyle, and leads its description with a claim of being the app most trusted by real estate professionals, footnoted to an August 2024 proprietary survey.
Both are in Lifestyle rather than a dedicated real estate category, because Apple has none. That matters for benchmarks: category-level data for Lifestyle mixes home search with fitness, dating, recipes and smart-home apps, so it is a directional reference, not a real estate rate.
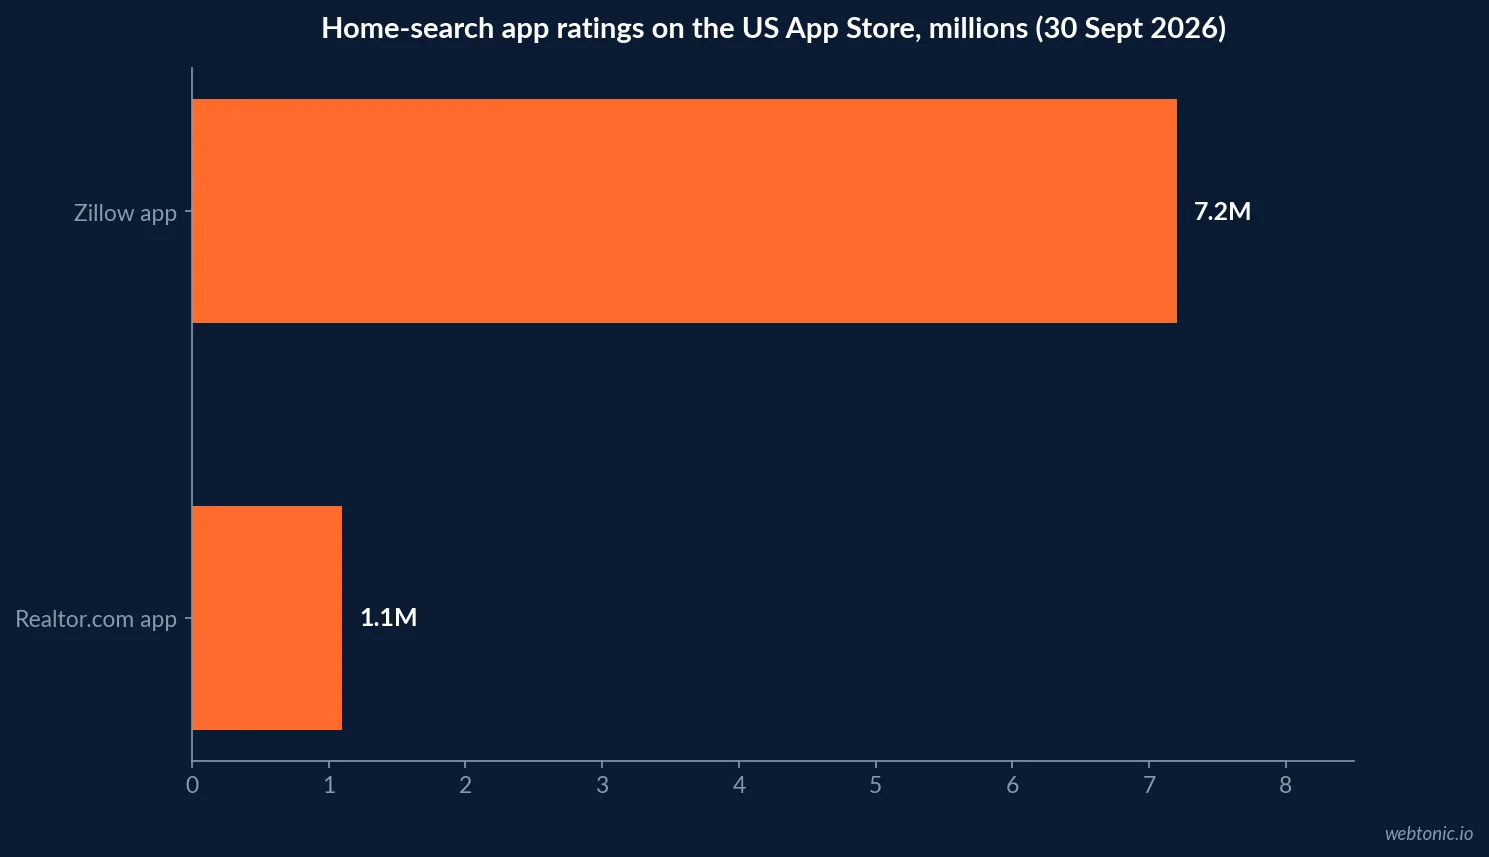
| Home-search app (US App Store) | Ratings | Average | Lifestyle chart | Distinctive listing element |
|---|---|---|---|---|
| Zillow | 7.2M | 4.8 | #7 | Editors' Choice award |
| Realtor.com | 1.1M | 4.8 | #26 | Survey-footnoted trust claim |
| Typical brokerage app | Not published | Not published | Not charting | Brand name and exclusive listings |
Lifestyle category search-ad benchmarks
MobileAction's 2026 Apple Ads benchmark, compiled from its own and SearchAds.com tools on 2025 campaigns, calls Lifestyle "the standout mover". Its conversion data shows the category's tap-to-download rate rising to 70.37% from 59.12%, and its tap-through data shows TTR rising to 9.50% from 4.59%. At the same time the cost per tap fell to USD 0.97 from USD 1.76.
The vendor reads this as advertisers matching creatives to narrower intent clusters. For a real estate advertiser that is a relevant pattern - "homes for sale in [city]" is a narrow intent - but the dataset is not segmented by real estate, so treat it as a ceiling on what paid search results can do rather than a target.
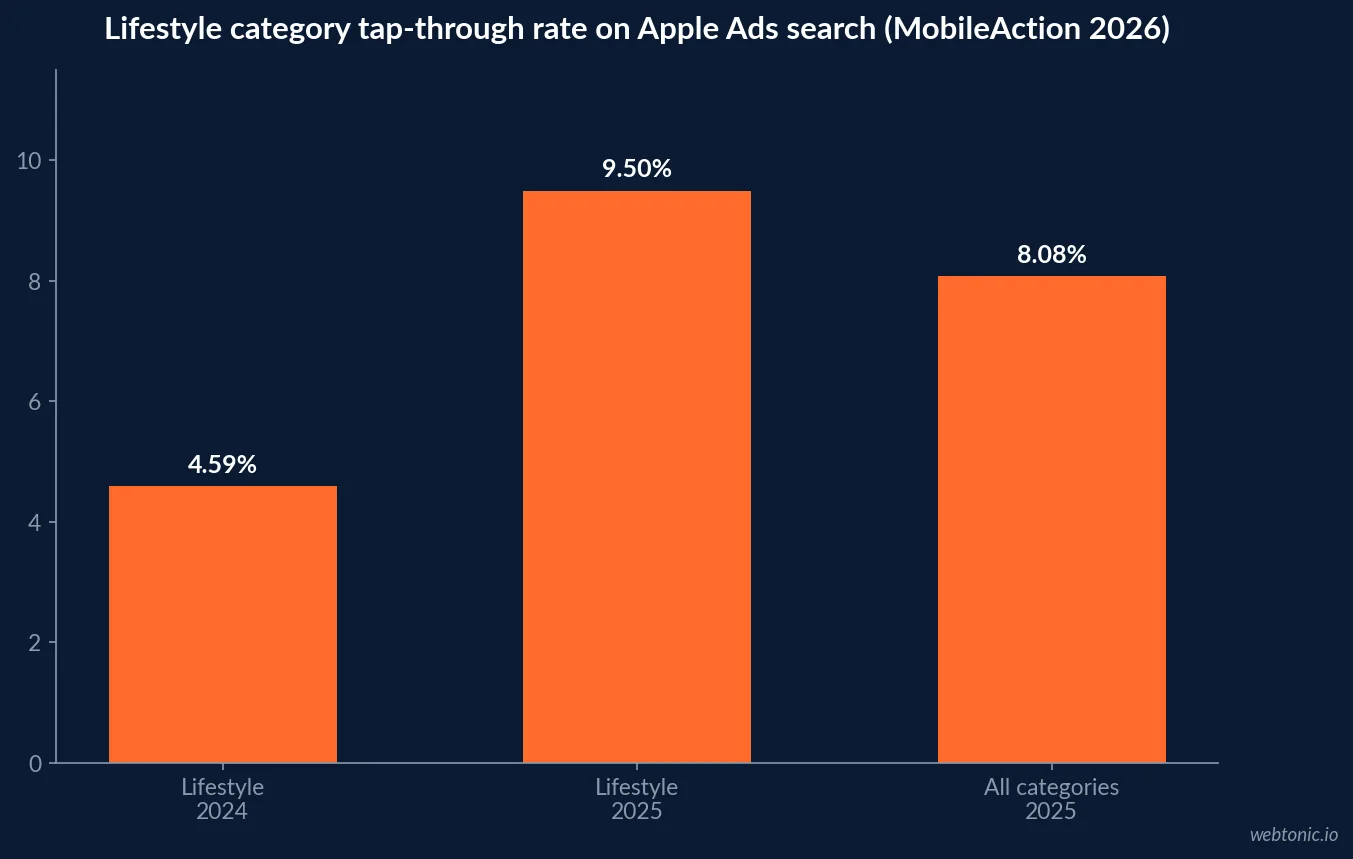
| Lifestyle, Apple Ads search results (MobileAction, vendor) | 2024 | 2025 | All categories 2025 |
|---|---|---|---|
| Tap-to-download conversion rate | 59.12% | 70.37% | 65.82% |
| Tap-through rate | 4.59% | 9.50% | 8.08% |
| Cost per tap | USD 1.76 | USD 0.97 | Quarterly USD 1.26-1.88 |
Organic listing conversion: the store-wide baseline
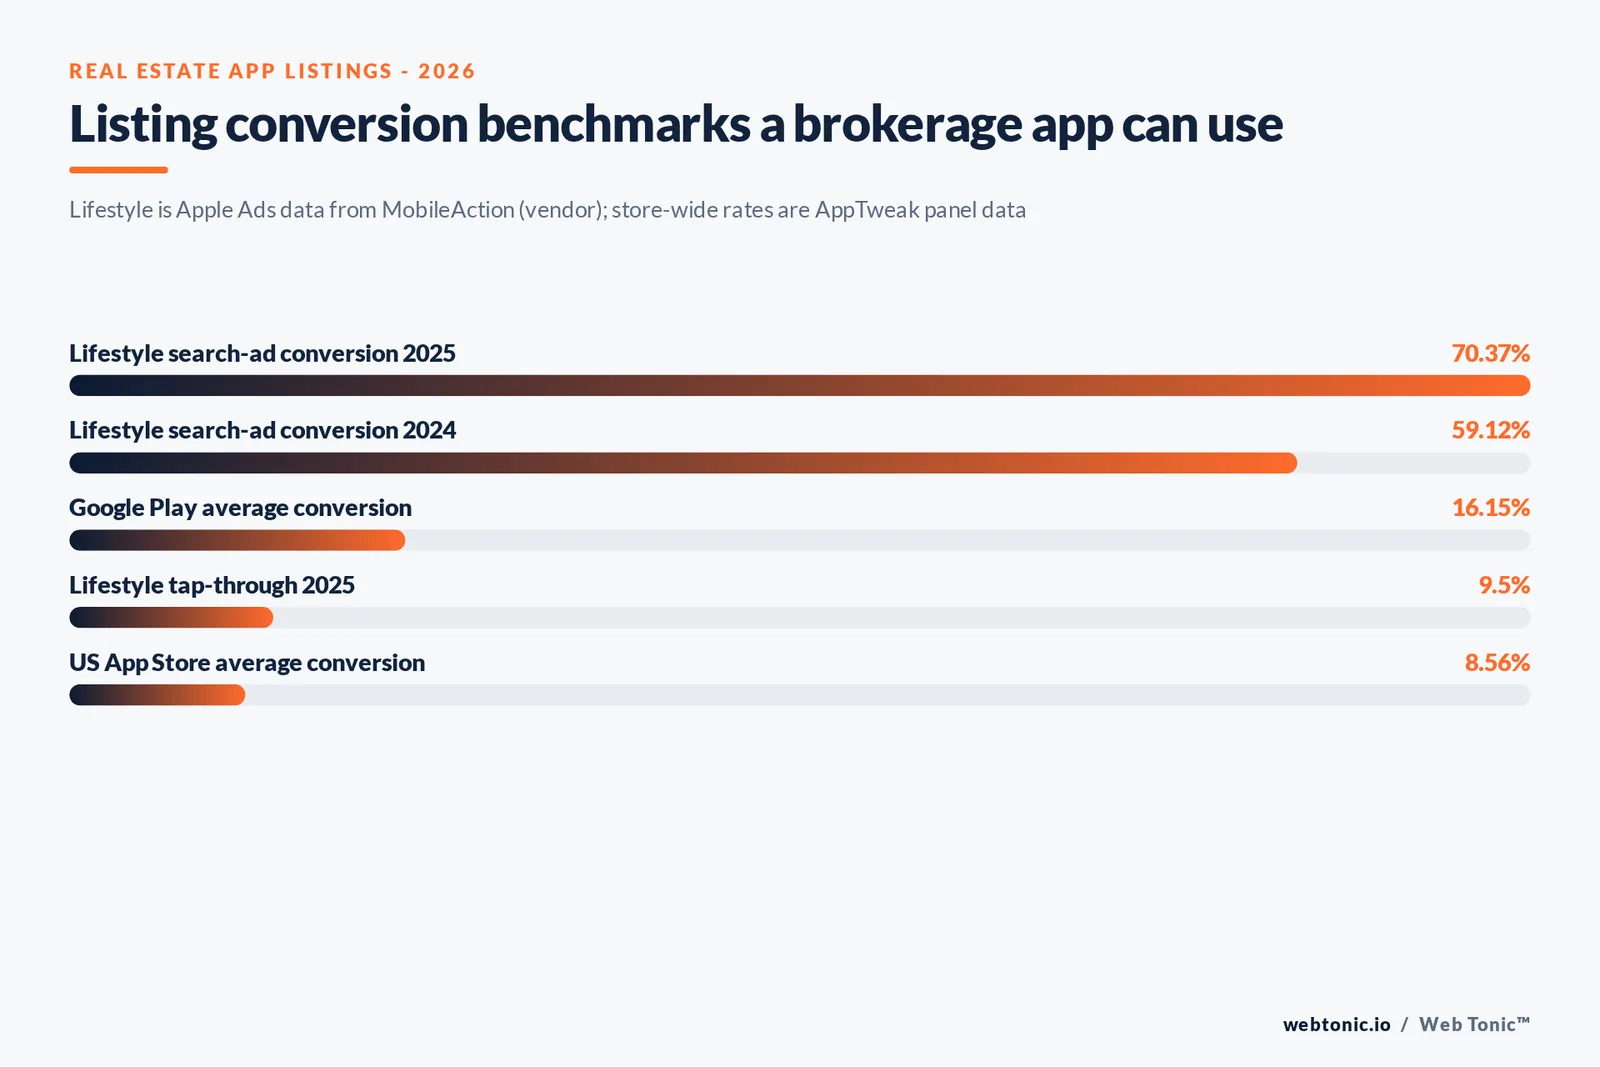
For organic listing conversion, the only broad benchmark is store-wide. AppTweak's category conversion study puts the average conversion rate on the US App Store at 8.56% and on Google Play at 16.15%, with an average App Store install rate of 3.8%. AppTweak defines these on its own panel data and stresses that they fluctuate greatly between categories. Paid search-results conversion (above) is much higher because it measures taps from a search, not page views.
Apple's own figure is similar in spirit: the custom product pages documentation cites a 1.6% average conversion rate on default product pages and a 2.5 percentage point average increase when traffic goes to a custom page. The definitions differ, which is why these numbers should never be averaged together.
| Listing conversion reference | Value | Definition | Publisher |
|---|---|---|---|
| US App Store average conversion | 8.56% | Vendor panel, all categories | AppTweak |
| US Google Play average conversion | 16.15% | Vendor panel, all categories | AppTweak |
| US App Store average install rate | 3.8% | Vendor panel, all categories | AppTweak |
| Default product page conversion | 1.6% | Apple average | Apple |
| Custom product page uplift | +2.5 points | Apple average | Apple |
Market context: transactions and search habits
App demand in real estate tracks the transaction market, and the market is slow. NAR's existing-home sales data shows sales of 3.98 million (seasonally adjusted annual rate) in August 2026, down 2.0% from July, with inventory at 1.62 million homes and prices up 1.6% year over year.
Device habits are split. NAR's 2024 Home Buyers and Sellers Generational Trends report found buyers typically did 50% of their internet searching on a desktop or laptop and 50% on a mobile device, with buyers aged 43 and younger leaning mobile. With 91% of US adults owning a smartphone (Pew Research Center), the question for a brokerage is not reach but whether its app offers a reason to be opened.
| US housing and search context | Value | Period | Source |
|---|---|---|---|
| Existing-home sales (SAAR) | 3.98 million | August 2026 | NAR |
| Month-over-month change in sales | -2.0% | August 2026 | NAR |
| Homes for sale (inventory) | 1.62 million | August 2026 | NAR |
| Price change, year over year | +1.6% | August 2026 | NAR |
| Share of buyers' internet searches on mobile | 50% | 2024 report | NAR Generational Trends |
| US adults owning a smartphone | 91% | Latest fact sheet | Pew Research Center |
Targeting rules for housing app campaigns
If a brokerage promotes its app with Google App campaigns, housing rules apply. Google's personalized advertising policy says age, gender, marital status and parental status may not be used to target Housing ads in the United States and Canada, and ZIP code location targeting cannot be used for them either. Radius targeting is allowed with a minimum of 1 km around a location, as is city and country targeting.
This pushes app promotion toward creative and listing relevance rather than audience slicing - one more reason custom store pages by market or property type matter more than demographic targeting.
What brokerages can realistically optimize
A brokerage will not out-rank Zillow on "homes for sale". It can own three things. Its brand name, so that clients who search for it find the app and not a portal ad. Its local markets, using up to 70 Apple custom product pages and up to 50 Google Play custom store listings to show a Denver buyer Denver listings. And its transaction workflow - document signing, showing requests, closing checklists - which the portals do not handle for the client.
Matching listing pages to local markets
Custom pages are where a brokerage can beat a portal on relevance, because the portal's default page has to speak to every buyer in the country. Apple's documentation lets each custom product page vary the screenshots, promotional text and app previews and gives each its own URL, so a page built for one metro can be linked from that metro's listing emails, yard-sign QR codes and agent signatures. Google Play's custom store listings go further and can differentiate the app name, icon and descriptions, targeted by country or tied to a specific ad campaign.
Neither store publishes a real estate uplift figure, so the only benchmark to hold these pages against is Apple's own average: a 1.6% default page and a 2.5 point lift for custom pages. Measure each market page against the default before building more.
| Custom page idea | Store feature | Traffic source that links to it |
|---|---|---|
| One page per metro market | Apple custom product page | Market newsletters and yard-sign QR codes |
| Buyer vs seller page | Apple custom product page | Listing presentations and open houses |
| Rentals page | Google Play custom store listing | Rental listing syndication and ads |
| Client transaction portal page | Both stores | Post-offer emails from agents |
Listing checklist for a brokerage app
- Lead the first screenshot with what the portals lack: exclusive or coming-soon listings, or the client transaction portal.
- Build one custom product page per core market and link it from market-specific email and QR codes.
- Ask closed clients for ratings; a listing with a few dozen ratings sits beside portals with millions.
- Keep the app name identical to the brand agents use in conversation.
- If you run install ads, follow housing targeting rules and use radius or city targeting only.
Related reading
For store-wide context see our app store optimization statistics. Real estate marketers can also compare real estate SEO statistics and real estate connected TV advertising statistics, or see our performance creative services for listing screenshots and ads.
Frequently Asked Questions
What is a good App Store conversion rate for a real estate app?
No source publishes an organic benchmark for real estate apps specifically. The closest evidence is category-level and paid: MobileAction's 2026 Apple Ads benchmark puts Lifestyle - the category Zillow and Realtor.com are listed in - at a 70.37% tap-to-download conversion rate in 2025, up from 59.12%. Store-wide, AppTweak reports an average US App Store conversion rate of 8.56% from page view to install.
Which category are real estate apps in on the App Store?
The two largest US home-search apps both sit in Lifestyle. On 30 September 2026 the Zillow listing showed 7.2M ratings at 4.8 and a #7 Lifestyle chart position, and Realtor.com showed 1.1M ratings at 4.8 and #26 in Lifestyle. A brokerage app in the same category competes directly with them for search visibility.
Should a brokerage build its own home-search app?
Only with a reason to be opened that the portals do not offer, such as exclusive listings, a client portal for active transactions, or agent tools. Zillow reported 239 million average monthly unique users across its apps and sites in Q2 2026 and 2.5 billion visits; a brokerage app will not out-rank that on generic home-search terms, but it can own its brand name and its clients' transaction workflow.
Do housing ad rules apply to app install ads?
On Google, yes. Google's personalized advertising policy says certain demographics - age, gender, marital status and parental status - may not be used to target Housing ads in the United States and Canada, and ZIP code location targeting cannot be used for Housing ads there. Radius targeting of at least 1 km is allowed.
Is mobile or desktop more important for home search?
Both. NAR's 2024 Home Buyers and Sellers Generational Trends report found buyers typically conducted 50% of their internet searches on a desktop or laptop and 50% on a mobile device, with buyers aged 43 and younger more likely to use mobile and those 59 and older more likely to use a desktop or laptop.
Sources
Zillow Group - Second-Quarter 2026 Financial Results
Apple App Store - Zillow listing
Apple App Store - Realtor.com listing
MobileAction - Apple Ads 2026 Benchmark, conversion rate by category
MobileAction - Apple Ads 2026 Benchmark, TTR by category
AppTweak - Average app conversion rate per category
Apple Developer - Custom product pages
NAR - Existing-Home Sales
NAR - 2024 Home Buyers and Sellers Generational Trends
Google Ads policy - Personalized advertising
Pew Research Center - Mobile fact sheet