



Table of contents
Key Takeaways
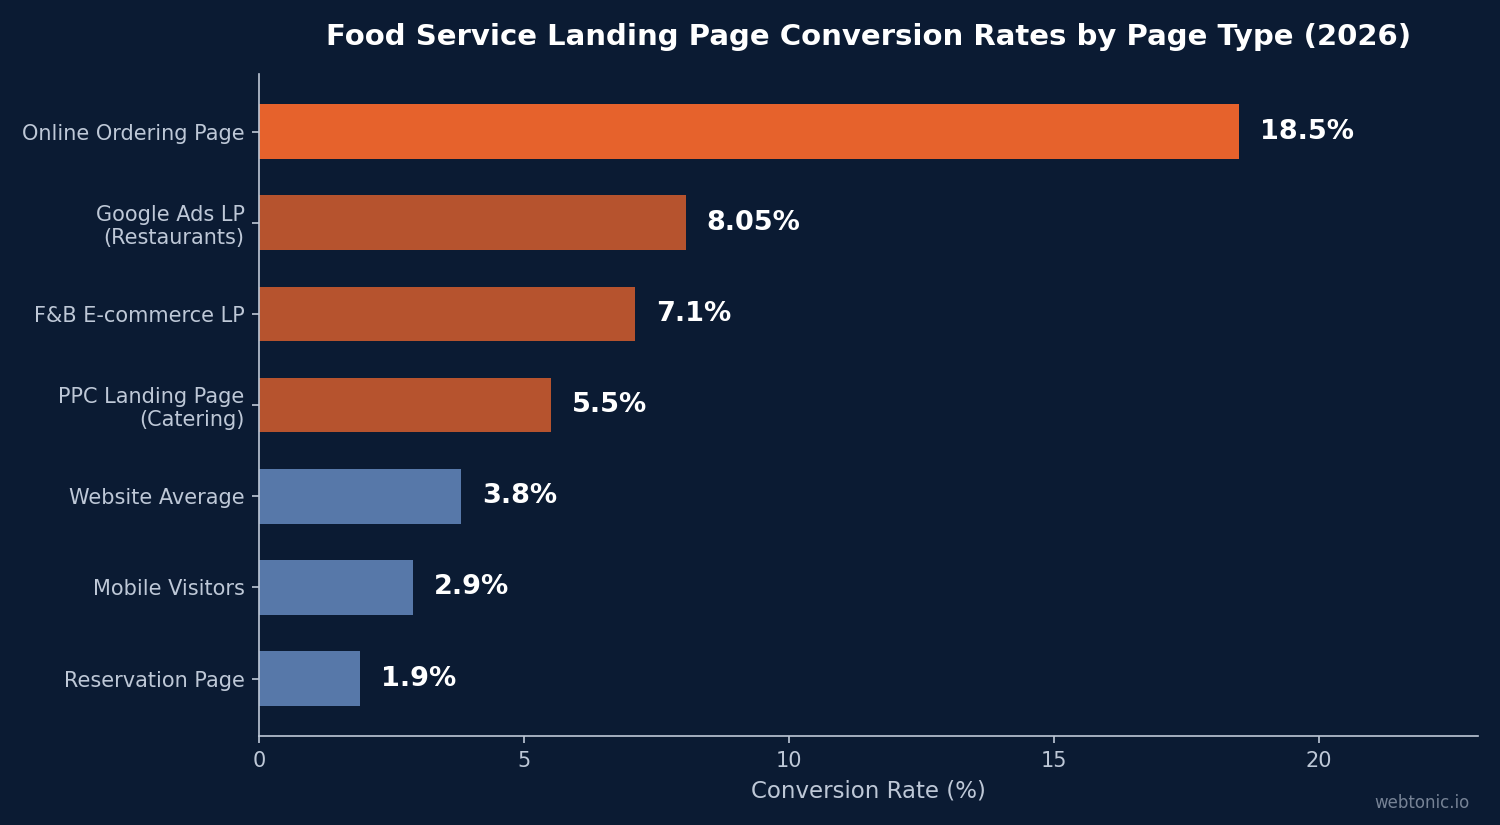
- Catering websites convert at 3.8% on average, but dedicated landing pages receiving PPC traffic reach 5.5% — a 45% lift over site-wide rates (CuFinder, 2026).
- Online ordering pages hit an 18.5% conversion rate once a visitor lands on the checkout subdomain, showing that reducing friction drives outsized results (CuFinder, 2026).
- Mobile visitors convert at only 2.9% — roughly 24% lower than the blended average — despite accounting for 68.4% of all food-service traffic (CuFinder; RayApp, 2026).
- Every additional second of load time costs restaurants roughly 7% of conversions, translating to $12,600–$25,200 in lost annual revenue for mid-size operators (RichMenu, 2026).
- Form abandonment in catering sits at 48%, driven by long inquiry forms that require event details before building any trust (CuFinder, 2026).
- Top-performing restaurant tech platforms reach 12.1% website conversion rates, more than 6× the industry average of 1–2% (SaasHero, 2026).
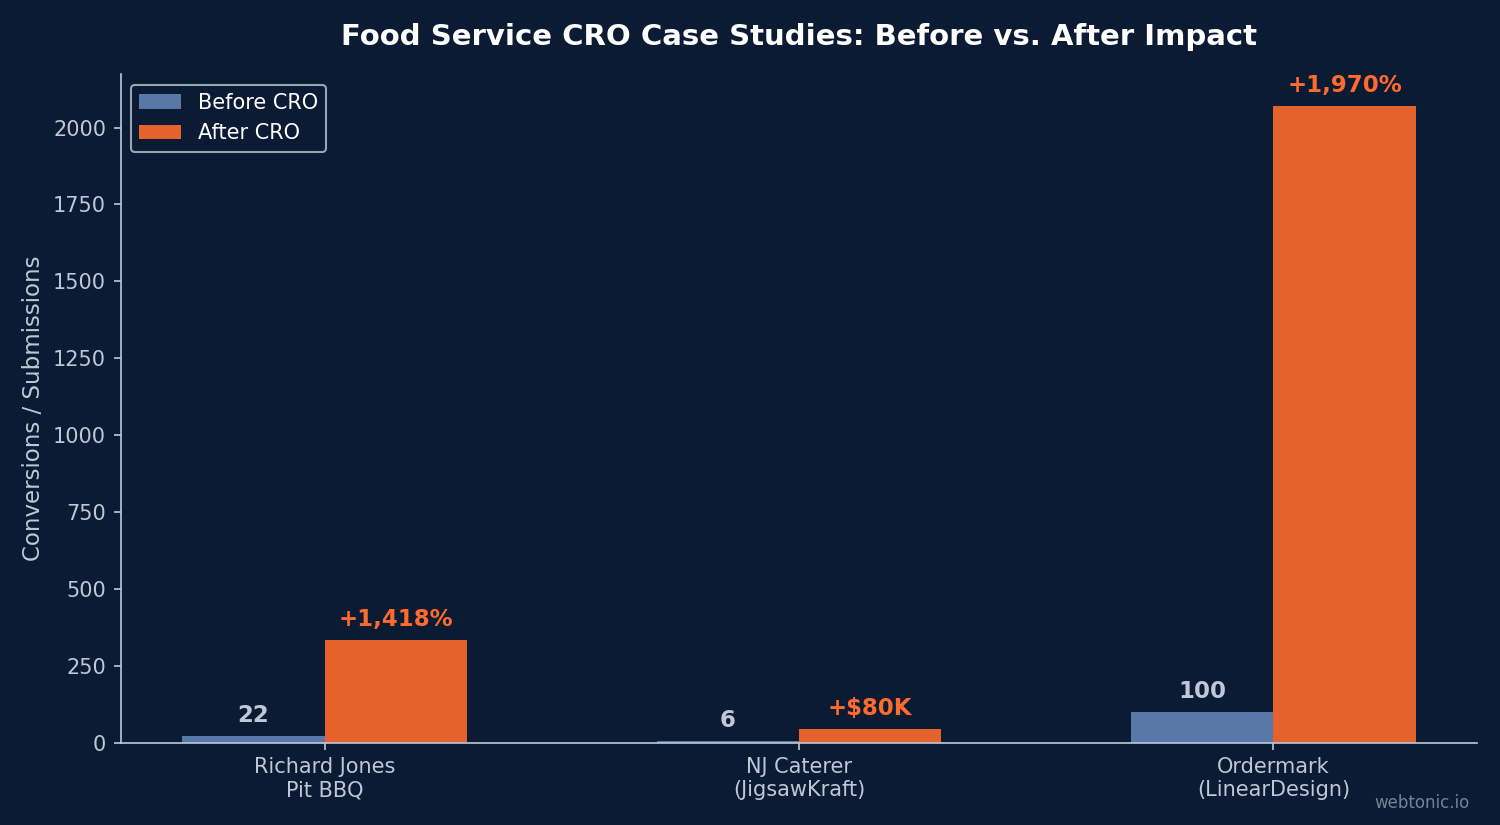
- A single-page redesign added $80,000 in corporate contracts for a New Jersey caterer by cutting bounce rate from 79% to under 40% (JigsawKraft, 2026).
Food Service & Catering Landing Page Benchmarks at a Glance
The table below aggregates the most-cited 2026 benchmarks for catering and restaurant landing pages, drawn from multiple industry studies. Use these numbers to gauge where your pages stand relative to the sector.
| Metric | Industry Average | Top 25% | Source |
|---|---|---|---|
| Website Conversion Rate | 3.8% | 12.1% | CuFinder / SaasHero |
| Landing Page CVR (PPC) | 5.5% | 10.8% | CuFinder / Colorlib |
| Online Ordering Page CVR | 18.5% | — | CuFinder |
| Mobile Conversion Rate | 2.9% | 5.2% | CuFinder |
| Form Abandonment Rate | 48% | ≤ 30% | CuFinder |
| Google Ads CVR (Restaurants) | 8.05% | — | WordStream, 2026 |
| F&B E-commerce LP CVR | 7.1% | — | Unbounce Benchmark |
| Avg. Mobile Load Time | 8.6 s | ≤ 2.5 s | RayApp, 2026 |
Conversion Rate Breakdown by Page Type
Not all pages on a catering website perform equally. Online ordering subdomains convert at 18.5% because the visitor has already decided to buy — they just need a frictionless path to checkout (CuFinder, 2026). By contrast, a homepage or generic services page sits at the site-wide 3.8% average, handling a mix of informational and transactional intent.
Dedicated PPC landing pages outperform both. When a caterer directs Google Ads traffic to a page built specifically for "corporate catering" or "wedding catering quote," the conversion rate jumps to 5.5% — a 45% improvement over the site-wide number (CuFinder, 2026). Food service Google Ads benchmarks confirm that restaurants achieve an 8.05% conversion rate on search ads when the landing page matches keyword intent (WordStream, 2026).
Reservation-specific landing pages convert at roughly 1.9% for dine-in bookings (Gitnux, 2026), reflecting the lower urgency of restaurant browsing compared to catering inquiry forms, which carry higher average order values and stronger buyer intent.
Mobile Performance: The Biggest Conversion Leak
Mobile devices account for 68.4% of all catering website traffic (CuFinder, 2026), yet mobile conversion rates lag desktop by a wide margin. The 2.9% mobile conversion rate versus the blended 3.8% average means caterers are losing nearly one in four potential conversions on the device where most discovery happens.
Speed is the primary culprit. The average restaurant website loads in 8.6 seconds on mobile, more than three times the 2.5-second desktop benchmark (RayApp, 2026). Only 32% of restaurant websites achieve "good" LCP scores, compared to 59% across all industries (RichMenu, 2026). Unoptimized food photography is the usual bottleneck — hero images frequently exceed 2 MB without lazy loading or next-gen formats.
A Muntin Digital audit of 50 restaurant websites found that 68% had mobile load times above 3 seconds, costing an estimated 0.18 percentage points of conversion per site. Even more damaging, 71% lacked a direct-order CTA above third-party aggregator links, surrendering margin to platforms like DoorDash and Uber Eats (Muntin Digital, 2026).
Form Design and Abandonment Patterns
Catering inquiry forms suffer a 48% abandonment rate — substantially above the cross-industry average of 28% for lead-gen forms (CuFinder, 2026). The gap exists because catering forms typically ask for event date, guest count, menu preferences, venue address, and dietary restrictions before offering a single price signal.
Operators who restructure forms into multi-step wizards report significant drops in abandonment. Reducing visible fields to 3–4 per step, enabling autofill, and keeping the CTA button thumb-friendly are the highest-impact changes (CuFinder, 2026). A New Jersey caterer demonstrated this dramatically: their original catering services page had a 79% bounce rate with only 4–6 inquiry submissions per month from 820 visitors. After a CRO-focused redesign — clearer pricing tiers, social proof, and a simplified form — the business secured $80,000 in new corporate contracts (JigsawKraft, 2026).
Similarly, Richard Jones Pit BBQ saw online order form submissions climb from 22 to 334 — a 1,418% increase — after a conversion-focused website redesign that prioritized menu visibility and checkout simplicity (The Art of Online Marketing, 2026).
Landing Page Speed vs. Revenue: Quantifying the Cost
RichMenu modeled the financial impact of page speed on restaurant online orders and found that each additional second of load time reduces conversions by approximately 7%. For a restaurant doing $15,000/month in online orders, one extra second costs $1,050/month — or $12,600/year. At $30,000/month in volume, the annual loss doubles to $25,200 (RichMenu, 2026).
| Monthly Online Orders | Revenue Lost per Extra Second | Annual Loss |
|---|---|---|
| $15,000/mo | $1,050/mo | $12,600 |
| $30,000/mo | $2,100/mo | $25,200 |
| $60,000/mo | $4,200/mo | $50,400 |
The takeaway for caterers running paid social or search ads: every dollar spent driving traffic to a slow page is partially wasted. Compressing images, implementing lazy loading, and switching to a CDN are the fastest levers to recover that lost revenue.
CRO Case Studies in Food Service
Beyond aggregate benchmarks, individual case studies reveal how targeted landing-page improvements translate into measurable business outcomes:
- Nando's (Velstar): A structured CRO programme delivered 7× ROI within the first three months, focusing on checkout flow optimization and upsell sequencing (Velstar).
- Ordermark (LinearDesign): Landing page redesign lowered cost per lead by 48% and increased conversions by 1,970% through simplified messaging and a single-CTA layout (LinearDesign).
- Richard Jones Pit BBQ: Post-redesign order form submissions went from 22 to 334 per year — a 1,418% lift — by making menu items browsable and reducing checkout steps (The Art of Online Marketing, 2026).
- New Jersey Caterer (JigsawKraft): Fixing a single catering services page — adding pricing tiers, testimonials, and a shorter form — generated $80,000 in new corporate contracts (JigsawKraft, 2026).
Industry Comparison: Food Service Landing Pages vs. Other Verticals
How does food service compare to other industries in landing-page performance? The data shows catering sits in the middle of the pack for PPC landing pages but significantly outperforms on ordering-specific pages.
| Industry | Avg. LP CVR | Top 25% CVR | Source |
|---|---|---|---|
| Fitness & Nutrition | 5.6% | 10.8% | Colorlib / Unbounce |
| Food & Beverage (E-com) | 7.1% | — | Unbounce |
| Catering (PPC LP) | 5.5% | ~10% | CuFinder |
| Legal | 5.4% | 10.2% | Colorlib / Unbounce |
| SaaS | 4.2% | 8.8% | Colorlib / Unbounce |
| E-commerce (General) | 3.7% | 7.4% | Colorlib / Unbounce |
| Real Estate | 3.6% | 7.1% | Colorlib / Unbounce |
Caterers running dedicated landing pages for growth marketing campaigns should aim for the 10%+ tier, which is achievable given the high purchase intent typical of catering inquiries — especially corporate and wedding segments where average order values often exceed $2,000.
Event-Specific Landing Pages: Where the Highest Value Lives
For food service operators, the most profitable landing pages target specific event types. Wedding catering inquiry pages typically command the highest average order values — often exceeding $5,000 per booking — because couples plan months in advance and compare fewer providers than corporate clients. A dedicated wedding catering page with a portfolio gallery, sample menus, and a streamlined quote request form outperforms a generic catering services page by a wide margin.
Corporate catering landing pages serve a different function. Business clients need to book quickly, often on the same day or within 48 hours. Pages targeting corporate event planners and office catering should emphasize speed of service, delivery reliability, and minimum order sizes. Food service businesses that separate their corporate and social event pages report stronger lead quality because each client type has distinct decision criteria.
Local catering operators can further segment by event type — holiday parties, team lunches, product launches, and fundraiser events all respond better to tailored messaging than a one-size-fits-all approach. Industry data shows that the more specific the landing page, the higher the conversion rate, because the visitor immediately sees that the catering business understands their particular needs. For business owners managing multiple event categories, creating a dedicated page per category and driving local paid search traffic to the matching page is the highest-ROI strategy in the food service industry today.
Best Practices for Higher-Converting Catering Landing Pages
Based on the benchmarks and case studies above, these are the highest-impact optimizations for food-service landing pages:
- Build intent-specific pages — Create separate landing pages for "corporate catering," "wedding catering," and "event catering" rather than sending all PPC traffic to a generic services page. Intent-matched pages convert 45% higher on average.
- Compress and lazy-load food photography — Unoptimized images are the #1 cause of slow restaurant pages. Target under 200 KB per hero image using WebP format.
- Use multi-step forms — Break catering inquiry forms into 3–4 steps with 2–3 fields each. This alone can cut the 48% abandonment rate below 30%.
- Place the CTA above aggregator links — 71% of restaurant sites bury their direct ordering CTA below third-party delivery links, surrendering margins of 15–30% per order.
- Show pricing ranges early — Catering prospects need a ballpark before they commit to filling out a form. Adding "starting at $XX/person" near the form can cut bounce rates significantly.
- Optimize for mobile-first — With 68.4% of traffic on mobile and a 2.9% mobile CVR, mobile-specific design (thumb-friendly buttons, sticky CTAs, fast load) is the single biggest lever.
- Add social proof near the form — Testimonials, client logos, and review badges placed within the visual path of the inquiry form reinforce trust at the decision point.
Planning Your Catering Landing Page Strategy
Building an effective landing page plan for a catering operation starts with understanding how customers book. Most catering bookings originate from Google searches — particularly "catering near me" and event-specific queries — making SEO and paid search the primary traffic sources for catering landing pages. The operator who aligns page content with search intent captures more qualified leads at every stage of the marketing funnel.
A practical plan for food service operators includes three pages at minimum: one for corporate event catering (meetings, conferences, office lunches), one for social events (weddings, birthdays, holiday parties), and one for daily meal services (office catering subscriptions, school lunch programs). Each page should feature event-specific imagery, pricing ranges, booking timelines, and client testimonials from that category.
The booking process on these pages matters enormously. Industry operators who add an instant quote calculator or same-day booking confirmation reduce friction and convert at rates well above the 5.5% industry average. Catering services businesses that invest time in page-level analytics — tracking which pages drive bookings, which CTAs get clicks, and where visitors drop off — consistently outperform competitors who rely on a single generic services page. For marketing teams managing multiple catering locations, templated landing pages with local customization (area-specific menus, local event references, Google Maps embeds) scale this approach across markets efficiently.
Related reading
- Food Service & Catering Shopify Statistics: 2026 Store Growth, CVR & Ecommerce Data
- WordPress in Food Service & Catering: 2026 Usage, Cost & Performance Statistics
- 2026 Webflow Stats for Food Service & Catering: Benchmarks That Matter
- Landing Page Design services at Web Tonic
Frequently Asked Questions
What is a good landing page conversion rate for a catering business?
A good conversion rate for a catering landing page is 5.5% or higher when receiving PPC traffic, according to 2026 CuFinder benchmarks. Top-performing operators push past 10% by using intent-matched pages, multi-step forms, and strong social proof. The site-wide average across all page types is lower at 3.8%, so dedicated landing pages with clear calls to action consistently outperform general website pages.
Why do catering inquiry forms have such high abandonment rates?
Catering forms abandon at 48% because they typically require detailed event information — date, guest count, menu preferences, dietary restrictions, and venue address — before providing any price indication. Visitors lose motivation without a value signal. Switching to multi-step wizards with 2–3 fields per step, enabling autofill, and showing instant pricing estimates reduce abandonment to below 30% in most cases.
How much does slow page speed cost a food-service business?
Each extra second of load time costs approximately 7% of conversions. For a restaurant generating $15,000/month in online orders, that translates to $12,600 in annual lost revenue per extra second. Given that the average restaurant mobile page loads in 8.6 seconds — more than three times the 2.5-second desktop average — the speed gap represents a substantial revenue leak for most operators.
How do food-service landing pages compare to other industries?
Catering PPC landing pages convert at 5.5%, placing them above e-commerce (3.7%), real estate (3.6%), and SaaS (4.2%), but below fitness (5.6%) and food-and-beverage e-commerce sites (7.1%). The catering sector benefits from high purchase intent — visitors searching for catering services are typically ready to buy — which gives well-optimized pages a strong conversion ceiling above 10%.
What is the biggest conversion optimization lever for restaurant websites?
Mobile optimization is the single biggest lever. With 68.4% of traffic on mobile and a conversion rate of only 2.9% (vs. 3.8% blended), closing the mobile gap represents the largest untapped opportunity. Compressing images, implementing lazy loading, using a CDN, and designing thumb-friendly CTAs can narrow the mobile-desktop conversion gap by 40–60% based on documented case studies.
Sources
cufinder.io/blog/benchmarks/catering
cufinder.io/blog/benchmarks/restaurants
wordstream.com — 2026 Google Ads Benchmarks
colorlib.com — Landing Page Statistics 2026
gitnux.org — Website Conversion Statistics
saashero.net — Restaurant Tech Conversion Optimization
richmenu.io — Restaurant Website Speed 2026
blog.rayapp.ai — Restaurant Website Speed Mobile
muntin.digital — The 1% Margin Audit
jigsawkraft.com — Catering Business Website Optimization
theartofonlinemarketing.com — Richard Jones Pit BBQ Case Study
velstar.agency — Nando's CRO Case Study
lineardesign.com — Ordermark Case Study


