Table of contents
Facebook and Google are two different advertising machines, not two versions of the same one. Google sells access to stated intent through search; Facebook sells access to attention and behavioural data across feeds. That structural difference explains almost every cost, targeting and measurement gap between them.
Key Takeaways
- Cost gap is structural, not competitive: average CPC was $0.70 on Facebook traffic buys against $5.26 on Google in the same 2025 benchmark set.
- Its advantage is stated intent; the feed side offers inferred interest across roughly 3.07 billion monthly users.
- Both run second-price-style auctions, but Google adds Quality Score on a 1-10 scale while Meta ranks on estimated action rates and ad quality.
- Organic reach is not a substitute on either side: the average organic engagement rate is 0.15% and link posts sit at just 0.05%.
- The two platforms will never report the same number, because their default attribution windows and view-through rules differ by design.
The two systems at a glance
Start with what each company actually sells an advertiser, before comparing tactics.
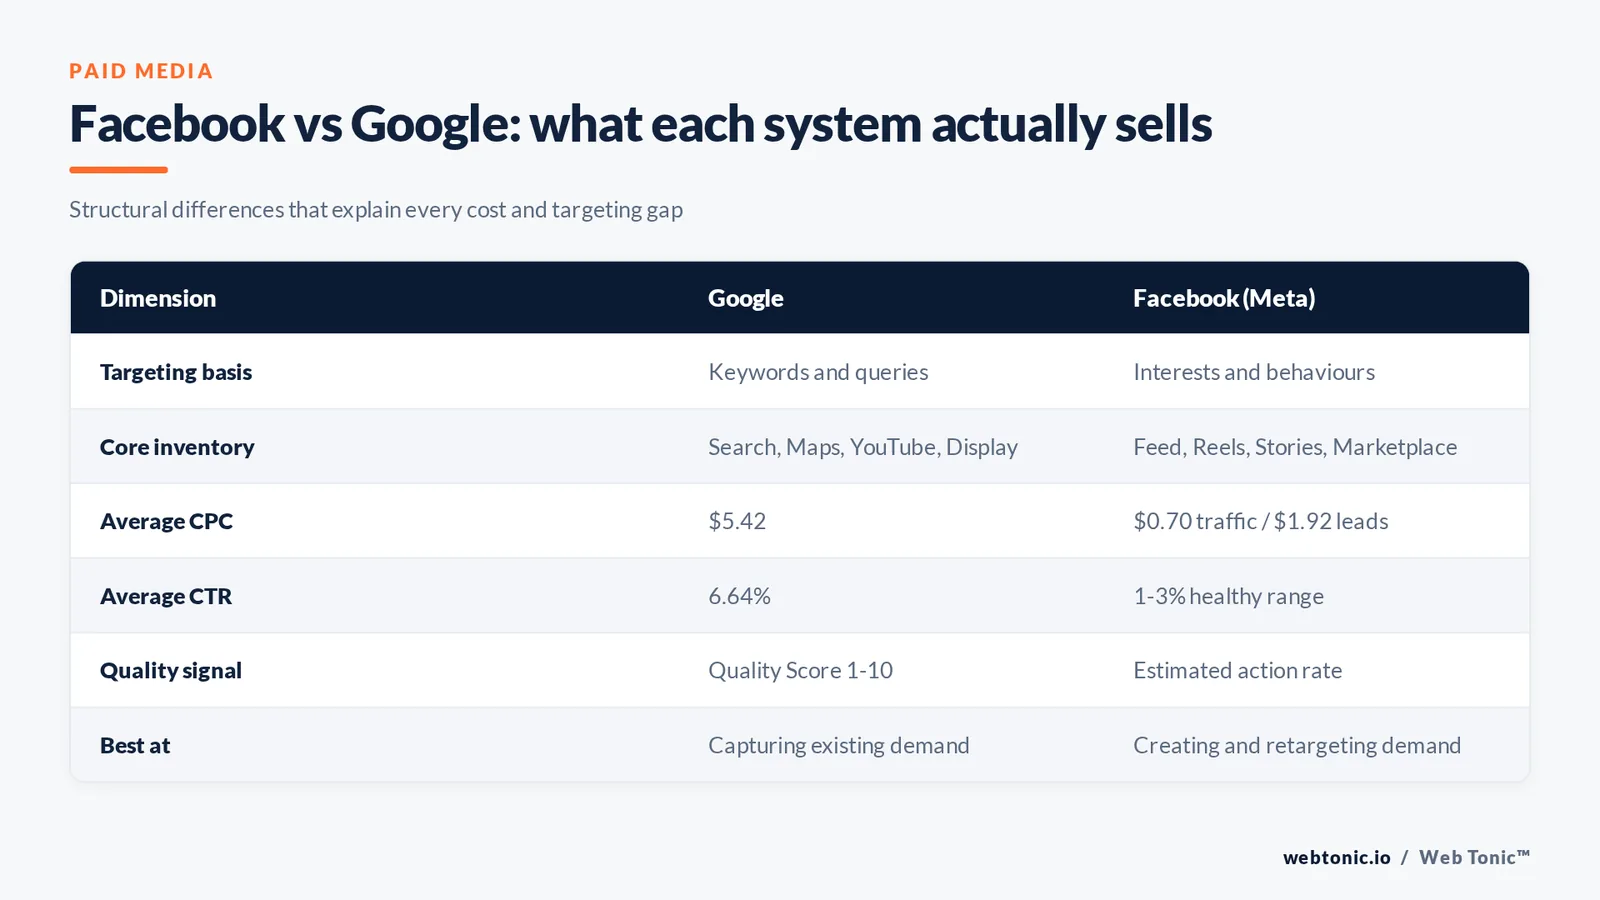
| Dimension | Facebook (Meta) | Why it matters | |
|---|---|---|---|
| Core inventory | Search results, Maps, YouTube, Gmail, Display network | Facebook feed, Reels, Stories, Marketplace, Instagram, Audience Network | Determines the mindset of the person seeing the ad |
| Targeting basis | Keywords and search queries | Demographics, interests, behaviours, custom lists | Intent versus interest |
| Dominant format | Text and shopping listings | Image and short video | Creative production load differs sharply |
| Average CPC | $5.26 all industries | $0.70 traffic, $1.92 leads | Click volume per dollar is not close |
| Auction quality signal | Quality Score 1-10 plus Ad Rank | Estimated action rate and ad quality ranking | Both reward relevance, differently |
| Reported audience | Search demand across billions of daily queries | ~3.07B monthly active users | Both are effectively unlimited reach |
| Best at | Capturing demand that already exists | Creating demand and retargeting it | They are sequential, not interchangeable |
Search click cost of $5.42 all-industry and a 6.64% average CTR come from WordStream's search benchmarks; the Meta figures come from its Meta cost study. Our growth marketing teams treat the two as one funnel with two entry points.
Where each one reaches people
Fact 1 — the surface an ad appears on predicts performance more reliably than the platform brand does.
| Surface | Platform | User mindset | Realistic role |
|---|---|---|---|
| Search results | Actively solving a problem now | Bottom-funnel capture | |
| Google Maps and local pack | Choosing a nearby provider | Local demand capture | |
| YouTube | Watching, semi-attentive | Awareness and consideration | |
| Display network | Browsing unrelated content | Retargeting and cheap reach | |
| Facebook feed | Scrolling socially | Demand creation, retargeting | |
| Reels and Stories | Facebook / Instagram | Entertainment, sound-on or off | Video-first awareness |
| Marketplace | Shopping mindset on-platform | Ecommerce and local goods | |
| Audience Network | In third-party apps | Incremental cheap reach |
Search share context matters here: Search still concentrates the overwhelming majority of desktop and mobile search per StatCounter, while DataReportal puts global social users in the billions. Neither platform is short of inventory — the differentiator is which surface your creative can win on. If short video is the constraint, start with Facebook video ads.
Two auctions, two ranking systems
Rule 2 — in both auctions the highest bid does not win; the highest expected value to the platform wins.
| Mechanic | Search auction | Feed auction |
|---|---|---|
| Quality signal | Quality Score, reported 1-10 across three components | Estimated action rate plus ad quality and engagement rate rankings |
| Components | Expected CTR, ad relevance, landing page experience | Predicted action rate, ad quality, historical engagement |
| What raises it | Tighter keyword-to-ad-to-page match | Creative that earns fast positive engagement |
| Bid inputs | Max CPC or automated target CPA / ROAS | Lowest cost, cost cap, bid cap or ROAS goal |
| Learning behaviour | Smart Bidding stabilises over conversions accumulated | Ad set needs roughly 50 events per week to exit learning |
| Penalty for weak relevance | Higher CPC for the same position | Lower delivery volume at the same bid |
Google publishes the mechanics openly: read its documentation on Quality Score and on how ad position and Ad Rank are determined. The practical consequence is asymmetric — on search you fix cost by fixing relevance and landing pages, on social you fix cost by fixing creative. Our performance creative workflow exists because of that second sentence.
Intent versus interest: what each platform knows
Limit 3: Facebook can tell you who someone probably is; Google can tell you what they just typed. Neither knows both.
| Signal | Search side | Feed side | Practical use |
|---|---|---|---|
| Explicit query | Yes — the exact search phrase | No | Match ad copy to the phrase |
| Demographics | Limited, inferred | Detailed and self-reported | Persona-led creative |
| Interests and behaviours | Affinity and in-market segments | Extensive interest graph | Cold prospecting |
| First-party list matching | Customer Match | Custom Audiences | Retargeting and suppression |
| Lookalike expansion | Similar segments (limited) | Lookalike audiences 1-10% | Scaling past a proven list |
| On-site behaviour | Analytics and tag-based audiences | Pixel and Conversions API events | Funnel-stage targeting |
| Location precision | Radius, city, region, postcode | Radius, city, region, postcode | Local service businesses |
Keyword research is the input on one side, audience research on the other. For the search side, keyword tooling defines the addressable market; for the social side, audience size and creative angle do. We cover the Meta-side mechanics in Facebook ad objectives.
Ad formats and creative load
The hidden cost difference is production, not media. A search account can run for months on text; a Facebook account cannot.
| Format | Platform | Production effort | Refresh cadence |
|---|---|---|---|
| Responsive search ads | Low — headlines and descriptions | Quarterly asset swaps | |
| Shopping and product listings | Low once the feed is clean | Feed-driven, continuous | |
| Performance Max assets | Medium — images, video, text | Every 4-8 weeks | |
| YouTube video | High | Every 6-8 weeks | |
| Single image ads | Low-medium | Every 2-4 weeks | |
| Short video and Reels | High | Every 2-3 weeks | |
| Carousel and collection | Medium | Every 3-4 weeks | |
| Catalog and dynamic ads | Low once the feed is clean | Feed-driven, continuous |
Plan for that cadence honestly. Creative fatigue on social is measured in weeks, and organic posting will not carry the slack: Socialinsider's analysis of 25 million posts from 130,683 pages found engagement flat at 0.15%, with brands cutting output 22% to about 39 posts per month. Copy patterns that survive that environment are collected in Facebook ad copy examples.
Privacy, tracking and why the numbers disagree
Fact 4 — the two platforms are measuring different events over different windows, so a mismatch of 20-40% between their dashboards is normal, not a bug.
| Measurement factor | Search side | Feed side | Effect on reported results |
|---|---|---|---|
| Default click window | Varies by conversion action, commonly 30 days | Typically 7 days | Google reports later conversions |
| View-through | Counted separately for Display and video | 1-day view-through included by default | Facebook credits impressions Google would not |
| Cross-device | Signed-in account graph | Logged-in account graph | Both claim conversions the other misses |
| Server-side option | Enhanced conversions and server tagging | Conversions API | Improves match rates on both |
| iOS opt-outs | Modelled conversions | Aggregated, delayed reporting | Underreporting on Facebook skews CPA up |
| Consent handling | Consent Mode with modelling | Limited data use flags | Regional gaps in both datasets |
Google documents its side in its conversion tracking guidance and its engagement measurement reference; Apple's App Tracking Transparency rules explain the iOS gap. The only fix is a blended source of truth, which is exactly what data intelligence work is for.
Cost comparison by vertical
Real numbers, same research period, so the comparison is fair.
| Metric | Search side | Feed side | Read this as |
|---|---|---|---|
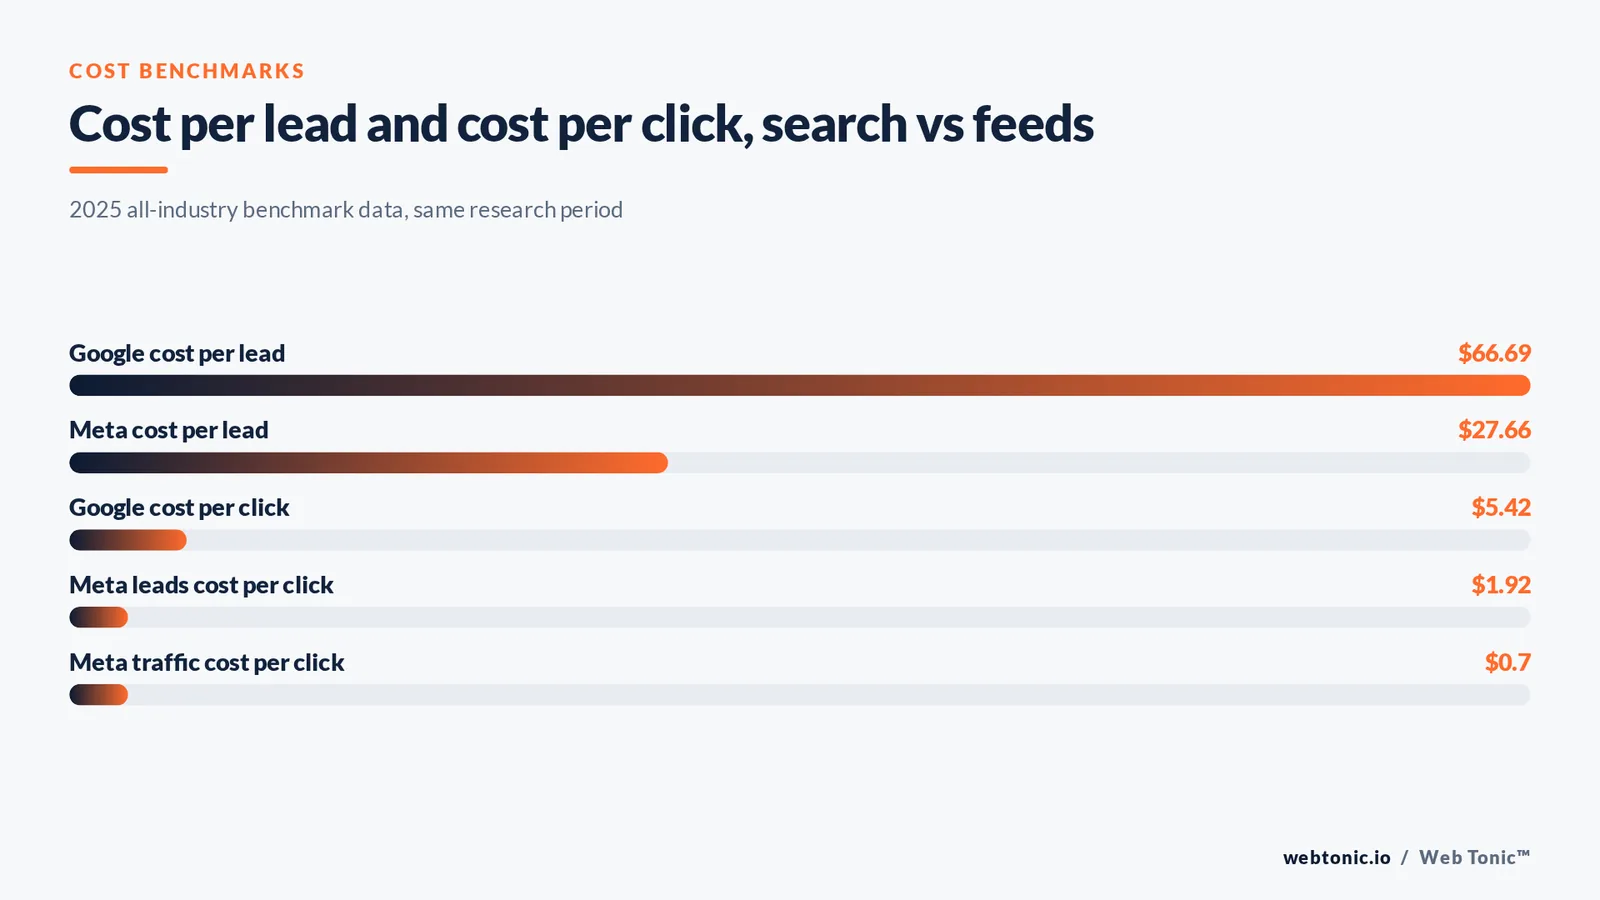
| Average CPC | $5.42 | $0.70 traffic / $1.92 leads | Social clicks are 3-7x cheaper |
| Average CTR | 6.64% | 1-3% healthy range | Search users are pre-qualified |
| Average conversion rate | 8.18% | Varies widely by offer | Intent converts |
| Average cost per lead | $66.69 | $27.66 | Cheaper leads, usually colder |
| Cheapest vertical | Arts and entertainment (low CPC) | Shopping and gifts at $0.34 | Low-consideration goods win on social |
| Priciest vertical | Legal at $9.87 per click | Dentists at $9.78 per lead click | High-value services pay on both |
| Home improvement CPC | $8.33 | Below $2 typical | Big spread on the same customer |
The cost-per-lead line is where most arguments start. A $27.66 Facebook lead and a $66.69 Google lead are not the same asset — the search lead typed a purchase-shaped query, the social lead saw an ad. Grade both on closed revenue, not cost. Vertical detail sits in Google Ads benchmarks, and broader spend trends in eMarketer's advertising research.
Which one fits which situation
Eight concrete scenarios and the one we would fund first.
| Situation | Fund first | Why | Add second |
|---|---|---|---|
| Emergency service (plumber, locksmith) | Demand is urgent and query-driven | Facebook for brand recall | |
| New consumer product nobody searches for | There is no search volume to capture yet | Google once branded searches appear | |
| Ecommerce with 500+ SKUs | Both feeds | Shopping and catalog ads carry the load | Video for prospecting |
| B2B software, long sales cycle | High-intent problem queries | Facebook for nurture and retargeting | |
| Local restaurant or salon | Visual, impulse, radius-based | Google for “near me” capture | |
| Regulated finance or legal service | Intent justifies a $9.87 click | Facebook carefully, policy permitting | |
| Event or ticket sales | Interest targeting plus urgency creative | Google for branded event searches | |
| Mobile app launch | App promotion machinery is stronger | Google App campaigns to broaden |
Budget-split modelling and a 30-day test protocol are covered separately in Meta ads vs Google Ads; this page is about the platform-level differences that make those splits behave the way they do. If you would rather have it mapped against your own numbers, get in touch.
Running both without double-paying
Rule 5 — when both platforms run, they compete for credit on the same conversions. Structure to prevent it.
| Overlap risk | How it shows up | Control |
|---|---|---|
| Branded search cannibalisation | Facebook creates demand, Google branded ads bill for it | Track branded versus non-branded search separately |
| Double-counted conversions | Both dashboards claim the same sale | Reconcile against one analytics or CRM source |
| Retargeting collision | Same user hit on Display and Facebook the same hour | Cap frequency and stagger audience windows |
| Audience suppression gaps | Existing customers paid for twice | Upload suppression lists to both platforms |
| Creative message clash | Different offers running simultaneously | One offer calendar across both channels |
| Attribution shopping | Reporting whichever platform looks better | Fix one primary source of truth before launch |
A workable rule of thumb: hold 60-70% of budget on the platform that matches your demand reality (search for existing demand, social for created demand), run the other at 30-40%, and judge both on blended cost per acquisition and blended ROAS. Industry measurement guidance from the IAB and platform change coverage from PPC Land are useful reference points when the two dashboards fight.

How the mix fits a marketing strategy by business stage
The right answer changes as a business grows online. Below is the strategy we would put in front of a client at each stage, with the monthly spend it realistically needs.
| Business stage | Strategy | Monthly spend to be useful | Where new customers come from | Primary metric to report |
|---|---|---|---|---|
| Pre-launch, no demand | Facebook only, learn what message works | $1,500-3,000 | Interest and lookalike audiences | Cost per landing page view |
| Early revenue, some branded search | Facebook prospecting plus Google branded defence | $3,000-6,000 | Social discovery, branded search capture | Blended cost per acquisition |
| Proven offer, real search volume | Google non-branded plus Facebook retargeting | $6,000-15,000 | High-intent queries, warm retargeting | Cost per qualified lead |
| Scaling, multi-channel | Both platforms running full funnel | $15,000-50,000 | Search, feeds, video, catalog | Blended ROAS and marginal CPA |
| Mature, market-leading | Both plus incrementality testing | $50,000+ | Every surface, measured against holdouts | Incremental profit per dollar |
Notice the spend column. Running both platforms badly is the most expensive strategy on the list, because each one is fighting the learning phase every week. Below roughly $3,000 a month, pick the single best-fit channel, get clear signal, and only then add the second. Marketers who post that plan in writing before launch argue about attribution far less later.
Metrics to report weekly on each side
Same business, two dashboards, two reporting rhythms. This is the weekly report we run for clients running both.
| Metric | Search reading | Feed reading | Why it matters this week | Action trigger |
|---|---|---|---|---|
| Spend pacing | Percent of monthly budget spent | Percent of monthly budget spent | Prevents mid-month starvation | Off pace by more than 15% |
| Cost per click | Rising CPC signals auction pressure | Rising CPC often signals creative fatigue | Diagnoses different problems | Up more than 20% week on week |
| Click-through rate | Ad relevance and query match | Creative resonance | Leading indicator on both | Down 2 weeks running |
| Landing page conversion rate | Page and offer strength | Page and offer strength | The one shared metric | Below your rolling 8-week average |
| Cost per lead or purchase | Intent efficiency | Interest efficiency | Compare against target, not each other | Above target 2 weeks running |
| New customers versus repeat | Search skews existing demand | Feeds reach new people | Growth versus harvesting | New-customer share falling |
| Learning phase status | Smart Bidding stability | Ad sets under 50 weekly events | Explains unstable results | Any ad set stuck in learning |
Fact 6 — reporting both in one blended view is the only way to keep the weekly conversation about customers and profit instead of about which dashboard looks best. Marketing teams that report 7-day rolling numbers alongside 28-day ones catch fatigue and seasonality early, which is the practical value of a good reporting cadence.
Scaling: what higher spend does to each side
Scale behaves differently on the two systems, and knowing how is worth more than any platform preference.
| Scaling lever | On search | On feeds | Risk when you push |
|---|---|---|---|
| Raise budgets | CPC climbs as you buy lower-quality queries | Delivery widens and CPA drifts up | Efficiency erodes gradually on both |
| Add campaigns | New keyword sets expand reach cleanly | Fragmentation starves ad sets of events | Facebook punishes over-segmentation |
| Broaden targeting | Match types and audience expansion | Broad plus Advantage+ audience | Wasted spend without exclusions |
| Add creative | Asset refresh, new RSAs | New concepts every 2-3 weeks | Production capacity becomes the ceiling |
| Add surfaces | YouTube, Display, Performance Max | Reels, Stories, Marketplace, Audience Network | Weak surfaces dilute reported results |
| Improve landing pages | Directly lowers CPC via Quality Score | No auction discount, but lifts conversion rate | The best shared investment of the two |
That last row is the least glamorous and the most reliable. A faster, clearer landing page lowers cost per click through Quality Score and raises feed-side conversion rate at the same time — the only lever in this comparison that pays twice. Our web development team treats it as a paid media task, not a website task.
Five mistakes when comparing the two
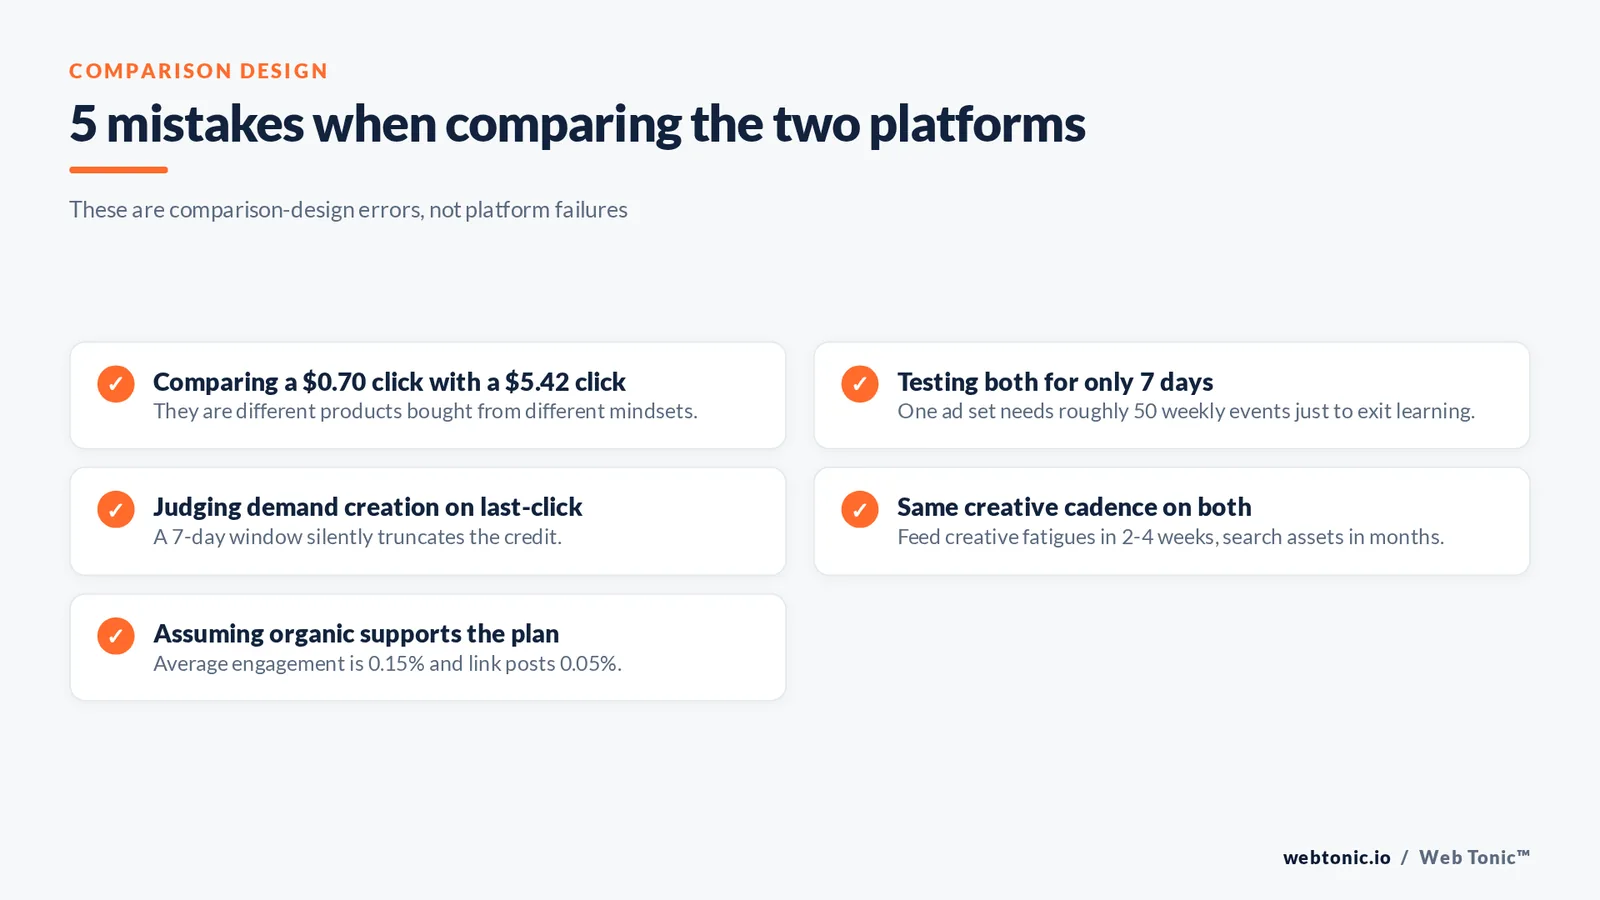
- Mistake 1 — comparing a $0.70 social click with a $5.42 search click as if they were the same product.
- Mistake 2 — testing both for 7 days when one ad set needs roughly 50 weekly events just to exit learning.
- Mistake 3 — judging a demand-creation channel on last-click revenue while a 7-day window silently truncates it.
- Mistake 4 — giving social the same creative refresh cadence as search, then reading fatigue at week 3 as platform failure.
- Mistake 5 — assuming organic will support the paid plan when average engagement sits at 0.15% and link posts at 0.05%.
None of those is a platform problem. They are comparison-design problems, and they are the reason most “which is better” debates never resolve. More paid media breakdowns sit on our blog.
FAQ
Is Facebook or Google better for advertising?
Neither, in the abstract. Google is better when people already search for what you sell; Facebook is better when they do not yet know they want it. Businesses with both existing demand and a visual product usually run both.
Why are Facebook clicks so much cheaper than Google clicks?
Because they buy different things. Benchmark data shows about $0.70 per click on Facebook traffic campaigns versus $5.42 on search, but the search click came from someone who typed a purchase-shaped query, so it converts at a far higher rate.
Do Facebook and Google report conversions differently?
Yes, by design. Facebook typically uses a 7-day click plus 1-day view window and includes view-through conversions; Google conversion windows are configurable and commonly longer. Reconcile both against one analytics or CRM source.
Can I run the same ads on Facebook and Google?
Only the message should travel, not the asset. Search rewards keyword-matched text, social rewards native-feeling image and short video, and social creative fatigues in two to four weeks against a quarterly cadence on search.
How should I split budget between Facebook and Google?
Weight 60-70% toward the platform matching your demand reality and 30-40% toward the other, then judge both on blended cost per acquisition rather than each platform's own dashboard.